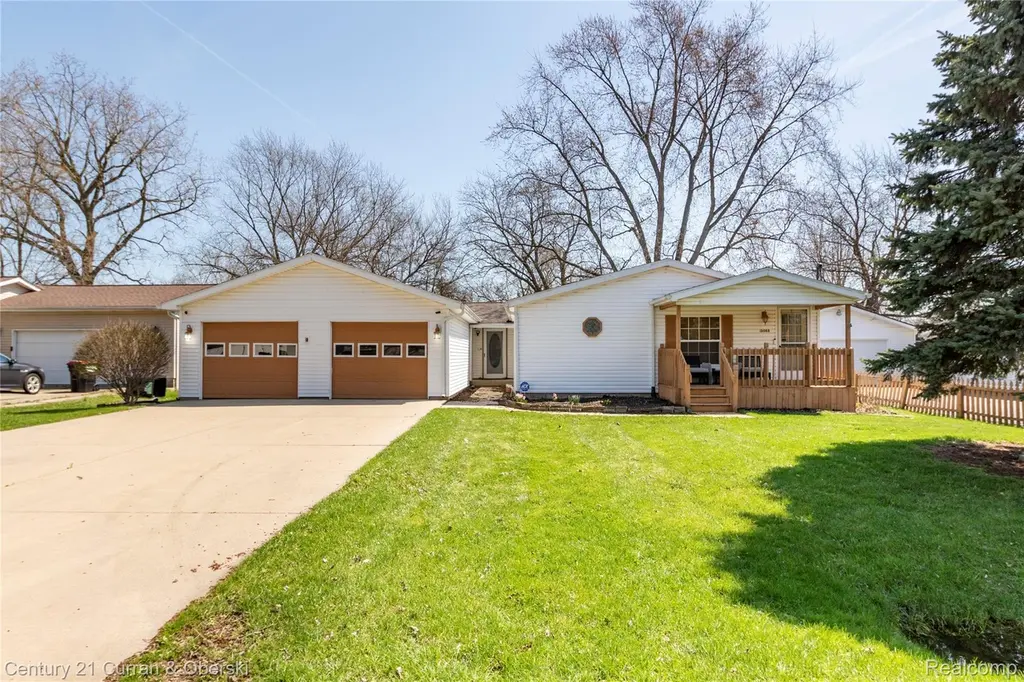
15088 Norway St · Monroe, MI
Flood risk 6/10 · Moderate
- FEMA flood zone
- X
- Chance of flooding over 30 yrs
- 0.67%
- Est. flood insurance / yr
- $507 – $1,088
Fire risk 1/10 · Minimal
- Est. fire insurance / yr
- $784 – $1,456
Heat risk 3/10 · Minor
- Hot days now (above 102°F)
- 7 days/yr
- Hot days in 30 yrs
- 15 days/yr
Wind risk 2/10 · Minimal
- Chance of severe wind over 30 yrs
- —
Air-quality risk 4/10 · Minor
- Unhealthy air days now
- 3 days/yr
- Unhealthy air days in 30 yrs
- 6 days/yr
Risk factors via First Street. Map © Google.
Why this score? — see what drove the D grade
The composite is a weighted blend of 9 inputs, each scored 0–100. Each bar is that input's sub-score; the figure is the points it added to the 100-point composite (weight × sub-score).
- ARV discount +15.0/15.0
- Cash flow +9.4/30.0
- Livability +4.2/5.0
- Schools +3.0/10.0
- DSCR +2.6/10.0
- Rent growth +2.5/5.0
- Condition / age +2.5/5.0
- 1% rule +1.9/10.0
- Appreciation +0.0/10.0
$214,900
🖨 Deal sheet (PDF) 📄 Offer letter ✓ Due diligence
Listing remarks MLS
You've combed Monroe looking for the one - the kind of home that stops you before you've even reached the door. Then you pull up to this massive masterpiece and the decision makes itself. The covered front porch sets the tone perfectly, offering room for cold beverages, summer evenings, and nights that stretch long. Step inside and the dark hardwood floors guide you into a family room that makes an immediate statement - this home is genuinely, unapologetically huge. A fireplace anchors the room, ready to crackle through every cool Michigan fall night you love. The comfy furniture of your dreams fits here with room to spare. Just ahead, a bonus room complete with its own built-in fireplace element opens the door to endless possibility - a spectacular primary suite, a guest retreat, a sanctuary. The choice is yours. The living room mirrors the family room in sheer scale, and together these two enormous spaces make any size gathering feel completely natural. The dining room holds a crowd without blinking. The kitchen rises to every occasion - generous countertops built for a full buffet spread, extensive cabinetry concealing every culinary secret, and newer appliances that make every meal feel effortless. The laundry room gives this chore the space it deserves. The bedrooms flex to fit your vision: guest room, office, gaming room - this home accommodates every idea. Then steal away to the bathroom that redefines home luxury. A jetted tub invites you to sink in, let the day dissolve, and simply breathe. A separate shower stands ready when life picks up speed. This is your private spa, on demand. A second full bath keeps every guest comfortable. The garage includes a bonus room primed for a workshop or private gym. And then - the lot. Three full quarters of an acre waiting to become something extraordinary. Pool, garden, summer BBQs the whole neighborhood shows up for - this yard makes all your outdoor dreams come true. Don't wait. Schedule your showing today.
Key facts
- Covered front porch
- Built-in fireplace
- Living room
Tags
Property features AI
Finance
- Other: Listing broker: Century 21 Curran & Oberski; Listing agent: Scott Bergeron
Exterior
- Parking: Attached 2-car garage
- Utilities: Public water; Public sewer
- Home design: Single-family residence; One level; Ground-level entry with steps
- Construction: Vinyl siding
- Exterior features: Asphalt roof; Yard includes shed(s); Dirt road access; Lot dimensions approximately 75 x 135 (0.69 acre); Subdivision: EVERGREEN ACRES; Directions: Take Plumcreek to Norway and turn right; cross street Plumcreek and Evergreen
Interior
- Bathrooms: 2 full bathrooms
- Heating & cooling: Central air conditioning; Forced-air heating with natural gas
- Interior features: Crawl space basement; Total of 10 rooms
Neighborhood map
What this means for you Summary
Snapshot
- This is a 3-bed/2.0-bath single-family listed at $215k.
Deal economics
- At list price, monthly cash flow is $-153 ($-2k/yr) — negative.
- To cash-flow at today's rent, offer at most $188k (12.5% below list).
- To meet the 1% rule (rent ≥ 1% of price), the offer needs to be $148k (31.2% below list).
- Recommended offer: $148k (31.2% below list) — sets the bar for 1% rule.
- Cap rate 5.4% vs local median 4.0% in Monroe — top-decile yield for the area; either an underpriced asset or a hidden risk that comps aren't pricing in. Stress-test before assuming the spread holds.
Location & tenants
- Location reads 83/100 on livability (#51 in MI, #1,034 nationally) — a professional / high-income tenant draw. Strengths: commute A+, cost of living A+, housing A+; Watch: employment C-, crime D+, amenities D+.
- Monroe Public Schools (suburban): math 24% / reading 47% proficiency, ranked #278 of 540 in MI (top 52%) — families likely to look elsewhere, expect single-tenant / working-renter base with shorter leases.
- Zoned schools: Custer Elementary School (math 10% / reading 30%, grade F, #1,083 of 1,397 statewide, top 78%, 741 students, 69% FRL); Monroe Middle School (math 34% / reading 64%, grade C, #127 of 493 statewide, top 26%, 653 students, 66% FRL); Monroe High School (math 25% / reading 48%, grade F, #364 of 713 statewide, top 51%, 1,304 students, 52% FRL).
- Market conditions: 152 active listings in the ZIP; 264 units permitted in Monroe County in 2024 (40 in 5+ unit buildings).
Forward outlook
- Local home prices are declining (-3.0%/yr); year-one equity from $1k of loan paydown is wiped out by about $6k of value loss. Plan a longer hold.
- Monroe County population projected at -20% by 2050 — secular population decline; favor cash flow + early exit over multi-decade hold.
Negotiation context
- Only 2 days on market — expect competitive offers; lowballing is unlikely to land.
- 17 sale attempts since 9y ago with the ask held roughly flat each time — persistent listings suggest the price (not the market) is what's stuck; bring a comps-based counter.
Risks & watch-outs
- Climate carrying-cost: major flood risk — expect insurance premiums to compound above CPI over the hold.
Questions for the listing agent
- What do current leases actually rent for vs. the listed asking? Can we see a recent rent roll and the last 12 months of T-12 income?
- Is there a deadline driving the sale (1031 exchange, divorce, estate, relocation)? That informs how much negotiation room exists.
- Schools are D-rated, which usually means shorter tenancies and higher turnover. Who's the typical renter profile here, and what's been the actual vacancy rate?
- Crime grade is D in this area — have there been break-ins, vandalism, or insurance claims at this property in the last 3 years? What carrier currently insures it and at what premium?
- The area grade is low — what's the realistic commute time and amenity access for the typical tenant pool here? Any planned neighborhood developments (good or bad) we should know about?
- What's the average days-on-market for RENTAL listings here right now (not sales)? A rising rental-DOM trend means longer vacancies and softer asking-rent achievability than the comps imply.
- What's the recent tenant-quality profile in this submarket — average credit score on applications, eviction rate, late-payment / NSF rate, and stable-employment percentage? A property-management company in the area should have these aggregated.
- How much new for-sale + rental construction is in the pipeline within 1–3 miles? Heavy new supply typically softens prices + rents 12–24 months out; constrained supply supports both.
Investment metrics
- 1% rule
- 0.69% ✗
- Cap rate
- 5.44%
- Cash-on-cash
- -3.04%
- DSCR
- 0.86
- GRM
- 12.1
CMA / ARV
- ARV (median comp)
- $373,169
- List price
- $214,900
- Delta
- -42.41%
- Verdict
- UNDERPRICED
- Comps
- 20 within 1.0 mi
Show comp detail 12 sales within ~0.75 mi
| Address | Dist | Beds/Ba | Sqft | Sold | Price | $/sf | Match |
|---|---|---|---|---|---|---|---|
| 15088 Norway St | 0.00mi | 3/2.0 | 2,291 (+1%) | 19mo | $205,000 | $89 | 82 |
| 15581 Eastwood St | 0.28mi | 3/1.5 | 2,144 (-5%) | 14mo | $275,000 | $128 | 65 |
| 15285 Oak Knoll Dr | 0.48mi | 4/2.5 (+1) | 2,200 (-3%) | 2mo | $429,900 | $195 | 64 |
| 15513 Rutherford Blvd | 0.27mi | 3/2.5 | 2,126 (-6%) | 16mo | $335,000 | $158 | 62 |
| 5206 Southpointe Pkwy | 0.34mi | 4/2.5 (+1) | 2,020 (-11%) | 2mo | $309,900 | $153 | 57 |
| 885 Patterson Dr | 0.70mi | 4/2.0 (+1) | 2,289 (+1%) | 9mo | $295,000 | $129 | 52 |
| 4893 Southpointe Pkwy | 0.46mi | 4/2.5 (+1) | 1,996 (-12%) | 1mo | $280,000 | $140 | 51 |
| 15478 Orchard Meadows Dr | 0.36mi | 4/2.5 (+1) | 2,429 (+7%) | 16mo | $489,900 | $202 | 51 |
| 4973 Orchard Crest Ct | 0.34mi | 4/2.5 (+1) | 2,588 (+14%) | 4mo | $500,000 | $193 | 50 |
| 5184 Foxhill Ln | 0.37mi | 4/2.5 (+1) | 2,064 (-9%) | 15mo | $355,000 | $172 | 48 |
| 15000 Tiara Ave | 0.41mi | 4/2.5 (+1) | 2,028 (-10%) | 10mo | $350,000 | $173 | 48 |
| 5066 Oakhaven Ln | 0.35mi | 3/3.0 | 2,000 (-12%) | 18mo | $329,000 | $165 | 45 |
Match score weights: distance 35% · size 25% · config 20% · recency 20%. Top-matched comps best support the ARV.
Projected returns pro-forma
-3.0% appreciation · 3.0% rent growth · sell at horizon
- IRR
- -21.4%
- Equity multiple
- 0.26×
- Total profit
- $-44,619
- Equity at exit
- $32,042
- IRR
- -15.2%
- Equity multiple
- 0.14×
- Total profit
- $-51,686
- Equity at exit
- $18,581
Cash invested: $60,172 (down + closing). Projections, not guarantees.
Landlord ↔ Tenant lean methodology
- Overall (STATE)
- 62 Landlord-Friendly
- State Michigan
- 62 Landlord-Friendly · EVEN
- County
- — inherits STATE
- City
- — inherits STATE
ZIP-level market 48161
- Active inventory
- 152
- Price-to-rent
- 12.1×
Monthly cashflow live
- Estimated rent
- $1,478 medium interval (Pro) →
- Mortgage (P&I)
- −$1,127
- Tax from tax record
- −$104 /mo · $1,249/yr
- Insurance
- −$90
- HOA
- −$0
- Vacancy / Maint / Mgmt
- −$310
- Net cashflow
- $-153
Break-even live
Sensitivity live
| Price | -10% $-31 | -5% $-92 | +0% $-153 | +5% $-213 | +10% $-274 |
|---|---|---|---|---|---|
| Rent | -10% $-269 | -5% $-211 | +0% $-153 | +5% $-94 | +10% $-36 |
| Rate | -1.0pp $-44 | -0.5pp $-98 | base $-153 | +0.5pp $-208 | +1.0pp $-265 |
UW: 25.0% down · 7.5% · 30yr · 1.5% tax · 5.0% vac · 8.0% maint · 8.0% mgmt
Financing live
Cash to close
- Down payment
- $53,725
- Closing costs
- $6,447
- Reserves months
- —
- Total cash needed
- —
Loan-product check · same deal, 3 products live
Conventional
25% down · 7.5% · 30yr
- Down + closing
- —
- Monthly P&I
- —
- Monthly cashflow
- —
- DSCR
- —
- Eligible?
- —
Personal DTI + credit; lowest rate.
DSCR
20% down · 8.5% · 30yr
- Down + closing
- —
- Monthly P&I
- —
- Monthly cashflow
- —
- DSCR
- —
- Eligible?
- —
No personal income docs; deal must DSCR.
Hard money
10% down · 12.0% · 12mo
- Down + closing
- —
- Monthly P&I
- —
- Monthly cashflow
- —
- DSCR
- —
- Eligible?
- —
Short-term bridge; refi at stabilization.
Listing history 42 events
-
2026-06-21statusdays on market $214,900 Active 2 DOM
-
2026-05-12historical
-
2026-05-12historical
-
2026-04-10$214,900 Active
-
2026-04-10$214,900 Active
-
2026-04-09historical
-
2024-12-03soldstatus $205,000
-
2024-11-20soldstatus $205,000 Sold
-
2024-11-20soldstatus $205,000 Closed
-
2024-10-11status Pending
-
2024-10-11status Pending
-
2024-10-08status Active
-
2024-10-08status Active
-
2024-10-01status Pending
-
2024-10-01status Pending
-
2024-09-21status Active
-
2024-09-21status Active
-
2024-08-29historical Contingent - Continue To Show
-
2024-08-29historical Keep Showing-Contgcy Appl
-
2024-08-23$199,900 Active
-
2024-08-23$199,900 Active
-
2024-08-13historical
-
2024-08-13historical
-
2024-07-27price $209,900
-
2024-07-26price $209,900
-
2024-07-20price $219,900
-
2024-07-20price $219,900
-
2024-07-20status Active
-
2024-07-20status Active
-
2024-07-13historical Contingent - Continue To Show
-
2024-07-13historical Keep Showing-Contgcy Appl
-
2024-07-04$226,900 Active
-
2024-07-04$226,900 Active
-
2018-03-09soldstatus $127,500
-
2018-03-01soldstatus $127,500
-
2018-03-01soldstatus $127,500 Closed
-
2018-01-17status Pending
-
2018-01-05status Active
-
2017-12-12status Pending
-
2017-09-29$129,900 Active
-
2017-09-29$129,900
-
2015-01-21soldstatus $63,000
ⓘ Source: listings_history table (triggers on properties + properties_extension) + one-shot
backfill from property_details.listing_events for pre-trigger history.
Tax reassessment forecast MI · Partial reset (capped growth)
- Current annual tax
- $1,249 · $104/mo
- Projected year-2 tax
- $2,279 · $190/mo
- Expected delta
- +$1,030/yr (+$86/mo · 82.5%)
ⓘ Screening estimate from a state-policy table — verify with the county assessor before closing.
Climate risk First Street
- Flood 6/10 Major FEMA zone X · 67% chance over 30 yrs
- Wildfire 1/10 Low
- Heat 3/10 Moderate 7 d/yr ≥102°F today · 15 d/yr by 30 yrs out
- Wind 2/10 Low
- Air quality 4/10 Moderate 3 unhealthy d/yr today · 6 by 30 yrs out
Nearby sold comps map
Loading sold comps map…
Walkable amenities ~0.75 mi
Loading nearby amenities…
Taxation est. · year 1
- Rental income
- $17,742
- − Mortgage interest
- −$12,038
- − Property taxes
- −$1,249
- − Insurance
- −$1,074
- − Repairs & maintenance
- −$1,419
- − Management
- −$1,419
- − Depreciation
- −$6,252
- Taxable loss
- −$5,710
- Est. tax savings @ 24.0%
- +$1,370
- After-tax cash flow
- $-460/yr
For passive investors: Depreciation is non-cash, so a rental often shows a tax loss while cash-flowing — sheltering income. Rental losses are passive: they offset passive income freely, and up to $25,000/yr can offset ordinary (W-2) income if you actively participate and your MAGI is under $100k (phasing out to $0 by $150k); unused losses carry forward. On sale, claimed depreciation is recaptured at up to 25%, and gains may owe capital-gains tax (a 1031 exchange can defer both). Figures are a year-1 estimate at your 24.0% rate — not tax advice; consult a CPA.
Schools (NCES district)
- District
- Monroe Public Schools
- NCES district ID
- 2624150
- Math proficiency
- 24% ▲ 3.00%
- Reading proficiency
- 47% ▲ 12.00%
- Median HH income
- $46,437
- Composite
- 30.33/100
- National rank
- #6269
- State rank
- #278 of 540 in MI
Livability — Monroe
- Score
- 83/100
- State rank
- #51
- US rank
- #1034
Category grades
Schools grade is shown separately in the Schools card above.
Census & demographics
- Census place
- West Monroe, MI
- County
- Monroe County · 54,460 people
- City population
- 54,460
- Metro
- Monroe, MI
- Population (ZIP)
- 26,304
- Household income
- $67,414
- Rent vs Own
- Severe rent burden
- 733.0
Population outlook (Monroe County) Hauer SSP2
- Today (2025)
- 144,439 people
- By 2030
- 140,033 · -3.1%
- By 2040
- 128,408 · -11.1%
- By 2050
- 115,024 · -20.4%
- By 2075
- 87,273 · -39.6%
- By 2100
- 63,110 · -56.3%
Race, ethnicity, and origin ACS 2023
- Neighborhood character
- Predominantly White (85%)
- Race & ethnicity
- White 85% Two or more races 7% Black 5% Hispanic / Latino 5%
- Common ancestry
- Lithuanian 10% Romanian 8% Italian 2%
- Foreign-born
- 3% · Canada, Jamaica
- Languages at home
- 96% English-only · Spanish 2% Other Indo-European 1% Arabic 1%
Political lean MEDSL · Monroe
- 2024 margin
- Strong R (+27.1) · D 35.7% · R 62.9% · Other 1.4%
- 2008→2024 swing
- -31.5pp toward R · 2008: 4.3pp · 2024: -27.1pp
- All cycles
- 2024: R+27.1 2020: R+22.6 2016: R+22.1 2012: D+1.0 2008: D+4.3
Not yet ingested
- Civics
- —
Market trends
- HPI YoY
- ▼ -178.99%
- Current HPI
- 126.2638
- Rent YoY
- —
- Metro
- Monroe, MI
- State GDP YoY
- ▲ 1.37%
- F500 in state
- 28
Industry mix (Fortune 500 HQ in MI)
| Industry | F500 HQs | Revenue |
|---|---|---|
| Automotive Parts | 3 | $48B |
|
||
| Automotive | 2 | $372B |
|
||
| Chemicals | 1 | $45B |
|
||
| Automotive Retail | 1 | $29B |
|
||
| Healthcare / Medical Devices | 1 | $23B |
|
||
| Automotive Technology | 1 | $20B |
|
||
Price history
+241.1% since first listed43 events — show timeline
- 2026-06-19 Listed $214,900 MiRealSource-MiMLS
- 2026-06-19 Listed $214,900 REALCOMP
- 2026-05-12 Listing Removed — MiRealSource-MiMLS
- 2026-05-12 Listing Removed — REALCOMP
- 2026-04-10 Listed $214,900 REALCOMP
- 2026-04-10 Listed $214,900 MiRealSource-MiMLS
- 2026-04-09 Coming Soon — MiRealSource-MiMLS
- 2024-12-03 Sold (Public Records) $205,000 Public Records
- 2024-11-20 Sold (MLS) $205,000 MiRealSource-MiMLS
- 2024-11-20 Sold (MLS) $205,000 REALCOMP
- 2024-10-11 Pending — REALCOMP
- 2024-10-11 Pending — MiRealSource-MiMLS
- 2024-10-08 Relisted — REALCOMP
- 2024-10-08 Relisted — MiRealSource-MiMLS
- 2024-10-01 Pending — REALCOMP
- 2024-10-01 Pending — MiRealSource-MiMLS
- 2024-09-21 Relisted — REALCOMP
- 2024-09-21 Relisted — MiRealSource-MiMLS
- 2024-08-29 Contingent — REALCOMP
- 2024-08-29 Contingent — MiRealSource-MiMLS
- 2024-08-23 Listed $199,900 MiRealSource-MiMLS
- 2024-08-23 Listed $199,900 REALCOMP
- 2024-08-13 Listing Removed — MiRealSource-MiMLS
- 2024-08-13 Listing Removed — REALCOMP
- 2024-07-27 Price Changed $209,900 MiRealSource-MiMLS
- 2024-07-26 Price Changed $209,900 REALCOMP
- 2024-07-20 Price Changed $219,900 MiRealSource-MiMLS
- 2024-07-20 Price Changed $219,900 REALCOMP
- 2024-07-20 Relisted — REALCOMP
- 2024-07-20 Relisted — MiRealSource-MiMLS
- 2024-07-13 Contingent — REALCOMP
- 2024-07-13 Contingent — MiRealSource-MiMLS
- 2024-07-04 Listed $226,900 MiRealSource-MiMLS
- 2024-07-04 Listed $226,900 REALCOMP
- 2018-03-09 Sold (Public Records) $127,500 Public Records
- 2018-03-01 Sold (MLS) $127,500 MiRealSource-MiMLS
- 2018-03-01 Sold (MLS) $127,500 REALCOMP
- 2018-01-17 Pending — MiRealSource-MiMLS
- 2018-01-05 Relisted — MiRealSource-MiMLS
- 2017-12-12 Pending — MiRealSource-MiMLS
- 2017-09-29 Listed $129,900 MiRealSource-MiMLS
- 2017-09-29 Listed $129,900 REALCOMP
- 2015-01-21 Sold (Public Records) $63,000 Public Records
Property tax history
+0.3%/yrLatest (2025): $1,249 · -52.9% YoY. Source: county tax records.
Cash-flow waterfall
monthlySold comps — $/sqft
last 12 mo · ≤1 miLoading sold comps…