18 Larkin St · Sumter, SC
Flood risk 1/10 · Minimal
- FEMA flood zone
- X (unshaded)
- Chance of flooding over 30 yrs
- 0.0%
- Est. flood insurance / yr
- $507 – $1,088
Fire risk 2/10 · Minimal
- Est. fire insurance / yr
- $783 – $1,453
Heat risk 7/10 · Major
- Hot days now (above 108°F)
- 7 days/yr
- Hot days in 30 yrs
- 16 days/yr
Wind risk 8/10 · Major
- Chance of severe wind over 30 yrs
- 80.0%
Air-quality risk 2/10 · Minimal
- Unhealthy air days now
- 2 days/yr
- Unhealthy air days in 30 yrs
- 2 days/yr
Risk factors via First Street. Map © Google.
Why this score? — see what drove the C- grade
The composite is a weighted blend of 9 inputs, each scored 0–100. Each bar is that input's sub-score; the figure is the points it added to the 100-point composite (weight × sub-score).
- Cash flow +23.0/30.0
- ARV discount +7.5/15.0
- DSCR +7.4/10.0
- 1% rule +4.7/10.0
- Rent growth +3.1/5.0
- Livability +3.0/5.0
- Condition / age +2.5/5.0
- Schools +1.9/10.0
- Appreciation +0.0/10.0
$124,500
🖨 Deal sheet 📄 Offer letter ✓ Due diligence
Listing remarks
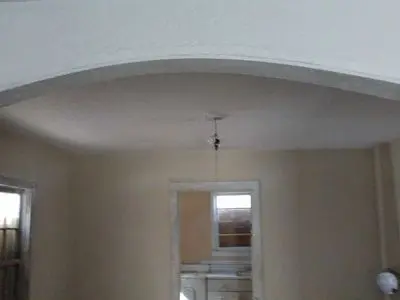
* Don& apos; t miss out on this one of a kind opportunity!! * BRAND NEW ROOF * Minor cosmetic repair needed for the interior. * Some exterior renovations on this property will be needed. * Quiet neighborhood near great restaurants! * This is a great deal as it is priced well below market value and will be a great flip. * Call or email today before this one is gone
Key facts
- Brand new roof
- Built 1950
- Listed 37 days
Tags
Neighborhood map
What this means for you Summary
Snapshot
- This is a 2-bed/1.0-bath single-family listed at $124k.
Deal economics
- At list price, monthly cash flow is $220 ($3k/yr) — positive.
- The deal already cash-flows at list — no discount required.
- To meet the 1% rule (rent ≥ 1% of price), the offer needs to be $120k (3.2% below list).
- Recommended offer: $120k (3.2% below list) — sets the bar for 1% rule.
- Cap rate 8.4% vs local median 3.4% in Sumter — top-decile yield for the area; either an underpriced asset or a hidden risk that comps aren't pricing in. Stress-test before assuming the spread holds.
Location & tenants
- Location reads 59/100 on livability (#235 in SC) — a working-class tenant base; expect higher turnover. Strengths: cost of living A+, health & safety A+, housing A-; Watch: schools D-, crime F, amenities F.
- Sumter 01 (urban): math 18% / reading 28% proficiency, ranked #64 of 80 in SC (top 80%) — low school quality limits family demand, transient renter base, plan for 1-2y turnover; 64% free/reduced lunch — lower-income household profile, screen leases tightly.
- Market conditions: Rents rising (+2.5%/yr); 376 active listings in the ZIP; 386 units permitted in Sumter County in 2024 (0 in 5+ unit buildings).
Forward outlook
- Local home prices are declining (-3.0%/yr); year-one equity from $861 of loan paydown is wiped out by about $4k of value loss. Plan a longer hold.
- Sumter County population projected at -14% by 2050 — secular population decline; favor cash flow + early exit over multi-decade hold.
Negotiation context
- It's been on market 38 days — a 3% lower offer ($121k) is reasonable based on typical stale-listing flexibility.
- 5 sale attempts since 4y ago; this cycle's ask is 32% above the opening price — seller raised mid-cycle; expect resistance to lowballs.
Risks & watch-outs
- Watch-outs: built in 1950 — expect roof / HVAC / electrical / plumbing capex.
- Climate carrying-cost: severe wind risk, 80% chance of damaging wind over 30y; extreme-heat days projected 7→16/yr by 2055 (HVAC capex compounding) — expect insurance premiums to compound above CPI over the hold.
Questions for the listing agent
- It's been on market 38 days. Have you received any prior offers? Is the seller open to a 3% concession, seller financing, or rate buy-down credit?
- Built in 1950 — when were the roof, HVAC, electrical panel, plumbing, and water heater last replaced?
- Is there a deadline driving the sale (1031 exchange, divorce, estate, relocation)? That informs how much negotiation room exists.
- Schools are D-rated, which usually means shorter tenancies and higher turnover. Who's the typical renter profile here, and what's been the actual vacancy rate?
- Crime grade is F in this area — have there been break-ins, vandalism, or insurance claims at this property in the last 3 years? What carrier currently insures it and at what premium?
- What's the average days-on-market for RENTAL listings here right now (not sales)? A rising rental-DOM trend means longer vacancies and softer asking-rent achievability than the comps imply.
- What's the recent tenant-quality profile in this submarket — average credit score on applications, eviction rate, late-payment / NSF rate, and stable-employment percentage? A property-management company in the area should have these aggregated.
- How much new for-sale + rental construction is in the pipeline within 1–3 miles? Heavy new supply typically softens prices + rents 12–24 months out; constrained supply supports both.
Investment metrics
- 1% rule
- 0.97% ✗
- Cap rate
- 8.41%
- Cash-on-cash
- 7.58%
- DSCR
- 1.34
- GRM
- 8.6
CMA / ARV
- ARV (on-the-fly)
- $45,253
- Comps found
- 4
Show comp detail 4 sales within ~0.75 mi
| Address | Dist | Beds/Ba | Sqft | Sold | Price | $/sf | Match |
|---|---|---|---|---|---|---|---|
| 841 Hager St | 0.13mi | 2/1.0 | 692 (-10%) | 19mo | $69,500 | $100 | 62 |
| 127 Highland Ave | 0.67mi | 2/1.0 | 819 (+7%) | 7mo | $38,000 | $46 | 52 |
| 21 Sims St | 0.73mi | 2/1.0 | 828 (+8%) | 18mo | $32,000 | $39 | 38 |
| 251 Rast St Unit B7 | 0.60mi | 2/2.0 | 850 (+11%) | 21mo | $50,000 | $59 | 32 |
Match score weights: distance 35% · size 25% · config 20% · recency 20%. Top-matched comps best support the ARV.
Projected returns pro-forma
-3.0% appreciation · 2.55% rent growth · sell at horizon
- IRR
- -5.2%
- Equity multiple
- 0.81×
- Total profit
- $-6,763
- Equity at exit
- $18,563
- IRR
- 3.9%
- Equity multiple
- 1.28×
- Total profit
- $9,703
- Equity at exit
- $10,764
Cash invested: $34,860 (down + closing). Projections, not guarantees.
Landlord ↔ Tenant lean methodology
- Overall (STATE)
- 90 Strongly Landlord-Friendly
- State South Carolina
- 90 Strongly Landlord-Friendly · R+6
- County
- — inherits STATE
- City
- — inherits STATE
ZIP-level market 29150
- Rents YoY
- 2.5%
- Active inventory
- 376
- Price-to-rent
- 8.6×
Monthly cashflow live
- Estimated rent
- $1,205 medium interval (Pro) →
- Mortgage (P&I)
- −$653
- Tax from tax record
- −$27 /mo · $325/yr
- Insurance
- −$52
- HOA
- −$0
- Vacancy / Maint / Mgmt
- −$253
- Net cashflow
- $220
Break-even live
UW: 25.0% down · 7.5% · 30yr · 1.5% tax · 5.0% vac · 8.0% maint · 8.0% mgmt
Financing live
Cash to close
- Down payment
- $31,125
- Closing costs
- $3,735
- Reserves months
- —
- Total cash needed
- —
Loan-product check · same deal, 3 products live
Conventional
25% down · 7.5% · 30yr
- Down + closing
- —
- Monthly P&I
- —
- Monthly cashflow
- —
- DSCR
- —
- Eligible?
- —
Personal DTI + credit; lowest rate.
DSCR
20% down · 8.5% · 30yr
- Down + closing
- —
- Monthly P&I
- —
- Monthly cashflow
- —
- DSCR
- —
- Eligible?
- —
No personal income docs; deal must DSCR.
Hard money
10% down · 12.0% · 12mo
- Down + closing
- —
- Monthly P&I
- —
- Monthly cashflow
- —
- DSCR
- —
- Eligible?
- —
Short-term bridge; refi at stabilization.
Listing history 35 events
-
2026-06-19days on market $124,500 Active 38 DOM
-
2026-06-18days on market $124,500 Active 37 DOM
-
2026-06-17days on market $124,500 Active 36 DOM
-
2026-06-16days on market $124,500 Active 35 DOM
-
2026-06-15days on market $124,500 Active 34 DOM
-
2026-06-14days on market $124,500 Active 32 DOM
-
2026-06-13days on market $124,500 Active 31 DOM
-
2026-06-10days on market $124,500 Active 29 DOM
-
2026-06-09days on market $124,500 Active 28 DOM
-
2026-06-08days on market $124,500 Active 27 DOM
-
2026-06-07days on market $124,500 Active 26 DOM
-
2026-06-02days on market $124,500 Active 21 DOM
-
2026-06-01days on market $124,500 Active 20 DOM
-
2026-05-31days on market $124,500 Active 19 DOM
-
2026-05-30days on market $124,500 Active 18 DOM
-
2026-05-13price $124,500
-
2026-05-12$94,500 Active
-
2022-09-14historical
-
2022-09-03$39,900 Active
-
2022-06-28historical
-
2022-06-19price $46,200
-
2022-06-01price $46,700
-
2022-05-31status Active
-
2022-05-30historical
-
2022-05-25price $46,900
-
2022-05-24price $47,000
-
2022-05-03price $47,200
-
2022-04-29price $47,300
-
2022-04-20price $47,500
-
2022-04-18price $48,400
-
2022-04-04price $48,500
-
2022-03-14price $50,000
-
2022-03-13status Active
-
2022-03-07historical
-
2022-01-28$55,000 Active
ⓘ Source: listings_history table (triggers on properties + properties_extension) + one-shot
backfill from property_details.listing_events for pre-trigger history.
Tax reassessment forecast SC · Resets to sale price
- Current annual tax
- $325 · $27/mo
- Projected year-2 tax
- $710 · $59/mo
- Expected delta
- +$385/yr (+$32/mo · 118.6%)
ⓘ Screening estimate from a state-policy table — verify with the county assessor before closing.
Climate risk First Street
- Flood 1/10 Low FEMA zone X (unshaded) · 0% chance over 30 yrs
- Wildfire 2/10 Low
- Heat 7/10 Severe 7 d/yr ≥108°F today · 16 d/yr by 30 yrs out
- Wind 8/10 Severe 80% chance of damaging wind over 30 yrs
- Air quality 2/10 Low 2 unhealthy d/yr today · 2 by 30 yrs out
Nearby sold comps map
Loading sold comps map…
Walkable amenities ~0.75 mi
Loading nearby amenities…
Taxation est. · year 1
- Rental income
- $14,459
- − Mortgage interest
- −$6,974
- − Property taxes
- −$325
- − Insurance
- −$622
- − Repairs & maintenance
- −$1,157
- − Management
- −$1,157
- − Depreciation
- −$3,622
- Taxable income
- $603
- Est. tax owed @ 24.0%
- −$145
- After-tax cash flow
- $2,496/yr
For passive investors: Depreciation is non-cash, so a rental often shows a tax loss while cash-flowing — sheltering income. Rental losses are passive: they offset passive income freely, and up to $25,000/yr can offset ordinary (W-2) income if you actively participate and your MAGI is under $100k (phasing out to $0 by $150k); unused losses carry forward. On sale, claimed depreciation is recaptured at up to 25%, and gains may owe capital-gains tax (a 1031 exchange can defer both). Figures are a year-1 estimate at your 24.0% rate — not tax advice; consult a CPA.
Schools (NCES district)
- District
- Sumter 01
- NCES district ID
- 4503902
- Math proficiency
- 18% ▼ -13.00%
- Reading proficiency
- 28% ▼ -6.00%
- Median HH income
- $40,423
- Composite
- 19.45/100
- National rank
- #8775
- State rank
- #64 of 80 in SC
Livability — Sumter
- Score
- 59/100
- State rank
- #235
- US rank
- #19754
Category grades
Schools grade is shown separately in the Schools card above.
Census & demographics
- Census place
- Sumter, SC
- County
- Sumter County · 76,912 people
- City population
- 67,992
- Metro
- Sumter, SC
- Population (ZIP)
- 38,538
- Household income
- $50,965
- Rent vs Own
- Severe rent burden
- 1136.0
Population outlook (Sumter County) Hauer SSP2
- Today (2025)
- 104,585 people
- By 2030
- 102,282 · -2.2%
- By 2040
- 96,258 · -8.0%
- By 2050
- 89,592 · -14.3%
- By 2075
- 74,715 · -28.6%
- By 2100
- 60,235 · -42.4%
Race, ethnicity, and origin ACS 2023
- Neighborhood character
- Diverse neighborhood (Simpson 0.60)
- Race & ethnicity
- Black 50% White 39% Hispanic / Latino 5% Two or more races 4% Asian 2%
- Hispanic origin (detail)
- Mexican 3% Puerto Rican 1%
- Common ancestry
- Slovak 2% Lithuanian 1% Italian 1%
- Foreign-born
- 4% · Canada, China, Vietnam
- Languages at home
- 93% English-only · Spanish 4% Other Indo-European 1% German/W. Germanic 1%
Political lean MEDSL · Sumter
- 2024 margin
- Toss-up / Even · D 51.9% · R 47.0% · Other 1.2%
- 2008→2024 swing
- -10.6pp toward R · 2008: 15.4pp · 2024: 4.9pp
- All cycles
- 2024: D+4.9 2020: D+13.0 2016: D+12.0 2012: D+17.5 2008: D+15.4
Not yet ingested
- Civics
- —
Market trends
- HPI YoY
- ▼ -100.16%
- Current HPI
- 129.032
- Rent YoY
- ▲ 2.55%
- Metro
- Sumter, SC
- State GDP YoY
- ▲ 4.51%
- F500 in state
- 2
Industry mix (Fortune 500 HQ in SC)
| Industry | F500 HQs | Revenue |
|---|---|---|
| Packaging | 1 | $7B |
|
||
Price history
+126.4% since first listed20 events — show timeline
- 2026-05-13 Price Changed $124,500 FSBO.com
- 2026-05-12 Listed $94,500 FSBO.com
- 2022-09-14 Delisted — Consolidated MLS
- 2022-09-03 Listed $39,900 Consolidated MLS
- 2022-06-28 Delisted — Consolidated MLS
- 2022-06-19 Price Changed $46,200 Consolidated MLS
- 2022-06-01 Price Changed $46,700 Consolidated MLS
- 2022-05-31 Relisted — Consolidated MLS
- 2022-05-30 Delisted — Consolidated MLS
- 2022-05-25 Price Changed $46,900 Consolidated MLS
- 2022-05-24 Price Changed $47,000 Consolidated MLS
- 2022-05-03 Price Changed $47,200 Consolidated MLS
- 2022-04-29 Price Changed $47,300 Consolidated MLS
- 2022-04-20 Price Changed $47,500 Consolidated MLS
- 2022-04-18 Price Changed $48,400 Consolidated MLS
- 2022-04-04 Price Changed $48,500 Consolidated MLS
- 2022-03-14 Price Changed $50,000 Consolidated MLS
- 2022-03-13 Relisted — Consolidated MLS
- 2022-03-07 Delisted — Consolidated MLS
- 2022-01-28 Listed $55,000 Consolidated MLS
Property tax history
-3.7%/yrLatest (2025): $325 · +1.9% YoY. Source: county tax records.
Cash-flow waterfall
monthlySold comps — $/sqft
last 12 mo · ≤1 miLoading sold comps…