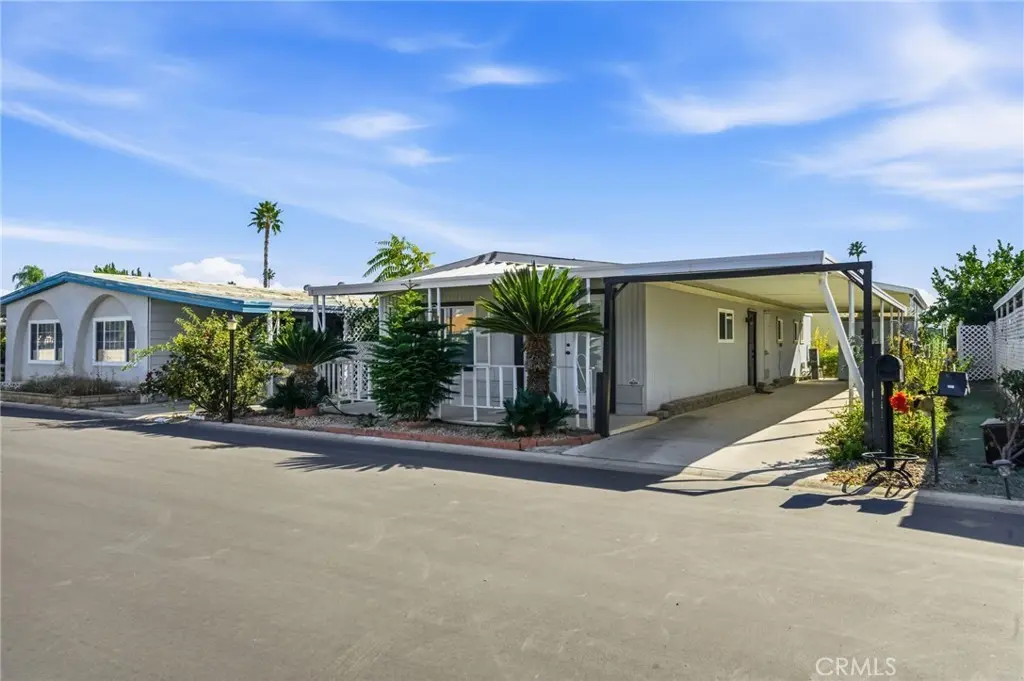
601 N Kirby #294 · Hemet, CA
Flood risk 1/10 · Minimal
- FEMA flood zone
- X (unshaded)
- Chance of flooding over 30 yrs
- 0.0%
- Est. flood insurance / yr
- $507 – $1,088
Fire risk 6/10 · Moderate
- Est. fire insurance / yr
- $659 – $1,223
Heat risk 7/10 · Major
- Hot days now (above 104°F)
- 5 days/yr
- Hot days in 30 yrs
- 14 days/yr
Wind risk 1/10 · Minimal
- Chance of severe wind over 30 yrs
- —
Air-quality risk 6/10 · Moderate
- Unhealthy air days now
- 12 days/yr
- Unhealthy air days in 30 yrs
- 14 days/yr
Risk factors via First Street. Map © Google.
Why this score? — see what drove the C+ grade
The composite is a weighted blend of 9 inputs, each scored 0–100. Each bar is that input's sub-score; the figure is the points it added to the 100-point composite (weight × sub-score).
- Cash flow +30.0/30.0
- 1% rule +10.0/10.0
- DSCR +10.0/10.0
- Rent growth +3.4/5.0
- Livability +2.6/5.0
- Schools +2.5/10.0
- Condition / age +2.5/5.0
- ARV discount +1.2/15.0
- Appreciation +0.0/10.0
$49,000
🖨 Deal sheet 📄 Offer letter ✓ Due diligence
Listing remarks
* * Seller financing available * * Stylishly Updated Home in the Desirable 55+ Colonial Country Club! Step inside this beautifully refreshed 2 bedroom, 2 bathroom home offering over 1,000 sq. ft. of comfortable, modern living. A wide French front door with integrated mini-blinds welcomes you into the open living and dining area, creating an inviting flow perfect for relaxing or entertaining. Thoughtful upgrades are found throughout, including brand-new waterproof vinyl plank flooring, upgraded light fixtures, four modern ceiling fans, and newly installed bathroom vanities that enhance the home’s clean and contemporary feel. Dual pane windows brighten the interior while improving
Key facts
- Covered carport
- Updated home
- Dual pane windows
Tags
Property features AI
Finance
- Other: Pets allowed
- Financial info: Land lease: $1,129 monthly (seller source)
- HOA & community: Senior community; Association amenities include pool, spa, gym/exercise room, pickleball, golf; pets permitted; Community features include golf course; Park name: Colonial Country; Manager approval required for residency; Land lease (monthly)
Exterior
- Parking: Covered carport (attached); Driveway with concrete surface; 2 parking spaces (including 2 carport spaces)
- Security: Carbon monoxide detector(s); Smoke detector(s)
- Utilities: District/public water; Public sewer; Natural gas connected; Electricity connected
- Home design: Mobile home remains (20' x 50'); Updated/remodeled condition; North-facing; Single-story
- Construction: Metal roof; One story
- Exterior features: Covered patio/porch; Awning; Shed (1)
Interior
- Kitchen: Gas range and gas oven; Dishwasher; Central water heater
- Bedrooms: Primary bedroom (all bedrooms on main level)
- Flooring: Carpet; Laminate
- Bathrooms: 2 full bathrooms
- Heating & cooling: Central heating (furnace); Central cooling
- Interior features: Ceiling fan; Double-pane windows; No interior steps; Carbon monoxide and smoke detectors; One-level floor plan; Entry at level 1
- Laundry & utility: Washer included; Dryer included; Laundry area in kitchen
Neighborhood map
What this means for you Summary
Snapshot
- This is a 2-bed/2.0-bath manufactured listed at $49k.
Deal economics
- At list price, monthly cash flow is $1k ($15k/yr) — positive.
- The deal already cash-flows at list — no discount required.
- Meets the 1% rule at list price ($2k rent vs $49k).
- Recommended offer: $43k (12.0% below list) — sets the bar for market timing.
- Cap rate 36.1% vs local median 4.9% in Hemet — top-decile yield for the area; either an underpriced asset or a hidden risk that comps aren't pricing in. Stress-test before assuming the spread holds.
Location & tenants
- Location reads 51/100 on livability (#1,056 in CA) — a working-class tenant base; expect higher turnover. Strengths: housing A+; Watch: crime D+, amenities F, commute F.
- Hemet Unified (suburban): math 19% / reading 41% proficiency, ranked #360 of 517 in CA (top 70%) — families likely to look elsewhere, expect single-tenant / working-renter base with shorter leases; 66% free/reduced lunch — lower-income household profile, screen leases tightly.
- Zoned schools: Tahquitz High (math 14% / reading 42%, grade F, #777 of 1,170 statewide, top 67%, 1,727 students, 88% FRL) — zoned schools average 88% FRL vs 66% district-wide (22 pts higher); higher-poverty schools than district average — tighter screening recommended.
- Market conditions: Rents rising (+3.7%/yr); 290 active listings in the ZIP; 40 comparable units currently listed for rent nearby; rentals at typical pace (median 24d on market — plan ~3-4 weeks tenant-placement turnaround); 9,195 units permitted in Riverside County in 2024 (1,512 in 5+ unit buildings).
- This rent runs 36% of the median local income ($64k/yr) — at the standard rent-burdened threshold; future hikes will face affordability resistance.
Forward outlook
- Local home prices are declining (-3.0%/yr); year-one equity from $339 of loan paydown is wiped out by about $1k of value loss. Plan a longer hold.
- Riverside County population projected at +22% by 2050 — long-run rental-demand tailwind backs the buy-and-hold thesis.
- At projected returns (-3.0% appreciation + 3.7% rent growth), your $14k cash investment doubles in ~2 years — after that, you're playing with house money.
Negotiation context
- It's been on market 205 days — a 12% lower offer ($43k) is reasonable based on typical stale-listing flexibility.
- 14 sale attempts since 16y ago; this cycle's ask has dropped $6k (11%) from the opening price — seller is motivated, your offer sets the floor, not the list.
- Current owner paid $28k; list at $49k implies a 75% gain — meaningful room to come down on a strong offer.
Risks & watch-outs
- Climate carrying-cost: major wildfire risk; extreme-heat days projected 5→14/yr by 2055 (HVAC capex compounding) — expect insurance premiums to compound above CPI over the hold.
Questions for the listing agent
- It's been on market 205 days. Have you received any prior offers? Is the seller open to a 12% concession, seller financing, or rate buy-down credit?
- Why hasn't it sold? Are there any deal-killer items the seller is aware of (foundation, flood, title, zoning, code violations)?
- Is there a deadline driving the sale (1031 exchange, divorce, estate, relocation)? That informs how much negotiation room exists.
- Schools are F-rated, which usually means shorter tenancies and higher turnover. Who's the typical renter profile here, and what's been the actual vacancy rate?
- Crime grade is D in this area — have there been break-ins, vandalism, or insurance claims at this property in the last 3 years? What carrier currently insures it and at what premium?
- What's the average days-on-market for RENTAL listings here right now (not sales)? A rising rental-DOM trend means longer vacancies and softer asking-rent achievability than the comps imply.
- What's the recent tenant-quality profile in this submarket — average credit score on applications, eviction rate, late-payment / NSF rate, and stable-employment percentage? A property-management company in the area should have these aggregated.
- How much new for-sale + rental construction is in the pipeline within 1–3 miles? Heavy new supply typically softens prices + rents 12–24 months out; constrained supply supports both.
Investment metrics
- 1% rule
- 3.91% ✓
- Cap rate
- 36.11%
- Cash-on-cash
- 106.50%
- DSCR
- 5.74
- GRM
- 2.1
CMA / ARV
- ARV (on-the-fly)
- $43,000
- Comps found
- 7
Show comp detail 7 sales within ~0.75 mi
| Address | Dist | Beds/Ba | Sqft | Sold | Price | $/sf | Match |
|---|---|---|---|---|---|---|---|
| 601 N Kirby St #287 | 0.13mi | 2/2.0 | 1,056 (+6%) | 6mo | $49,500 | $47 | 80 |
| 601 N Kirby St #42 | 0.00mi | 2/2.0 | 1,080 (+8%) | 10mo | $54,900 | $51 | 78 |
| 601 N Kirby St #17 | 0.10mi | 2/2.0 | 960 (-4%) | 13mo | $70,000 | $73 | 78 |
| 601 N Kirby St #154 | 0.02mi | 2/2.0 | 960 (-4%) | 22mo | $40,000 | $42 | 74 |
| 332 N Lyon #57 | 0.74mi | 2/2.0 | 1,040 (+4%) | 1mo | $35,000 | $34 | 58 |
| 1895 W Devonshire Ave #27 | 0.75mi | 2/2.0 | 1,040 (+4%) | 3mo | $45,000 | $43 | 56 |
| 1895 W Devonshire Ave #98 | 0.75mi | 2/2.0 | 960 (-4%) | 22mo | $33,000 | $34 | 40 |
Match score weights: distance 35% · size 25% · config 20% · recency 20%. Top-matched comps best support the ARV.
Projected returns pro-forma
-3.0% appreciation · 3.74% rent growth · sell at horizon
- IRR
- —
- Equity multiple
- 6.18×
- Total profit
- $71,051
- Equity at exit
- $7,306
- IRR
- —
- Equity multiple
- 13.23×
- Total profit
- $167,728
- Equity at exit
- $4,237
Cash invested: $13,720 (down + closing). Projections, not guarantees.
Landlord ↔ Tenant lean methodology
- Overall (STATE)
- 18 Strongly Tenant-Friendly
- State California
- 18 Strongly Tenant-Friendly · D+13
- County
- — inherits STATE
- City
- — inherits STATE
ZIP-level market 92545
- Home prices YoY
- -24.6%
- Rents YoY
- 3.7%
- Active inventory
- 290
- Price-to-rent
- 2.1×
Monthly cashflow live
- Estimated rent
- $1,916 high interval (Pro) →
- Mortgage (P&I)
- −$257
- Tax from tax record
- −$19 /mo · $226/yr
- Insurance
- −$20
- HOA
- −$0
- Vacancy / Maint / Mgmt
- −$402
- Net cashflow
- $1,218
Break-even live
UW: 25.0% down · 7.5% · 30yr · 1.5% tax · 5.0% vac · 8.0% maint · 8.0% mgmt
Financing live
Cash to close
- Down payment
- $12,250
- Closing costs
- $1,470
- Reserves months
- —
- Total cash needed
- —
Loan-product check · same deal, 3 products live
Conventional
25% down · 7.5% · 30yr
- Down + closing
- —
- Monthly P&I
- —
- Monthly cashflow
- —
- DSCR
- —
- Eligible?
- —
Personal DTI + credit; lowest rate.
DSCR
20% down · 8.5% · 30yr
- Down + closing
- —
- Monthly P&I
- —
- Monthly cashflow
- —
- DSCR
- —
- Eligible?
- —
No personal income docs; deal must DSCR.
Hard money
10% down · 12.0% · 12mo
- Down + closing
- —
- Monthly P&I
- —
- Monthly cashflow
- —
- DSCR
- —
- Eligible?
- —
Short-term bridge; refi at stabilization.
Rent comps 40 comps
| Address | Beds | Baths | Sqft | Rent | $/sqft | DOM | Units | Dist |
|---|---|---|---|---|---|---|---|---|
| 2770 W Devonshire Ave Hemet, CA | 1.0–2.0 | 1.0–2.0 | 707 | $1,945 | $2.75 | 1d | 11 | 0.25mi |
| 743 Via Linda Dr Hemet, CA | 2.0 | 2.0 | 1206 | $1,995 | $1.65 | 5d | 1 | 0.28mi |
| 2422 San Padre Ct Hemet, CA | 2.0 | 1.0 | 827 | $1,800 | $2.18 | 24d | 1 | 0.30mi |
| 811 Alondra Dr Hemet, CA | 2.0 | 2.0 | 1166 | $1,875 | $1.61 | 4d | 1 | 0.31mi |
| 2488 San Padre Ct Hemet, CA | 2.0 | 1.0 | 827 | $1,599 | $1.93 | 13d | 1 | 0.31mi |
| 853 Ensenada Dr Hemet, CA | 2.0 | 2.0 | 1350 | $1,875 | $1.39 | 11d | 1 | 0.36mi |
| 853 Ensenada Dr Hemet, CA | 2.0 | 2.0 | 1350 | $1,875 | $1.39 | 24d | 1 | 0.36mi |
| 3471 Dublin Ct Hemet, CA | 3.0 | 2.0 | 1276 | $2,895 | $2.27 | 3d | 1 | 0.37mi |
| 2269 San Bernardo Ave Hemet, CA | 2.0 | 1.0 | 827 | $1,650 | $2.00 | 43d | 1 | 0.40mi |
| 528 San Marino St Hemet, CA | 2.0 | 1.0 | 827 | $1,900 | $2.30 | 43d | 1 | 0.43mi |
| 682 San Marino St Hemet, CA | 2.0 | 1.0 | 827 | $1,600 | $1.93 | 43d | 1 | 0.45mi |
| 2120 San Bernardo Ave Hemet, CA | 2.0 | 1.0 | 827 | $2,100 | $2.54 | 43d | 1 | 0.50mi |
| 2054 Avenida Olivos Hemet, CA | 2.0 | 1.0 | 820 | $1,500 | $1.83 | 43d | 1 | 0.55mi |
| 341 Calle Nogales Hemet, CA | 2.0 | 1.0 | 827 | $1,395 | $1.69 | 43d | 1 | 0.58mi |
| 1964 W Oakland Ave Hemet, CA | 2.0 | 2.0 | 977 | $1,695 | $1.73 | 17d | 1 | 0.59mi |
| 1933 Nuevo St Hemet, CA | 2.0 | 1.0 | 827 | $1,700 | $2.06 | 24d | 1 | 0.61mi |
| 1931 Nuevo St Hemet, CA | 2.0 | 1.0 | 820 | $1,600 | $1.95 | 43d | 1 | 0.62mi |
| 2014 Iris Way Hemet, CA | 3.0 | 2.0 | 1192 | $2,850 | $2.39 | 43d | 1 | 0.64mi |
| 3800 W Devonshire Ave Hemet, CA | 3.0 | 1.0–2.0 | 816 | $2,055 | $2.52 | 1d | 8 | 0.64mi |
| 1862 Pueblo Dr Unit 1862 Hemet, CA | 2.0 | 2.0 | 977 | $1,750 | $1.79 | 24d | 1 | 0.64mi |
| 1862 Pueblo Dr Hemet, CA | 2.0 | 2.0 | 977 | $1,900 | $1.94 | 43d | 1 | 0.64mi |
| 627 Solano Dr Hemet, CA | 2.0 | 2.0 | 882 | $1,800 | $2.04 | 18d | 1 | 0.64mi |
| 2208 El Grande St Hemet, CA | 2.0 | 2.0 | 1327 | $2,100 | $1.58 | 17d | 1 | 0.67mi |
| 1887 Calle Amargosa Hemet, CA | 2.0 | 1.0 | 827 | $1,545 | $1.87 | 24d | 1 | 0.69mi |
| 1700 Walden Ln Hemet, CA | 3.0 | 2.0 | 1430 | $2,670 | $1.87 | 24d | 1 | 0.77mi |
| 3030 W Acacia Ave Hemet, CA | 1.0–3.0 | 1.0–2.0 | 892 | $1,895 | $2.12 | 1d | 10 | 0.79mi |
| 1245 Millie Dr Hemet, CA | 3.0 | 2.0 | 1392 | $2,850 | $2.05 | 7d | 1 | 0.83mi |
| 2469 W Acacia Ave Hemet, CA | 2.0 | 2.0 | 910 | $1,750 | $1.92 | 24d | 1 | 0.91mi |
| 2403 W Acacia Ave Hemet, CA | 2.0 | 2.0 | 910 | $1,995 | $2.19 | 7d | 1 | 0.92mi |
| 663 Mariposa Dr Hemet, CA | 2.0 | 2.0 | 1440 | $1,500 | $1.04 | 24d | 1 | 0.96mi |
| 2098 W Acacia Ave Hemet, CA | 1.0–3.0 | 1.0–2.0 | 895 | $2,035 | $2.27 | 1d | 1 | 0.96mi |
| 446 N Elk St Unit D Hemet, CA | 2.0 | 1.0 | 980 | $1,675 | $1.71 | 24d | 1 | 1.01mi |
| 1270 Rosalia Ave Unit 1 Hemet, CA | 2.0 | 1.0 | 900 | $1,800 | $2.00 | 43d | 1 | 1.03mi |
| 250 N Elk St Hemet, CA | 2.0 | 1.0 | 900 | $1,625 | $1.81 | 13d | 1 | 1.08mi |
| 1315 W Latham Ave Hemet, CA | 3.0 | 2.5 | 1340 | $2,550 | $1.90 | 43d | 1 | 1.11mi |
| 4400 W Florida Ave Unit 86 Hemet, CA | 3.0 | 2.0 | 1310 | $1,800 | $1.37 | 43d | 1 | 1.15mi |
| 4400 W Florida Ave Spc 26 Hemet, CA | 3.0 | 2.0 | 1193 | $1,699 | $1.42 | 14d | 1 | 1.18mi |
| 165 N Hamilton Ave Unit 3 Hemet, CA | 1.0 | 1.0 | 768 | $1,450 | $1.89 | 5d | 1 | 1.20mi |
| 165 N Hamilton Ave Unit 4 Hemet, CA | 1.0 | 1.0 | 768 | $1,525 | $1.99 | 21d | 1 | 1.20mi |
| 1850 Amberwood Dr Hemet, CA | 2.0 | 2.0 | 1170 | $1,561 | $1.33 | 43d | 1 | 1.29mi |
Listing history 46 events
-
2026-06-18days on market $49,000 Active 205 DOM
-
2026-06-17days on market $49,000 Active 204 DOM
-
2026-06-16days on market $49,000 Active 203 DOM
-
2026-06-15days on market $49,000 Active 202 DOM
-
2026-06-13days on market $49,000 Active 200 DOM
-
2026-06-09days on market $49,000 Active 196 DOM
-
2026-06-08days on market $49,000 Active 195 DOM
-
2026-06-07days on market $49,000 Active 194 DOM
-
2026-06-04days on market $49,000 Active 191 DOM
-
2026-06-03days on market $49,000 Active 190 DOM
-
2026-06-02days on market $49,000 Active 189 DOM
-
2026-06-01days on market $49,000 Active 188 DOM
-
2026-05-31days on market $49,000 Active 187 DOM
-
2026-05-19price $49,000
-
2026-05-18status Active
-
2026-05-01status Pending Sale
-
2026-02-26price $44,000
-
2026-02-10status Active
-
2025-11-07$55,000 Active
-
2025-10-25historical
-
2025-08-22$72,000 Active
-
2025-08-22historical
-
2025-08-09$72,000 Active
-
2025-02-06historical
-
2024-12-20price $70,000
-
2024-11-05price $65,000
-
2024-10-16$72,500 Active
-
2024-09-13historical
-
2024-09-05status Active
-
2024-08-22historical Active Under Contract
-
2024-06-20price $73,000
-
2024-06-14status Active
-
2024-05-03$82,500 Active
-
2024-05-03historical
-
2024-04-12$90,000 Active
-
2024-04-11historical
-
2021-07-30soldstatus $28,000 Closed Sale
-
2021-07-03status Pending Sale
-
2021-06-22$19,900 Active
-
2011-08-15historical
-
2011-08-15status Active
-
2011-08-09historical Hold
-
2011-06-13price $10,000
-
2011-03-30$12,500 Active
-
2011-01-24historical
-
2010-07-25$17,900 Active
ⓘ Source: listings_history table (triggers on properties + properties_extension) + one-shot
backfill from property_details.listing_events for pre-trigger history.
Tax reassessment forecast CA · Resets to sale price
- Current annual tax
- $226 · $19/mo
- Projected year-2 tax
- $372 · $31/mo
- Expected delta
- +$146/yr (+$12/mo · 64.5%)
ⓘ Screening estimate from a state-policy table — verify with the county assessor before closing.
Climate risk First Street
- Flood 1/10 Low FEMA zone X (unshaded) · 0% chance over 30 yrs
- Wildfire 6/10 Major
- Heat 7/10 Severe 5 d/yr ≥104°F today · 14 d/yr by 30 yrs out
- Wind 1/10 Low
- Air quality 6/10 Major 12 unhealthy d/yr today · 14 by 30 yrs out
Nearby sold comps map
Loading sold comps map…
Walkable amenities ~0.75 mi
Loading nearby amenities…
Taxation est. · year 1
- Rental income
- $22,995
- − Mortgage interest
- −$2,745
- − Property taxes
- −$226
- − Insurance
- −$245
- − Repairs & maintenance
- −$1,840
- − Management
- −$1,840
- − Depreciation
- −$1,425
- Taxable income
- $14,675
- Est. tax owed @ 24.0%
- −$3,522
- After-tax cash flow
- $11,090/yr
For passive investors: Depreciation is non-cash, so a rental often shows a tax loss while cash-flowing — sheltering income. Rental losses are passive: they offset passive income freely, and up to $25,000/yr can offset ordinary (W-2) income if you actively participate and your MAGI is under $100k (phasing out to $0 by $150k); unused losses carry forward. On sale, claimed depreciation is recaptured at up to 25%, and gains may owe capital-gains tax (a 1031 exchange can defer both). Figures are a year-1 estimate at your 24.0% rate — not tax advice; consult a CPA.
Schools (NCES district)
- District
- Hemet Unified
- NCES district ID
- 0616920
- Math proficiency
- 19% ▼ -3.00%
- Reading proficiency
- 41% ▲ 4.00%
- Median HH income
- $39,962
- Composite
- 25.16/100
- National rank
- #7517
- State rank
- #360 of 517 in CA
Livability — Hemet
- Score
- 51/100
- State rank
- #1056
- US rank
- #25208
Category grades
Schools grade is shown separately in the Schools card above.
Census & demographics
- Census place
- Hemet, CA
- County
- Riverside County · 2,287,001 people
- City population
- 137,670
- Metro
- Riverside-San Bernardino-Ontario, CA
- Population (ZIP)
- 45,982
- Household income
- $63,770
- Rent vs Own
- Severe rent burden
- 1813.0
Population outlook (Riverside County) Hauer SSP2
- Today (2025)
- 2,664,475 people
- By 2030
- 2,802,692 · +5.2%
- By 2040
- 3,050,904 · +14.5%
- By 2050
- 3,256,783 · +22.2%
- By 2075
- 3,655,058 · +37.2%
- By 2100
- 3,766,594 · +41.4%
Race, ethnicity, and origin ACS 2023
- Neighborhood character
- Diverse neighborhood (Simpson 0.65)
- Race & ethnicity
- Hispanic / Latino 46% White 35% Two or more races 17% Black 8% Asian 5% Native American 1%
- Hispanic origin (detail)
- Mexican 40%
- Common ancestry
- Slovak 2% Lithuanian 2% Portuguese 1%
- Foreign-born
- 19% · Canada, Vietnam, Jamaica
- Languages at home
- 69% English-only · Spanish 27% Tagalog/Filipino 1% Other Indo-European 1%
Political lean MEDSL · Riverside
- 2024 margin
- Toss-up / Even · D 48.0% · R 49.3% · Other 2.6%
- 2008→2024 swing
- -3.6pp toward R · 2008: 2.3pp · 2024: -1.3pp
- All cycles
- 2024: R+1.3 2020: D+8.0 2016: D+4.3 2012: R+0.4 2008: D+2.3
Not yet ingested
- Civics
- —
Market trends
- HPI YoY
- ▼ -116.25%
- Current HPI
- 356.9414
- Rent YoY
- ▲ 3.74%
- Metro
- Riverside-San Bernardino-Ontario, CA
- State GDP YoY
- ▲ 3.21%
- F500 in state
- 116
Industry mix (Fortune 500 HQ in CA)
| Industry | F500 HQs | Revenue |
|---|---|---|
| Technology | 27 | $1,492B |
|
||
| Financial Services | 3 | $174B |
|
||
| Retail | 3 | $44B |
|
||
| Insurance | 3 | $26B |
|
||
| Media / Entertainment | 2 | $115B |
|
||
| Pharmaceuticals / Biotech | 2 | $62B |
|
||
Price history
+173.7% since first listed33 events — show timeline
- 2026-05-19 Price Changed $49,000 CRMLS
- 2026-05-18 Relisted — CRMLS
- 2026-05-01 Pending — CRMLS
- 2026-02-26 Price Changed $44,000 CRMLS
- 2026-02-10 Relisted — CRMLS
- 2025-11-07 Listed $55,000 CRMLS
- 2025-10-25 Listing Removed — CRMLS
- 2025-08-22 Listing Removed — CRMLS
- 2025-08-22 Listed $72,000 CRMLS
- 2025-08-09 Listed $72,000 CRMLS
- 2025-02-06 Listing Removed — CRMLS
- 2024-12-20 Price Changed $70,000 CRMLS
- 2024-11-05 Price Changed $65,000 CRMLS
- 2024-10-16 Listed $72,500 CRMLS
- 2024-09-13 Listing Removed — CRMLS
- 2024-09-05 Relisted — CRMLS
- 2024-08-22 Contingent — CRMLS
- 2024-06-20 Price Changed $73,000 CRMLS
- 2024-06-14 Relisted — CRMLS
- 2024-05-03 Listed $82,500 CRMLS
- 2024-05-03 Coming Soon — CRMLS
- 2024-04-12 Listed $90,000 CRMLS
- 2024-04-11 Coming Soon — CRMLS
- 2021-07-30 Sold (MLS) $28,000 CRMLS
- 2021-07-03 Pending — CRMLS
- 2021-06-22 Listed $19,900 CRMLS
- 2011-08-15 Listing Removed — CRMLS
- 2011-08-15 Relisted — CRMLS
- 2011-08-09 Delisted — CRMLS
- 2011-06-13 Price Changed $10,000 CRMLS
- 2011-03-30 Listed $12,500 CRMLS
- 2011-01-24 Listing Removed — CRMLS
- 2010-07-25 Listed $17,900 CRMLS
Property tax history
-0.1%/yrLatest (2025): $226 · +2.0% YoY. Source: county tax records.
Cash-flow waterfall
monthlySold comps — $/sqft
last 12 mo · ≤1 miLoading sold comps…