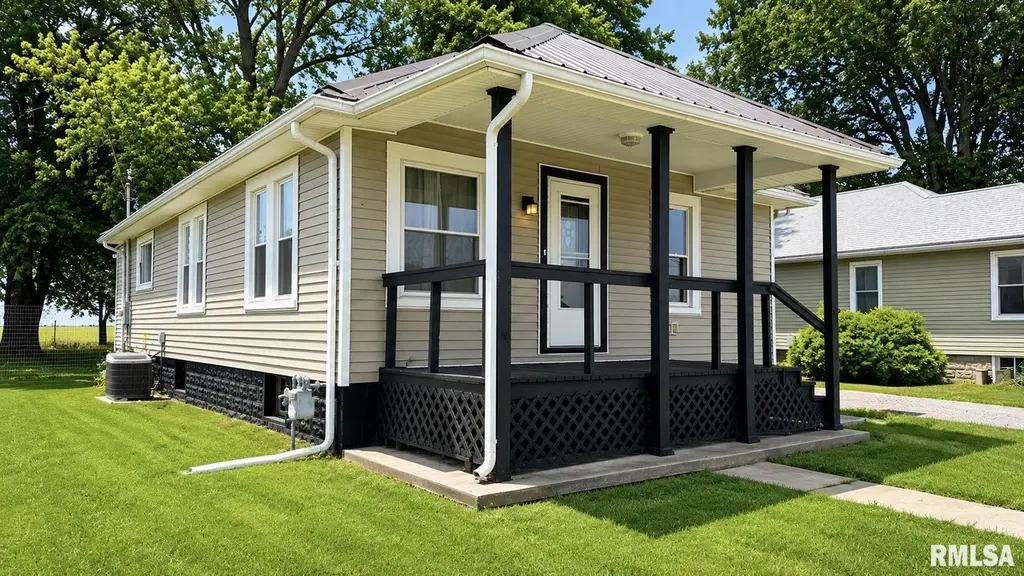
955 W Carter St · Fairview, IL
Flood risk 1/10 · Minimal
- FEMA flood zone
- X (unshaded)
- Chance of flooding over 30 yrs
- 0.0%
- Est. flood insurance / yr
- $473 – $860
Fire risk 1/10 · Minimal
- Est. fire insurance / yr
- $804 – $1,492
Heat risk 3/10 · Minor
- Hot days now (above 104°F)
- 7 days/yr
- Hot days in 30 yrs
- 18 days/yr
Wind risk 2/10 · Minimal
- Chance of severe wind over 30 yrs
- 1.0%
Air-quality risk 2/10 · Minimal
- Unhealthy air days now
- 1 days/yr
- Unhealthy air days in 30 yrs
- 2 days/yr
Risk factors via First Street. Map © Google.
Why this score? — see what drove the C- grade
The composite is a weighted blend of 9 inputs, each scored 0–100. Each bar is that input's sub-score; the figure is the points it added to the 100-point composite (weight × sub-score).
- Cash flow +17.9/30.0
- ARV discount +7.5/15.0
- DSCR +5.6/10.0
- 1% rule +5.5/10.0
- Appreciation +5.0/10.0
- Schools +3.7/10.0
- Livability +3.1/5.0
- Rent growth +2.5/5.0
- Condition / age +2.5/5.0
$81,900
🖨 Deal sheet 📄 Offer letter ✓ Due diligence
Listing remarks MLS
This affordable 2 Bedroom Home on the edge of Fairview is Freshly Painted, with NEW FLOORING and NEW Kitchen Counter in 8/24! Siding and Fan Fold NEW 7/24! Metal Roof NEW in 2016! Furnace and Central Air serviced by GM Mechanical 7/24! Gutter Guards, Oversized Metal Garage! Large Yard! You need to check this one out!
Key facts
- All new plumbing
- New flooring
- Newer siding
Tags
Property features AI
Exterior
- Parking: Detached 2-car garage
- Utilities: Public water; Public sewer
- Home design: Single family residence; Built in 1925; Approximately 850 total building area
- Construction: Metal roof; Full unfinished basement
- Exterior features: Level lot; Lot dimensions approximately 53 x 213
Interior
- Kitchen: Refrigerator included
- Bedrooms: Two bedrooms (both on the main level)
- Flooring: Other flooring throughout
- Bathrooms: One full bathroom
- Heating & cooling: Forced air heating; Central air conditioning
- Interior features: Full unfinished basement; Egress window in one bedroom; Refrigerator, Washer, Dryer included
- Laundry & utility: Main level laundry; Washer and Dryer included; Electric water heater
Neighborhood map
What this means for you Summary
Snapshot
- This is a 2-bed/1.0-bath other listed at $82k.
Deal economics
- At list price, monthly cash flow is $69 ($823/yr) — positive.
- The deal already cash-flows at list — no discount required.
- Meets the 1% rule at list price ($860 rent vs $82k).
- Recommended offer: $81k (1.5% below list) — sets the bar for market timing.
Location & tenants
- Location reads 61/100 on livability (#919 in IL) — a middle-class / working-renter tenant base. Strengths: cost of living A+, housing A+; Watch: crime D+, amenities F, commute F.
- Spoon River Valley CUSD 4 (rural): math 35% / reading 45% proficiency, ranked #314 of 919 in IL (top 34%) — families likely to look elsewhere, expect single-tenant / working-renter base with shorter leases.
- Zoned schools: Spoon River Valley Sr High Sch (math 30% / reading 30%, grade F, #179 of 693 statewide, top 27%, 73 students, 0% FRL) — zoned schools average 0% FRL vs 35% district-wide (35 pts lower); this property's tenant base skews higher-income than the district average.
- Market conditions: 2 active listings in the ZIP; 14 units permitted in Fulton County in 2024 (0 in 5+ unit buildings).
Forward outlook
- In year one you build about $3k of equity ($566 loan paydown + $2k appreciation (3.0% local appreciation)).
- Fulton County population projected at -20% by 2050 — secular population decline; favor cash flow + early exit over multi-decade hold.
- At projected returns (3.0% appreciation + 3.0% rent growth), your $23k cash investment doubles in ~6 years — after that, you're playing with house money.
Negotiation context
- It's been on market 19 days — a 2% lower offer ($81k) is reasonable based on typical stale-listing flexibility.
- 2 sale attempts since 2y ago with the ask held roughly flat each time — persistent listings suggest the price (not the market) is what's stuck; bring a comps-based counter.
- Current owner paid $57k; 43% above their basis — modest negotiation headroom, anchor on the comps not their cost.
Risks & watch-outs
- Watch-outs: built in 1925 — expect roof / HVAC / electrical / plumbing capex.
Questions for the listing agent
- Built in 1925 — when were the roof, HVAC, electrical panel, plumbing, and water heater last replaced?
- Is there a deadline driving the sale (1031 exchange, divorce, estate, relocation)? That informs how much negotiation room exists.
- Schools are D-rated, which usually means shorter tenancies and higher turnover. Who's the typical renter profile here, and what's been the actual vacancy rate?
- Crime grade is D in this area — have there been break-ins, vandalism, or insurance claims at this property in the last 3 years? What carrier currently insures it and at what premium?
- What's the average days-on-market for RENTAL listings here right now (not sales)? A rising rental-DOM trend means longer vacancies and softer asking-rent achievability than the comps imply.
- What's the recent tenant-quality profile in this submarket — average credit score on applications, eviction rate, late-payment / NSF rate, and stable-employment percentage? A property-management company in the area should have these aggregated.
- How much new for-sale + rental construction is in the pipeline within 1–3 miles? Heavy new supply typically softens prices + rents 12–24 months out; constrained supply supports both.
Investment metrics
- 1% rule
- 1.05% ✓
- Cap rate
- 7.30%
- Cash-on-cash
- 3.59%
- DSCR
- 1.16
- GRM
- 7.9
CMA / ARV
No comps found within radius.
Projected returns pro-forma
3.0% appreciation · 3.0% rent growth · sell at horizon
- IRR
- 10.9%
- Equity multiple
- 1.62×
- Total profit
- $14,272
- Equity at exit
- $36,826
- IRR
- 13.1%
- Equity multiple
- 2.95×
- Total profit
- $44,757
- Equity at exit
- $56,753
Cash invested: $22,932 (down + closing). Projections, not guarantees.
Landlord ↔ Tenant lean methodology
- Overall (STATE)
- 43 Moderately Tenant-Leaning
- State Illinois
- 43 Moderately Tenant-Leaning · D+7
- County
- — inherits STATE
- City
- — inherits STATE
ZIP-level market 61432
- Active inventory
- 2
- Price-to-rent
- 7.9×
Monthly cashflow live
- Estimated rent
- $860 medium interval (Pro) →
- Mortgage (P&I)
- −$429
- Tax from tax record
- −$147 /mo · $1,764/yr
- Insurance
- −$34
- HOA
- −$0
- Vacancy / Maint / Mgmt
- −$181
- Net cashflow
- $69
Break-even live
UW: 25.0% down · 7.5% · 30yr · 1.5% tax · 5.0% vac · 8.0% maint · 8.0% mgmt
Financing live
Cash to close
- Down payment
- $20,475
- Closing costs
- $2,457
- Reserves months
- —
- Total cash needed
- —
Loan-product check · same deal, 3 products live
Conventional
25% down · 7.5% · 30yr
- Down + closing
- —
- Monthly P&I
- —
- Monthly cashflow
- —
- DSCR
- —
- Eligible?
- —
Personal DTI + credit; lowest rate.
DSCR
20% down · 8.5% · 30yr
- Down + closing
- —
- Monthly P&I
- —
- Monthly cashflow
- —
- DSCR
- —
- Eligible?
- —
No personal income docs; deal must DSCR.
Hard money
10% down · 12.0% · 12mo
- Down + closing
- —
- Monthly P&I
- —
- Monthly cashflow
- —
- DSCR
- —
- Eligible?
- —
Short-term bridge; refi at stabilization.
Listing history 15 events
-
2026-06-18days on market $81,900 Active 19 DOM
-
2026-06-17pricedays on market $81,900 Active 18 DOM
-
2026-06-16days on market $84,900 Active 17 DOM
-
2026-06-15days on market $84,900 Active 16 DOM
-
2026-06-13days on market $84,900 Active 14 DOM
-
2026-06-12days on market $84,900 Active 13 DOM
-
2026-06-09days on market $84,900 Active 10 DOM
-
2026-06-08days on market $84,900 Active 9 DOM
-
2026-06-07days on market $84,900 Active 8 DOM
-
2026-06-05days on market $84,900 Active 6 DOM
-
2026-06-04days on market $84,900 Active 4 DOM
-
2026-06-02days on market $84,900 Active 3 DOM
-
2026-06-01days on market $84,900 Active 2 DOM
-
2026-05-31remarks 699-char remark
-
2026-05-31$84,900 Active 1 DOM
ⓘ Source: listings_history table (triggers on properties + properties_extension) + one-shot
backfill from property_details.listing_events for pre-trigger history.
Tax reassessment forecast IL · Partial reset (capped growth)
- Current annual tax
- $1,764 · $147/mo
- Projected year-2 tax
- $1,812 · $151/mo
- Expected delta
- +$48/yr (+$4/mo · 2.7%)
ⓘ Screening estimate from a state-policy table — verify with the county assessor before closing.
Climate risk First Street
- Flood 1/10 Low FEMA zone X (unshaded) · 0% chance over 30 yrs
- Wildfire 1/10 Low
- Heat 3/10 Moderate 7 d/yr ≥104°F today · 18 d/yr by 30 yrs out
- Wind 2/10 Low 100% chance of damaging wind over 30 yrs
- Air quality 2/10 Low 1 unhealthy d/yr today · 2 by 30 yrs out
Nearby sold comps map
Loading sold comps map…
Walkable amenities ~0.75 mi
Loading nearby amenities…
Taxation est. · year 1
- Rental income
- $10,316
- − Mortgage interest
- −$4,588
- − Property taxes
- −$1,764
- − Insurance
- −$410
- − Repairs & maintenance
- −$825
- − Management
- −$825
- − Depreciation
- −$2,383
- Taxable loss
- −$478
- Est. tax savings @ 24.0%
- +$115
- After-tax cash flow
- $937/yr
For passive investors: Depreciation is non-cash, so a rental often shows a tax loss while cash-flowing — sheltering income. Rental losses are passive: they offset passive income freely, and up to $25,000/yr can offset ordinary (W-2) income if you actively participate and your MAGI is under $100k (phasing out to $0 by $150k); unused losses carry forward. On sale, claimed depreciation is recaptured at up to 25%, and gains may owe capital-gains tax (a 1031 exchange can defer both). Figures are a year-1 estimate at your 24.0% rate — not tax advice; consult a CPA.
Schools (NCES district)
- District
- Spoon River Valley CUSD 4
- NCES district ID
- 1736960
- Math proficiency
- 35% ▬ 0.00%
- Reading proficiency
- 45% ▲ 5.00%
- Median HH income
- $51,341
- Composite
- 37.03/100
- National rank
- #9073
- State rank
- #314 of 919 in IL
Livability — Fairview
- Score
- 61/100
- State rank
- #919
- US rank
- #17819
Category grades
Schools grade is shown separately in the Schools card above.
Census & demographics
- Census place
- Fairview, IL
- Population (ZIP)
- 589
Population outlook (Fulton County) Hauer SSP2
- Today (2025)
- 33,356 people
- By 2030
- 32,144 · -3.6%
- By 2040
- 29,518 · -11.5%
- By 2050
- 26,775 · -19.7%
- By 2075
- 19,972 · -40.1%
- By 2100
- 13,580 · -59.3%
Race, ethnicity, and origin ACS 2023
- Neighborhood character
- Predominantly White (99%)
- Race & ethnicity
- White 99% Two or more races 1%
- Common ancestry
- Scottish 7% Italian 3% Iranian 3%
- Foreign-born
- 0%
Political lean MEDSL · Fulton
- 2024 margin
- Strong R (+23.8) · D 37.1% · R 60.9% · Other 2.0%
- 2008→2024 swing
- -45.2pp toward R · 2008: 21.3pp · 2024: -23.8pp
- All cycles
- 2024: R+23.8 2020: R+20.1 2016: R+15.1 2012: D+11.1 2008: D+21.3
Not yet ingested
- Civics
- —
Market trends
- HPI YoY
- —
- Current HPI
- —
- Rent YoY
- —
- Metro
- —
- State GDP YoY
- ▲ 1.59%
- F500 in state
- 60
Industry mix (Fortune 500 HQ in IL)
| Industry | F500 HQs | Revenue |
|---|---|---|
| Insurance | 4 | $201B |
|
||
| Consumer Goods | 4 | $87B |
|
||
| Industrial Machinery | 3 | $64B |
|
||
| Healthcare | 2 | $55B |
|
||
| Retail / Pharmacy | 1 | $148B |
|
||
| Agriculture / Food | 1 | $86B |
|
||
Price history
+23.0% since first listed6 events — show timeline
- 2026-05-30 Listed $84,900 RMLSA as Distributed by MLS Grid
- 2025-02-10 Sold (Public Records) $57,500 Public Records
- 2025-02-10 Sold (MLS) $57,250 RMLSA as Distributed by MLS Grid
- 2025-01-15 Pending — RMLSA as Distributed by MLS Grid
- 2024-11-18 Price Changed $64,900 RMLSA as Distributed by MLS Grid
- 2024-10-09 Listed $69,000 RMLSA as Distributed by MLS Grid
Property tax history
+8.0%/yrLatest (2024): $1,764 · +2.3% YoY. Source: county tax records.
Cash-flow waterfall
monthlySold comps — $/sqft
last 12 mo · ≤1 miLoading sold comps…