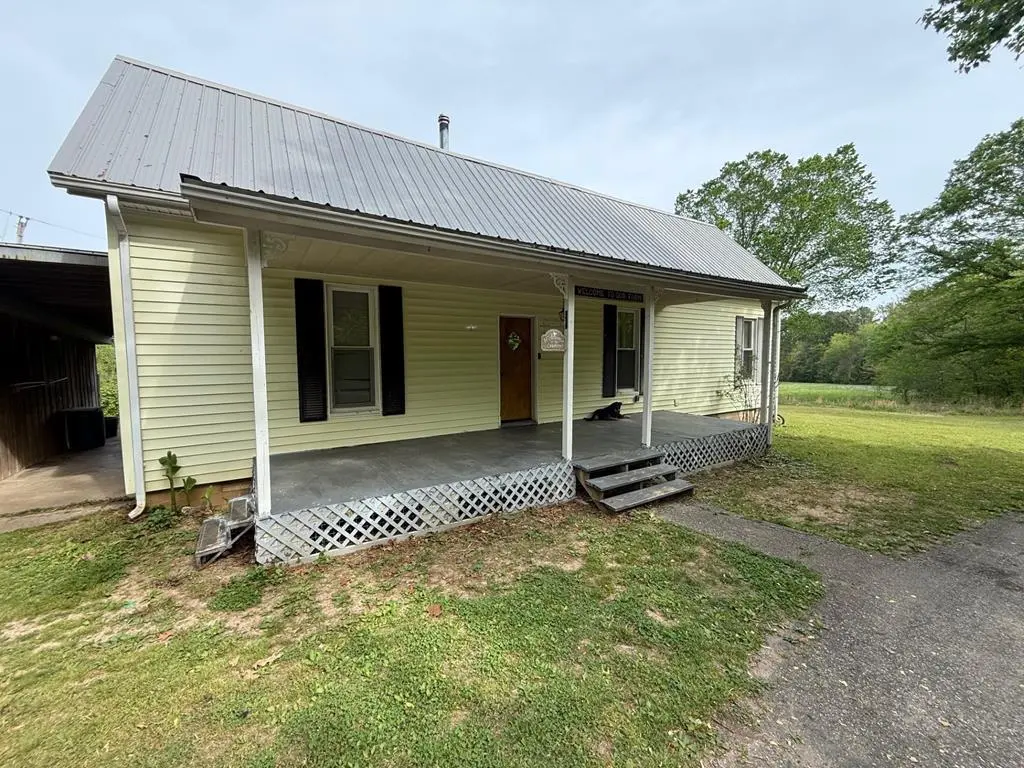
2245 Rabbit Creek Rd · Buchanan, TN
Flood risk 1/10 · Minimal
- FEMA flood zone
- X (unshaded)
- Chance of flooding over 30 yrs
- 0.0%
- Est. flood insurance / yr
- $507 – $1,088
Fire risk 3/10 · Minor
- Est. fire insurance / yr
- $949 – $1,763
Heat risk 5/10 · Moderate
- Hot days now (above 108°F)
- 7 days/yr
- Hot days in 30 yrs
- 20 days/yr
Wind risk 4/10 · Minor
- Chance of severe wind over 30 yrs
- 10.0%
Air-quality risk 1/10 · Minimal
- Unhealthy air days now
- 0 days/yr
- Unhealthy air days in 30 yrs
- 0 days/yr
Risk factors via First Street. Map © Google.
Why this score? — see what drove the D grade
The composite is a weighted blend of 9 inputs, each scored 0–100. Each bar is that input's sub-score; the figure is the points it added to the 100-point composite (weight × sub-score).
- Cash flow +10.2/30.0
- Appreciation +10.0/10.0
- ARV discount +7.5/15.0
- DSCR +2.9/10.0
- Rent growth +2.5/5.0
- Schools +2.5/10.0
- Livability +2.5/5.0
- Condition / age +2.5/5.0
- 1% rule +1.7/10.0
$175,000
🖨 Deal sheet 📄 Offer letter ✓ Due diligence
Listing remarks
SELLER is offering a $5000.00 credit to BUYER at closing that buyer can use for improvements or closing cost expenses. If you are looking for an older 1900s farmhouse in the country here it is! Home has had updates, Bathroom remodeled 2023, new flooring in 2024, New metal roof in 2021, New central heat and air 2025, appliances new in 2023, Wood burning fireplace, Wired for generator connection, Kitchen appliances included, old log structure outbuilding that's really cool. Chicken coop! Fruit trees like apple, pear, plum, peach. Also blackberry vines and muscadine vines. Upstairs bonus area is simi finished heated and cooled. Located not far from Kentucky Lake.
Key facts
- Blackberry vines
- Muscadine vines
- Fruit trees
Tags
Property features AI
Finance
- Other: Approximately 1 acre lot
Exterior
- Parking: Attached 2-car garage; 2 covered parking spaces; Open parking; Asphalt driveway
- Utilities: Private well water; Septic tank sewer
- Home design: Single-family residence; Residential property
- Construction: Vinyl siding; Metal roof; Built on crawl space
- Exterior features: Front porch; Porch; Partial fencing; Paved road access
Interior
- Kitchen: Electric oven; Electric range; Range hood; Refrigerator; Dishwasher
- Bedrooms: 3 main-level bedrooms
- Bathrooms: 2 full bathrooms
- Heating & cooling: Heat pump heating; Central air conditioning
- Interior features: Storm windows; Crawl space basement
- Laundry & utility: Main-level laundry
Neighborhood map
What this means for you Summary
Snapshot
- This is a 3-bed/1.0-bath single-family listed at $175k.
Deal economics
- At list price, monthly cash flow is $-98 ($-1k/yr) — negative.
- To cash-flow at today's rent, offer at most $158k (9.9% below list).
- To meet the 1% rule (rent ≥ 1% of price), the offer needs to be $117k (33.2% below list).
- Recommended offer: $117k (33.2% below list) — sets the bar for 1% rule.
- Cap rate 5.6% vs local median 1.8% in Buchanan — top-decile yield for the area; either an underpriced asset or a hidden risk that comps aren't pricing in. Stress-test before assuming the spread holds.
Location & tenants
- Location reads: area grade D — affects rentability + tenant quality, not the cash-flow math above.
- Henry County (rural): math 30% / reading 30% proficiency, ranked #60 of 139 in TN (top 43%) — families likely to look elsewhere, expect single-tenant / working-renter base with shorter leases.
- Zoned schools: Lakewood Elementary (math 38% / reading 30%, grade F, #351 of 952 statewide, top 37%, 505 students, 0% FRL); Lakewood Middle School (math 34% / reading 25%, grade F, #107 of 333 statewide, top 33%, 249 students, 0% FRL) — zoned schools average 0% FRL vs 55% district-wide (55 pts lower); this property's tenant base skews higher-income than the district average.
- Market conditions: 46 active listings in the ZIP; 19 units permitted in Henry County in 2024 (0 in 5+ unit buildings).
Forward outlook
- In year one you build about $19k of equity ($1k loan paydown + $18k appreciation (10.0% local appreciation)).
- Henry County population projected to shrink 10% by 2050 — rents likely to lag national; underwrite the cash flow, not the appreciation.
- By year 2, paydown + projected appreciation supports a ~$30k cash-out refi (75% LTV) — recoverable capital for the next deal without selling this one.
Negotiation context
- It's been on market 64 days — a 6% lower offer ($164k) is reasonable based on typical stale-listing flexibility.
- 4 sale attempts since 3y ago; this cycle's ask has dropped $15k (8%) from the opening price — seller is motivated, your offer sets the floor, not the list.
- Current owner paid $70k; list at $175k implies a 150% gain — meaningful room to come down on a strong offer.
Risks & watch-outs
- Watch-outs: built in 1900 — expect roof / HVAC / electrical / plumbing capex.
- Climate carrying-cost: extreme-heat days projected 7→20/yr by 2055 (HVAC capex compounding) — expect insurance premiums to compound above CPI over the hold.
Questions for the listing agent
- What do current leases actually rent for vs. the listed asking? Can we see a recent rent roll and the last 12 months of T-12 income?
- It's been on market 64 days. Have you received any prior offers? Is the seller open to a 33% concession, seller financing, or rate buy-down credit?
- Built in 1900 — when were the roof, HVAC, electrical panel, plumbing, and water heater last replaced?
- Why hasn't it sold? Are there any deal-killer items the seller is aware of (foundation, flood, title, zoning, code violations)?
- Is there a deadline driving the sale (1031 exchange, divorce, estate, relocation)? That informs how much negotiation room exists.
- The area grade is low — what's the realistic commute time and amenity access for the typical tenant pool here? Any planned neighborhood developments (good or bad) we should know about?
- What's the average days-on-market for RENTAL listings here right now (not sales)? A rising rental-DOM trend means longer vacancies and softer asking-rent achievability than the comps imply.
- What's the recent tenant-quality profile in this submarket — average credit score on applications, eviction rate, late-payment / NSF rate, and stable-employment percentage? A property-management company in the area should have these aggregated.
- How much new for-sale + rental construction is in the pipeline within 1–3 miles? Heavy new supply typically softens prices + rents 12–24 months out; constrained supply supports both.
Investment metrics
- 1% rule
- 0.67% ✗
- Cap rate
- 5.62%
- Cash-on-cash
- -2.40%
- DSCR
- 0.89
- GRM
- 12.5
CMA / ARV
No comps found within radius.
Projected returns pro-forma
10.0% appreciation · 3.0% rent growth · sell at horizon
- IRR
- 22.5%
- Equity multiple
- 2.82×
- Total profit
- $88,964
- Equity at exit
- $157,654
- IRR
- 20.2%
- Equity multiple
- 6.44×
- Total profit
- $266,702
- Equity at exit
- $339,987
Cash invested: $49,000 (down + closing). Projections, not guarantees.
Landlord ↔ Tenant lean methodology
- Overall (STATE)
- 87 Strongly Landlord-Friendly
- State Tennessee
- 87 Strongly Landlord-Friendly · R+13
- County
- — inherits STATE
- City
- — inherits STATE
ZIP-level market 38222
- Home prices YoY
- 8.0%
- Active inventory
- 46
- Price-to-rent
- 12.5×
Monthly cashflow live
- Estimated rent
- $1,169 medium interval (Pro) →
- Mortgage (P&I)
- −$918
- Tax from tax record
- −$31 /mo · $370/yr
- Insurance
- −$73
- HOA
- −$0
- Vacancy / Maint / Mgmt
- −$245
- Net cashflow
- $-98
Break-even live
UW: 25.0% down · 7.5% · 30yr · 1.5% tax · 5.0% vac · 8.0% maint · 8.0% mgmt
Financing live
Cash to close
- Down payment
- $43,750
- Closing costs
- $5,250
- Reserves months
- —
- Total cash needed
- —
Loan-product check · same deal, 3 products live
Conventional
25% down · 7.5% · 30yr
- Down + closing
- —
- Monthly P&I
- —
- Monthly cashflow
- —
- DSCR
- —
- Eligible?
- —
Personal DTI + credit; lowest rate.
DSCR
20% down · 8.5% · 30yr
- Down + closing
- —
- Monthly P&I
- —
- Monthly cashflow
- —
- DSCR
- —
- Eligible?
- —
No personal income docs; deal must DSCR.
Hard money
10% down · 12.0% · 12mo
- Down + closing
- —
- Monthly P&I
- —
- Monthly cashflow
- —
- DSCR
- —
- Eligible?
- —
Short-term bridge; refi at stabilization.
Listing history 31 events
-
2026-06-18days on market $175,000 Active 64 DOM
-
2026-06-17days on market $175,000 Active 63 DOM
-
2026-06-16days on market $175,000 Active 62 DOM
-
2026-06-15days on market $175,000 Active 61 DOM
-
2026-06-13remarks 668-char remark
-
2026-06-13days on market $175,000 Active 59 DOM
-
2026-06-12remarks 621-char remark
-
2026-06-12days on market $175,000 Active 58 DOM
-
2026-06-09days on market $175,000 Active 55 DOM
-
2026-06-08days on market $175,000 Active 54 DOM
-
2026-06-08days on market $175,000 Active 53 DOM
-
2026-06-07days on market $175,000 Active 52 DOM
-
2026-06-03days on market $175,000 Active 49 DOM
-
2026-06-02days on market $175,000 Active 48 DOM
-
2026-06-01days on market $175,000 Active 47 DOM
-
2026-05-31days on market $175,000 Active 46 DOM
-
2026-05-05price $179,900
-
2026-04-15$189,900 Active
-
2024-10-26historical
-
2024-10-09price $189,900
-
2024-09-10price $199,900
-
2024-08-19$219,900 Active
-
2024-07-24historical
-
2024-05-28$199,900 Active
-
2024-05-20historical
-
2024-04-15price $209,000
-
2024-03-01price $219,900
-
2024-01-29price $229,900
-
2023-12-08$239,900 Active
-
2008-01-17soldstatus $70,000
-
1999-09-21soldstatus $53,000
ⓘ Source: listings_history table (triggers on properties + properties_extension) + one-shot
backfill from property_details.listing_events for pre-trigger history.
Tax reassessment forecast TN · Resets to sale price
- Current annual tax
- $370 · $31/mo
- Projected year-2 tax
- $1,242 · $104/mo
- Expected delta
- +$872/yr (+$73/mo · 235.8%)
ⓘ Screening estimate from a state-policy table — verify with the county assessor before closing.
Climate risk First Street
- Flood 1/10 Low FEMA zone X (unshaded) · 0% chance over 30 yrs
- Wildfire 3/10 Moderate
- Heat 5/10 Major 7 d/yr ≥108°F today · 20 d/yr by 30 yrs out
- Wind 4/10 Moderate 10% chance of damaging wind over 30 yrs
- Air quality 1/10 Low 0 unhealthy d/yr today · 0 by 30 yrs out
Nearby sold comps map
Loading sold comps map…
Walkable amenities ~0.75 mi
Loading nearby amenities…
Taxation est. · year 1
- Rental income
- $14,026
- − Mortgage interest
- −$9,803
- − Property taxes
- −$370
- − Insurance
- −$875
- − Repairs & maintenance
- −$1,122
- − Management
- −$1,122
- − Depreciation
- −$5,091
- Taxable loss
- −$4,357
- Est. tax savings @ 24.0%
- +$1,046
- After-tax cash flow
- $-132/yr
For passive investors: Depreciation is non-cash, so a rental often shows a tax loss while cash-flowing — sheltering income. Rental losses are passive: they offset passive income freely, and up to $25,000/yr can offset ordinary (W-2) income if you actively participate and your MAGI is under $100k (phasing out to $0 by $150k); unused losses carry forward. On sale, claimed depreciation is recaptured at up to 25%, and gains may owe capital-gains tax (a 1031 exchange can defer both). Figures are a year-1 estimate at your 24.0% rate — not tax advice; consult a CPA.
Schools (NCES district)
- District
- Henry County
- NCES district ID
- 4701830
- Math proficiency
- 30% ▼ -3.00%
- Reading proficiency
- 30% ▼ -6.00%
- Median HH income
- $41,770
- Composite
- 25.42/100
- National rank
- #7457
- State rank
- #60 of 139 in TN
Livability — Buchanan
No livability data for this city. (Only ~50 U.S. cities are tracked.)
Census & demographics
- Population (ZIP)
- 1,899
Population outlook (Henry County) Hauer SSP2
- Today (2025)
- 31,750 people
- By 2030
- 31,277 · -1.5%
- By 2040
- 30,064 · -5.3%
- By 2050
- 28,675 · -9.7%
- By 2075
- 25,767 · -18.8%
- By 2100
- 22,318 · -29.7%
Race, ethnicity, and origin ACS 2023
- Neighborhood character
- Predominantly White (88%)
- Race & ethnicity
- White 88% Native American 5% Two or more races 5% Hispanic / Latino 4% Black 2%
- Common ancestry
- Lithuanian 4% Iranian 1% Romanian 1%
- Foreign-born
- 1% · Canada, Jamaica
- Languages at home
- 99% English-only · Spanish 1%
Political lean MEDSL · Henry
- 2024 margin
- Solid R (+55.3) · D 21.8% · R 77.1% · Other 1.1%
- 2008→2024 swing
- -33.0pp toward R · 2008: -22.4pp · 2024: -55.3pp
- All cycles
- 2024: R+55.3 2020: R+51.1 2016: R+49.8 2012: R+30.2 2008: R+22.4
Not yet ingested
- Civics
- —
Market trends
- HPI YoY
- ▲ 23.63%
- Current HPI
- 319.6388
- Rent YoY
- —
- Metro
- —
- State GDP YoY
- ▲ 2.78%
- F500 in state
- 22
Industry mix (Fortune 500 HQ in TN)
| Industry | F500 HQs | Revenue |
|---|---|---|
| Healthcare | 3 | $91B |
|
||
| Retail | 3 | $72B |
|
||
| Transportation / Logistics | 1 | $88B |
|
||
| Paper / Packaging | 1 | $19B |
|
||
| Insurance | 1 | $13B |
|
||
| Energy | 1 | $12B |
|
||
Price history
+239.4% since first listed15 events — show timeline
- 2026-05-05 Price Changed $179,900 TVAR
- 2026-04-15 Listed $189,900 TVAR
- 2024-10-26 Listing Removed — REALTRACS as Distributed by MLS Grid
- 2024-10-09 Price Changed $189,900 REALTRACS as Distributed by MLS Grid
- 2024-09-10 Price Changed $199,900 REALTRACS as Distributed by MLS Grid
- 2024-08-19 Listed $219,900 REALTRACS as Distributed by MLS Grid
- 2024-07-24 Listing Removed — REALTRACS as Distributed by MLS Grid
- 2024-05-28 Listed $199,900 REALTRACS as Distributed by MLS Grid
- 2024-05-20 Listing Removed — REALTRACS as Distributed by MLS Grid
- 2024-04-15 Price Changed $209,000 REALTRACS as Distributed by MLS Grid
- 2024-03-01 Price Changed $219,900 REALTRACS as Distributed by MLS Grid
- 2024-01-29 Price Changed $229,900 REALTRACS as Distributed by MLS Grid
- 2023-12-08 Listed $239,900 REALTRACS as Distributed by MLS Grid
- 2008-01-17 Sold (Public Records) $70,000 Public Records
- 1999-09-21 Sold (Public Records) $53,000 Public Records
Property tax history
+1.9%/yrLatest (2025): $370 · +10.1% YoY. Source: county tax records.
Cash-flow waterfall
monthlySold comps — $/sqft
last 12 mo · ≤1 miLoading sold comps…