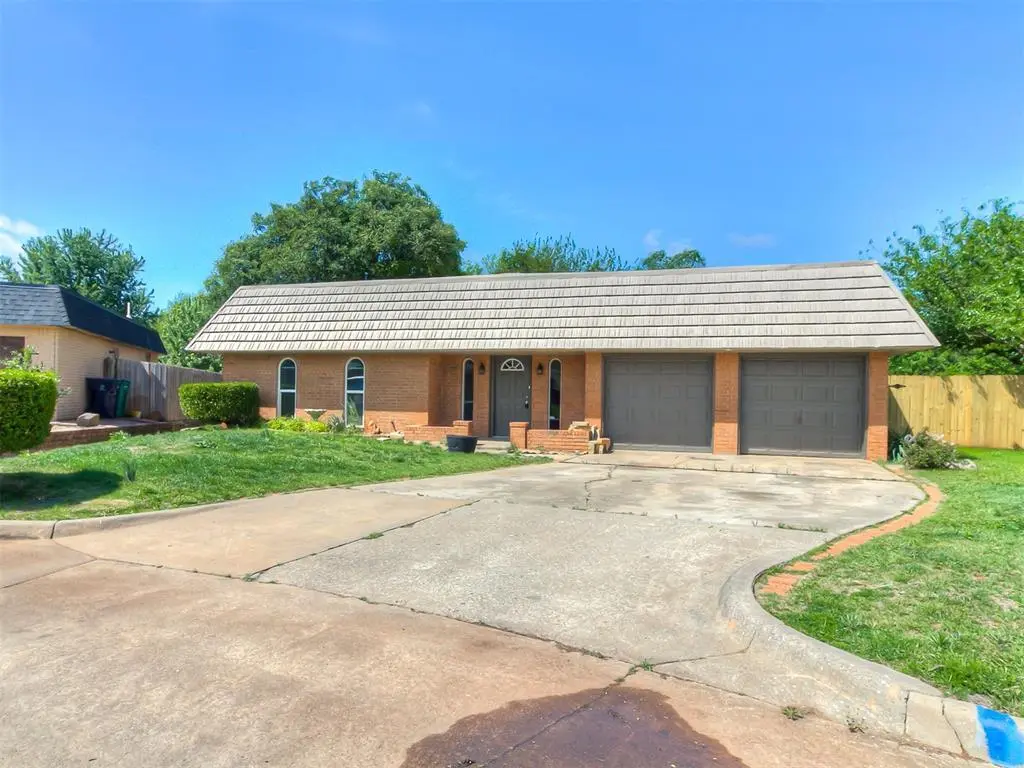
11225 NW 110th St · Oklahoma City, OK
Flood risk 1/10 · Minimal
- FEMA flood zone
- X (unshaded)
- Chance of flooding over 30 yrs
- 0.0%
- Est. flood insurance / yr
- $507 – $1,088
Fire risk 4/10 · Minor
- Est. fire insurance / yr
- $2,463 – $4,575
Heat risk 6/10 · Moderate
- Hot days now (above 107°F)
- 7 days/yr
- Hot days in 30 yrs
- 20 days/yr
Wind risk 3/10 · Minor
- Chance of severe wind over 30 yrs
- 4.0%
Air-quality risk 1/10 · Minimal
- Unhealthy air days now
- 0 days/yr
- Unhealthy air days in 30 yrs
- 0 days/yr
Risk factors via First Street. Map © Google.
Why this score? — see what drove the D+ grade
The composite is a weighted blend of 9 inputs, each scored 0–100. Each bar is that input's sub-score; the figure is the points it added to the 100-point composite (weight × sub-score).
- ARV discount +15.0/15.0
- Cash flow +14.1/30.0
- DSCR +4.3/10.0
- Livability +4.0/5.0
- 1% rule +3.7/10.0
- Rent growth +2.8/5.0
- Schools +2.8/10.0
- Condition / age +2.5/5.0
- Appreciation +0.0/10.0
$265,000
🖨 Deal sheet 📄 Offer letter ✓ Due diligence
Listing remarks
This spacious 4 true bedroom, 2.5 bath home offers multiple living areas and a layout that works for a variety of needs. The front living room features a classic brick fireplace and a welcoming feel, while the large back living room is filled with natural light from its wide windows and open layout — perfect for everyday living or entertaining. Fresh updates include brand-new LVP flooring and interior paint throughout, giving the home a clean, modern look. The kitchen has been refreshed with new granite countertops, ample cabinet storage, and easy flow into the dining area. All four bedrooms are generously sized, and the 2.5 baths offer convenience for busy households. The backyard ba
Key facts
- Brick fireplace
- Community pool
- Peaceful greenbelt
Tags
Property features AI
Finance
- Other: Court approval may be required for sale; Vacant and currently active on the market
- Financial info: Not assumable; Loan qualification: No
- HOA & community: Mandatory association dues; Association fee of $300; Association amenities include a greenbelt and pool
Exterior
- Parking: Two-car garage
- Utilities: No flood insurance required indicated
- Home design: Single family residence; One level; Faces east; Residential property
- Construction: Brick and frame construction; Other roof type; Slab foundation; Built (existing)
- Exterior features: Workshop; Wood fencing; Located on a cul-de-sac
Interior
- Bedrooms: Four bedrooms
- Bathrooms: Two full bathrooms; One half bathroom
- Interior features: Two living areas; Two wood-burning fireplaces; No in-law plan
Neighborhood map
What this means for you Summary
Snapshot
- This is a 4-bed/3.0-bath single-family listed at $265k.
Deal economics
- At list price, monthly cash flow is $40 ($484/yr) — positive.
- The deal already cash-flows at list — no discount required.
- To meet the 1% rule (rent ≥ 1% of price), the offer needs to be $230k (13.1% below list).
- Recommended offer: $230k (13.1% below list) — sets the bar for 1% rule.
- Cap rate 6.5% vs local median 3.7% in Oklahoma City — top-decile yield for the area; either an underpriced asset or a hidden risk that comps aren't pricing in. Stress-test before assuming the spread holds.
Location & tenants
- Location reads 80/100 on livability (#3 in OK, #1,635 nationally) — a professional / high-income tenant draw. Strengths: amenities A+, commute A+, cost of living A+; Watch: crime F.
- Yukon (suburban): math 30% / reading 32% proficiency, ranked #47 of 270 in OK (top 17%) — families likely to look elsewhere, expect single-tenant / working-renter base with shorter leases.
- Zoned schools: Surrey Hills Es (math 37% / reading 27%, grade F, #213 of 845 statewide, top 28%, 725 students, 0% FRL); Yukon Hs (math 26% / reading 38%, grade F, #67 of 447 statewide, top 16%, 2,833 students, 0% FRL) — zoned schools average 0% FRL vs 32% district-wide (32 pts lower); this property's tenant base skews higher-income than the district average.
- Market conditions: Rents rising (+1.2%/yr); 1560 active listings in the ZIP; 9 comparable units currently listed for rent nearby; rentals at typical pace (median 16d on market — plan ~3-4 weeks tenant-placement turnaround); solid renter incomes; 260 units permitted in Canadian County in 2024 (0 in 5+ unit buildings).
- This rent runs 31% of the median local income ($88k/yr) — at the standard rent-burdened threshold; future hikes will face affordability resistance.
Forward outlook
- Local home prices are declining (-3.0%/yr); year-one equity from $2k of loan paydown is wiped out by about $8k of value loss. Plan a longer hold.
- Canadian County population projected at +64% by 2050 — long-run rental-demand tailwind backs the buy-and-hold thesis.
Negotiation context
- It's been on market 45 days — a 3% lower offer ($257k) is reasonable based on typical stale-listing flexibility.
- 2 sale attempts with the ask held roughly flat each time — persistent listings suggest the price (not the market) is what's stuck; bring a comps-based counter.
Risks & watch-outs
- Climate carrying-cost: extreme-heat days projected 7→20/yr by 2055 (HVAC capex compounding) — expect insurance premiums to compound above CPI over the hold.
Questions for the listing agent
- It's been on market 45 days. Have you received any prior offers? Is the seller open to a 13% concession, seller financing, or rate buy-down credit?
- Built in 1974 — when were the roof, HVAC, electrical panel, plumbing, and water heater last replaced?
- What does the HOA fee cover, when was the last increase, and are there any pending special assessments or reserve-fund shortfalls?
- Is there a deadline driving the sale (1031 exchange, divorce, estate, relocation)? That informs how much negotiation room exists.
- Schools are F-rated, which usually means shorter tenancies and higher turnover. Who's the typical renter profile here, and what's been the actual vacancy rate?
- Crime grade is F in this area — have there been break-ins, vandalism, or insurance claims at this property in the last 3 years? What carrier currently insures it and at what premium?
- The area grade is low — what's the realistic commute time and amenity access for the typical tenant pool here? Any planned neighborhood developments (good or bad) we should know about?
- What's the average days-on-market for RENTAL listings here right now (not sales)? A rising rental-DOM trend means longer vacancies and softer asking-rent achievability than the comps imply.
- What's the recent tenant-quality profile in this submarket — average credit score on applications, eviction rate, late-payment / NSF rate, and stable-employment percentage? A property-management company in the area should have these aggregated.
- How much new for-sale + rental construction is in the pipeline within 1–3 miles? Heavy new supply typically softens prices + rents 12–24 months out; constrained supply supports both.
Investment metrics
- 1% rule
- 0.87% ✗
- Cap rate
- 6.48%
- Cash-on-cash
- 0.65%
- DSCR
- 1.03
- GRM
- 9.6
CMA / ARV
- ARV (on-the-fly)
- $410,116
- Comps found
- 12
Show comp detail 12 sales within ~0.75 mi
| Address | Dist | Beds/Ba | Sqft | Sold | Price | $/sf | Match |
|---|---|---|---|---|---|---|---|
| 11110 Hastings Ave | 0.12mi | 4/2.0 | 2,767 (+2%) | 3mo | $284,000 | $103 | 85 |
| 11404 NW 113th Ct | 0.14mi | 4/3.0 | 2,464 (-9%) | 2mo | $397,500 | $161 | 76 |
| 10713 Wild Horse Creek Dr | 0.46mi | 4/3.5 | 2,720 (+0%) | 1mo | $410,000 | $151 | 75 |
| 11521 NW 107th St | 0.41mi | 4/3.5 | 2,482 (-9%) | 0mo | $405,000 | $163 | 64 |
| 11904 Somerville Dr | 0.71mi | 4/2.5 | 2,661 (-2%) | 1mo | $270,000 | $101 | 61 |
| 11804 Somerville Dr | 0.66mi | 4/2.5 | 2,646 (-3%) | 3mo | $360,000 | $136 | 60 |
| 11205 NW 103rd St | 0.46mi | 4/2.0 | 2,473 (-9%) | 2mo | $270,000 | $109 | 58 |
| 11232 NW 105th St | 0.36mi | 4/2.5 | 3,048 (+12%) | 4mo | $375,000 | $123 | 58 |
| 11817 Cherry Point Ln | 0.72mi | 4/2.5 | 2,620 (-4%) | 3mo | $400,000 | $153 | 56 |
| 11809 Charleston Way | 0.74mi | 5/3.0 (+1) | 2,652 (-2%) | 0mo | $380,000 | $143 | 56 |
| 11100 N Ashford Dr | 0.39mi | 3/2.5 (-1) | 2,399 (-12%) | 1mo | $392,000 | $163 | 54 |
| 10401 Two Lakes Dr | 0.75mi | 4/3.0 | 2,330 (-14%) | 1mo | $434,900 | $187 | 40 |
Match score weights: distance 35% · size 25% · config 20% · recency 20%. Top-matched comps best support the ARV.
Projected returns pro-forma
-3.0% appreciation · 1.19% rent growth · sell at horizon
- IRR
- -17.3%
- Equity multiple
- 0.40×
- Total profit
- $-44,494
- Equity at exit
- $39,512
- IRR
- -12.9%
- Equity multiple
- 0.30×
- Total profit
- $-51,736
- Equity at exit
- $22,912
Cash invested: $74,200 (down + closing). Projections, not guarantees.
Landlord ↔ Tenant lean methodology
- Overall (STATE)
- 83 Strongly Landlord-Friendly
- State Oklahoma
- 83 Strongly Landlord-Friendly · R+20
- County
- — inherits STATE
- City
- — inherits STATE
ZIP-level market 73099
- Rents YoY
- 1.2%
- Active inventory
- 1560
- Price-to-rent
- 9.6×
Monthly cashflow live
- Estimated rent
- $2,304 high interval (Pro) →
- Mortgage (P&I)
- −$1,390
- Tax from tax record
- −$255 /mo · $3,056/yr
- Insurance
- −$110
- HOA
- −$25
- Vacancy / Maint / Mgmt
- −$484
- Net cashflow
- $40
Break-even live
UW: 25.0% down · 7.5% · 30yr · 1.5% tax · 5.0% vac · 8.0% maint · 8.0% mgmt
Financing live
Cash to close
- Down payment
- $66,250
- Closing costs
- $7,950
- Reserves months
- —
- Total cash needed
- —
Loan-product check · same deal, 3 products live
Conventional
25% down · 7.5% · 30yr
- Down + closing
- —
- Monthly P&I
- —
- Monthly cashflow
- —
- DSCR
- —
- Eligible?
- —
Personal DTI + credit; lowest rate.
DSCR
20% down · 8.5% · 30yr
- Down + closing
- —
- Monthly P&I
- —
- Monthly cashflow
- —
- DSCR
- —
- Eligible?
- —
No personal income docs; deal must DSCR.
Hard money
10% down · 12.0% · 12mo
- Down + closing
- —
- Monthly P&I
- —
- Monthly cashflow
- —
- DSCR
- —
- Eligible?
- —
Short-term bridge; refi at stabilization.
Rent comps 9 comps
| Address | Beds | Baths | Sqft | Rent | $/sqft | DOM | Units | Dist |
|---|---|---|---|---|---|---|---|---|
| 11601 NW 111th St Yukon, OK | 4.0 | 3.0 | 2460 | $2,700 | $1.10 | 2d | 1 | 0.24mi |
| 11244 NW 102nd St Yukon, OK | 3.0 | 2.5 | 1935 | $2,500 | $1.29 | 1d | 1 | 0.50mi |
| 10001 Glover River Dr Yukon, OK | 3.0 | 3.0 | 1812 | $1,950 | $1.08 | 15d | 1 | 0.64mi |
| 10004 Glover River Dr Yukon, OK | 4.0 | 2.0 | 2200 | $2,450 | $1.11 | 23d | 1 | 0.64mi |
| 10005 Blue Wing Trl Yukon, OK | 4.0 | 2.0 | 2022 | $1,840 | $0.91 | 23d | 1 | 0.81mi |
| 11624 NW 96th St Yukon, OK | 4.0 | 2.0 | 1917 | $1,795 | $0.94 | 21d | 1 | 0.94mi |
| 9501 Timberwind Ln Yukon, OK | 3.0 | 2.0 | 1848 | $1,795 | $0.97 | 15d | 1 | 0.96mi |
| 9513 Black Tail Cir Yukon, OK | 4.0 | 2.5 | 1816 | $1,595 | $0.88 | 2d | 1 | 0.96mi |
| 9513 Black Tail Cir Yukon, OK | 4.0 | 2.5 | 1816 | $1,595 | $0.88 | 3d | 1 | 0.96mi |
HOA detail
- Monthly dues
- $25 · $300/yr
Listing history 17 events
-
2026-06-18days on market $265,000 Active 45 DOM
-
2026-06-17days on market $265,000 Active 44 DOM
-
2026-06-16days on market $265,000 Active 43 DOM
-
2026-06-15days on market $265,000 Active 42 DOM
-
2026-06-13days on market $265,000 Active 40 DOM
-
2026-06-13days on market $265,000 Active 39 DOM
-
2026-06-09days on market $265,000 Active 36 DOM
-
2026-06-08days on market $265,000 Active 35 DOM
-
2026-06-07days on market $265,000 Active 34 DOM
-
2026-06-05days on market $265,000 Active 31 DOM
-
2026-06-03days on market $265,000 Active 30 DOM
-
2026-06-02days on market $265,000 Active 29 DOM
-
2026-06-01days on market $265,000 Active 28 DOM
-
2026-05-31days on market $265,000 Active 27 DOM
-
2026-05-09status Active
-
2026-04-26status Pending
-
2026-04-22$275,000 Active
ⓘ Source: listings_history table (triggers on properties + properties_extension) + one-shot
backfill from property_details.listing_events for pre-trigger history.
Tax reassessment forecast OK · Resets to sale price
- Current annual tax
- $3,056 · $255/mo
- Projected year-2 tax
- $3,056 · $255/mo
- Expected delta
- $0/yr ($0/mo · 0.0%)
ⓘ Screening estimate from a state-policy table — verify with the county assessor before closing.
Climate risk First Street
- Flood 1/10 Low FEMA zone X (unshaded) · 0% chance over 30 yrs
- Wildfire 4/10 Moderate
- Heat 6/10 Major 7 d/yr ≥107°F today · 20 d/yr by 30 yrs out
- Wind 3/10 Moderate 4% chance of damaging wind over 30 yrs
- Air quality 1/10 Low 0 unhealthy d/yr today · 0 by 30 yrs out
Nearby sold comps map
Loading sold comps map…
Walkable amenities ~0.75 mi
Loading nearby amenities…
Taxation est. · year 1
- Rental income
- $27,647
- − Mortgage interest
- −$14,844
- − Property taxes
- −$3,056
- − Insurance
- −$1,325
- − Repairs & maintenance
- −$2,212
- − Management
- −$2,212
- − HOA
- −$300
- − Depreciation
- −$7,709
- Taxable loss
- −$4,011
- Est. tax savings @ 24.0%
- +$963
- After-tax cash flow
- $1,446/yr
For passive investors: Depreciation is non-cash, so a rental often shows a tax loss while cash-flowing — sheltering income. Rental losses are passive: they offset passive income freely, and up to $25,000/yr can offset ordinary (W-2) income if you actively participate and your MAGI is under $100k (phasing out to $0 by $150k); unused losses carry forward. On sale, claimed depreciation is recaptured at up to 25%, and gains may owe capital-gains tax (a 1031 exchange can defer both). Figures are a year-1 estimate at your 24.0% rate — not tax advice; consult a CPA.
Schools (NCES district)
- District
- Yukon
- NCES district ID
- 4033480
- Math proficiency
- 30% ▼ -16.00%
- Reading proficiency
- 32% ▼ -10.00%
- Median HH income
- $63,741
- Composite
- 28.35/100
- National rank
- #6776
- State rank
- #47 of 270 in OK
Livability — Oklahoma City
- Score
- 80/100
- State rank
- #3
- US rank
- #1635
Category grades
Schools grade is shown separately in the Schools card above.
Census & demographics
- Census place
- Oklahoma City, OK
- County
- Canadian County · 154,341 people
- City population
- 498,656
- Metro
- Oklahoma City, OK
- Population (ZIP)
- 91,014
- Household income
- $88,030
- Rent vs Own
- Severe rent burden
- 1838.0
Population outlook (Canadian County) Hauer SSP2
- Today (2025)
- 174,062 people
- By 2030
- 195,170 · +12.1%
- By 2040
- 239,293 · +37.5%
- By 2050
- 285,457 · +64.0%
- By 2075
- 403,766 · +132.0%
- By 2100
- 498,766 · +186.5%
Race, ethnicity, and origin ACS 2023
- Neighborhood character
- Predominantly White (73%)
- Race & ethnicity
- White 73% Two or more races 11% Hispanic / Latino 10% Black 3% Asian 3% Native American 3%
- Hispanic origin (detail)
- Mexican 7%
- Common ancestry
- Italian 2% Slovak 1% Portuguese 1%
- Foreign-born
- 5% · Canada, Vietnam
- Languages at home
- 91% English-only · Spanish 5% Vietnamese 2% Other Asian/Pacific 1%
Political lean MEDSL · Canadian
- 2024 margin
- Solid R (+40.4) · D 28.8% · R 69.2% · Other 2.0%
- 2008→2024 swing
- +11.9pp toward D · 2008: -52.2pp · 2024: -40.4pp
- All cycles
- 2024: R+40.4 2020: R+43.3 2016: R+51.2 2012: R+54.4 2008: R+52.2
Not yet ingested
- Civics
- —
Market trends
- HPI YoY
- ▼ -206.04%
- Current HPI
- 244.6836
- Rent YoY
- ▲ 1.19%
- Metro
- Oklahoma City, OK
- State GDP YoY
- ▲ 1.55%
- F500 in state
- 6
Industry mix (Fortune 500 HQ in OK)
| Industry | F500 HQs | Revenue |
|---|---|---|
| Energy | 3 | $48B |
|
||
Price history
3 events — show timeline
- 2026-05-09 Relisted — MLSOK
- 2026-04-26 Pending — MLSOK
- 2026-04-22 Listed $275,000 MLSOK
Property tax history
+3.9%/yrLatest (2025): $3,056 · +5.2% YoY. Source: county tax records.
Cash-flow waterfall
monthlySold comps — $/sqft
last 12 mo · ≤1 miLoading sold comps…