 15-Plex
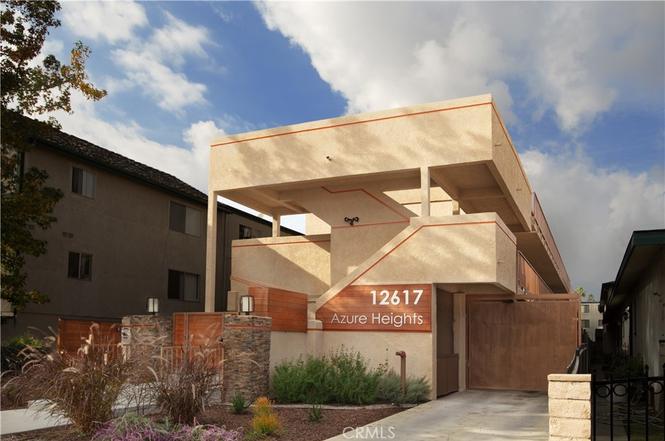
12617 Eucalyptus Ave · Hawthorne, CA
Flood risk 1/10 · Minimal
- FEMA flood zone
- X (unshaded)
- Chance of flooding over 30 yrs
- 0.0%
- Est. flood insurance / yr
- $507 – $1,088
Fire risk 1/10 · Minimal
- Est. fire insurance / yr
- $659 – $1,223
Heat risk 5/10 · Moderate
- Hot days now (above 85°F)
- 7 days/yr
- Hot days in 30 yrs
- 20 days/yr
Wind risk 1/10 · Minimal
- Chance of severe wind over 30 yrs
- —
Air-quality risk 4/10 · Minor
- Unhealthy air days now
- 5 days/yr
- Unhealthy air days in 30 yrs
- 6 days/yr
Risk factors via First Street. Map © Google.
Why this score? — see what drove the C grade
The composite is a weighted blend of 9 inputs, each scored 0–100. Each bar is that input's sub-score; the figure is the points it added to the 100-point composite (weight × sub-score).
- Cash flow +24.9/30.0
- DSCR +8.1/10.0
- ARV discount +7.5/15.0
- 1% rule +6.3/10.0
- Schools +3.8/10.0
- Rent growth +3.0/5.0
- Livability +3.0/5.0
- Condition / age +2.5/5.0
- Appreciation +0.0/10.0
$3,450,000
🖨 Deal sheet 📄 Offer letter ✓ Due diligence
Multi-family units
County records classify this as Multi-Family (5+ Unit). Listing-text estimate: 15 units. confirmed
5+ unit building — per-unit beds/baths from public records are typically unavailable; the breakdown below (if shown) is an estimate from the listing text.
Listing remarks
Presenting “Azure Heights”, an investment gem in the “Hub of the South Bay”. This 1986 built fully gated 15-unit multifamily property has undergone significant capital improvements within the last year, including a roof replacement, fire alarm panel replacement, and electrical main & sub panel replacements. The professionally managed property consists of one large townhouse-style 3bed 1.5 bath unit, fourteen 1bed 1 bath units, a common area laundry room, and 24 covered carport parking spaces. There is ample upside to income growth, especially within the high-demand Hawthorne rental market, making it an ideal fit for investors.
Key facts
- Roof replacement
- Capital improvements
- Fully gated
Tags
Property features AI
Finance
- Other: Property contains 15 total units; Common walls with adjacent units (2+ common walls); Lot described as 0–1 unit/acre (assessor data); Zoning: HAR3YY; Access via city streets; One building on the parcel
- Financial info: Total actual rent reported for the property; Gross scheduled income and gross income reported; Gross operating income and net operating income reported; Operating expenses and detailed expense line items (insurance, water/sewer, trash, maintenance, security, pest control, gardener, fuel); Other income includes parking and laundry income; Reserve listed as other expense; Vacancy allowance and operating expense percent provided
- HOA & community: Community apartment ownership
Exterior
- Parking: Assigned parking; Carport parking with 24 spaces; Controlled entrance; Parking generates additional income
- Security: Gated community; Fire sprinklers and detection systems
- Utilities: Public sewer; District/public water; Natural gas connected; Electricity connected; Water connected; Separate meters: 1 water meter, 16 gas meters, 17 electric meters
- Home design: Community apartment (attached property); Faces east; Three total stories; Entry level 1
- Construction: Composition roof; Concrete slab foundation; One building; Built year per assessor
- Exterior features: No pool; Street lighting nearby; Sidewalks
Interior
- Kitchen: Kitchens in each unit (standard apartment kitchens)
- Bedrooms: Multiple 1-bedroom units (see unit breakdown)
- Bathrooms: Each unit has one full bathroom
- Heating & cooling: Forced air heating; Wall heaters
- Interior features: Three or more levels; Ground-level entry; Fire sprinklers; Carbon monoxide detectors; Fire and smoke detection system; Smoke detectors; Gated community
- Laundry & utility: On-site laundry area; Laundry equipment is leased; Tenant pays gas and electricity
Neighborhood map
What this means for you Summary
Snapshot
- This is a 15 × 3.0-bed/1.5-bath units multifamily listed at $3.45M.
Deal economics
- At list price, monthly cash flow is $7k ($89k/yr) — positive. Per door: $495/mo.
- The deal already cash-flows at list — no discount required.
- Meets the 1% rule at list price ($39k rent vs $3.45M).
- Recommended offer: $3.14M (9.0% below list) — sets the bar for market timing.
- Cap rate 8.9% vs local median 2.0% in Hawthorne — top-decile yield for the area; either an underpriced asset or a hidden risk that comps aren't pricing in. Stress-test before assuming the spread holds.
Location & tenants
- Location reads 60/100 on livability (#597 in CA) — a middle-class / working-renter tenant base. Strengths: commute A+, housing B; Watch: crime F, cost of living F, health & safety F.
- Hawthorne (suburban): math 38% / reading 47% proficiency, ranked #673 of 1,400 in CA (top 48%) — families likely to look elsewhere, expect single-tenant / working-renter base with shorter leases; 78% free/reduced lunch — lower-income household profile, screen leases tightly.
- Market conditions: Rents rising (+1.9%/yr); 96 active listings in the ZIP; solid renter incomes; 19,697 units permitted in Los Angeles County in 2024 (9,426 in 5+ unit buildings).
- At $38,878/mo this rent would consume 596% of the median local household income ($78k/yr) (locally 6620% of renters already pay >50% of income on rent) — very limited rent-growth headroom before tenants either downsize or default.
Forward outlook
- Local home prices are declining (-3.0%/yr); year-one equity from $24k of loan paydown is wiped out by about $104k of value loss. Plan a longer hold.
- Los Angeles County population projected at +9% by 2050 — modest demand growth; plan on rents tracking national, not racing it.
Negotiation context
- It's been on market 106 days — a 9% lower offer ($3.14M) is reasonable based on typical stale-listing flexibility.
- 6 sale attempts since 15y ago; this cycle's ask is 183900% above the opening price — seller raised mid-cycle; expect resistance to lowballs.
- Current owner paid $2.90M; 19% above their basis — modest negotiation headroom, anchor on the comps not their cost.
Risks & watch-outs
- Climate carrying-cost: extreme-heat days projected 7→20/yr by 2055 (HVAC capex compounding) — expect insurance premiums to compound above CPI over the hold.
Questions for the listing agent
- It's been on market 106 days. Have you received any prior offers? Is the seller open to a 9% concession, seller financing, or rate buy-down credit?
- Can we see the unit-by-unit rent roll, current vacancy, and any below-market leases? What's the average tenancy length?
- What capital expenditures (roof, boiler, parking lot, exteriors) have been made in the last 5 years, and what's planned in the next 2?
- Why hasn't it sold? Are there any deal-killer items the seller is aware of (foundation, flood, title, zoning, code violations)?
- Is there a deadline driving the sale (1031 exchange, divorce, estate, relocation)? That informs how much negotiation room exists.
- Crime grade is F in this area — have there been break-ins, vandalism, or insurance claims at this property in the last 3 years? What carrier currently insures it and at what premium?
- What's the average days-on-market for RENTAL listings here right now (not sales)? A rising rental-DOM trend means longer vacancies and softer asking-rent achievability than the comps imply.
- What's the recent tenant-quality profile in this submarket — average credit score on applications, eviction rate, late-payment / NSF rate, and stable-employment percentage? A property-management company in the area should have these aggregated.
- How much new apartment / multifamily construction is in the pipeline within 1–3 miles? Heavy new supply (>2% of stock underway) typically softens rents 12–24 months out; light construction supports rent growth.
Investment metrics
- 1% rule
- 1.13% ✓
- Cap rate
- 8.87%
- Cash-on-cash
- 9.22%
- DSCR
- 1.41
- GRM
- 7.4
CMA / ARV
No comps found within radius.
Projected returns pro-forma
-3.0% appreciation · 1.89% rent growth · sell at horizon
- IRR
- -3.6%
- Equity multiple
- 0.87×
- Total profit
- $-129,222
- Equity at exit
- $514,406
- IRR
- 4.8%
- Equity multiple
- 1.34×
- Total profit
- $324,606
- Equity at exit
- $298,293
Cash invested: $966,000 (down + closing). Projections, not guarantees.
Landlord ↔ Tenant lean methodology
- Overall (STATE)
- 18 Strongly Tenant-Friendly
- State California
- 18 Strongly Tenant-Friendly · D+13
- County
- — inherits STATE
- City
- — inherits STATE
ZIP-level market 90250
- Rents YoY
- 1.9%
- Active inventory
- 96
- Price-to-rent
- 110.9×
Monthly cashflow live
- Estimated rent
- $38,878 high interval (Pro) →
- Mortgage (P&I)
- −$18,092
- Tax from tax record
- −$3,765 /mo · $45,178/yr
- Insurance
- −$1,438
- HOA
- −$0
- Vacancy / Maint / Mgmt
- −$8,164
- Net cashflow
- $7,419
Break-even live
15-unit breakdown (identical units grouped — click to expand)
| Units | Beds | Baths | Est. rent |
|---|---|---|---|
| 15× units | 3.0 | 1.5 | $38,880 |
| #1 | 3.0 | 1.5 | $2,592 |
| #2 | 3.0 | 1.5 | $2,592 |
| #3 | 3.0 | 1.5 | $2,592 |
| #4 | 3.0 | 1.5 | $2,592 |
| #5 | 3.0 | 1.5 | $2,592 |
| #6 | 3.0 | 1.5 | $2,592 |
| #7 | 3.0 | 1.5 | $2,592 |
| #8 | 3.0 | 1.5 | $2,592 |
| #9 | 3.0 | 1.5 | $2,592 |
| #10 | 3.0 | 1.5 | $2,592 |
| #11 | 3.0 | 1.5 | $2,592 |
| #12 | 3.0 | 1.5 | $2,592 |
| #13 | 3.0 | 1.5 | $2,592 |
| #14 | 3.0 | 1.5 | $2,592 |
| #15 | 3.0 | 1.5 | $2,592 |
| Total (15 units) | $38,878 | ||
UW: 25.0% down · 7.5% · 30yr · 1.5% tax · 5.0% vac · 8.0% maint · 8.0% mgmt
Financing live
Cash to close
- Down payment
- $862,500
- Closing costs
- $103,500
- Reserves months
- —
- Total cash needed
- —
Loan-product check · same deal, 3 products live
Conventional
25% down · 7.5% · 30yr
- Down + closing
- —
- Monthly P&I
- —
- Monthly cashflow
- —
- DSCR
- —
- Eligible?
- —
Personal DTI + credit; lowest rate.
DSCR
20% down · 8.5% · 30yr
- Down + closing
- —
- Monthly P&I
- —
- Monthly cashflow
- —
- DSCR
- —
- Eligible?
- —
No personal income docs; deal must DSCR.
Hard money
10% down · 12.0% · 12mo
- Down + closing
- —
- Monthly P&I
- —
- Monthly cashflow
- —
- DSCR
- —
- Eligible?
- —
Short-term bridge; refi at stabilization.
Listing history 28 events
-
2026-06-18days on market $3,450,000 Active 106 DOM
-
2026-06-17days on market $3,450,000 Active 105 DOM
-
2026-06-16days on market $3,450,000 Active 104 DOM
-
2026-06-15days on market $3,450,000 Active 103 DOM
-
2026-06-13days on market $3,450,000 Active 101 DOM
-
2026-06-13days on market $3,450,000 Active 100 DOM
-
2026-06-09days on market $3,450,000 Active 97 DOM
-
2026-06-08pricedays on market $3,450,000 Active 96 DOM
-
2026-06-07days on market $3,550,000 Active 95 DOM
-
2026-06-04days on market $3,550,000 Active 92 DOM
-
2026-06-03days on market $3,550,000 Active 91 DOM
-
2026-06-02pricedays on market $3,550,000 Active 90 DOM
-
2026-06-01days on market $3,700,000 Active 89 DOM
-
2026-05-31days on market $3,700,000 Active 88 DOM
-
2026-05-04historical Active Under Contract
-
2026-04-12$1,875
-
2026-04-09status Active
-
2026-04-01historical Active Under Contract
-
2026-03-25price $3,700,000
-
2026-03-04$3,800,000 Active
-
2026-02-20historical $1,875
-
2026-02-01$1,875
-
2026-01-27historical $1,875
-
2026-01-14$1,875
-
2016-08-24soldstatus $2,900,000
-
2015-08-14soldstatus $2,000,000
-
2012-02-28historical
-
2011-10-04$1,850,000 Active
ⓘ Source: listings_history table (triggers on properties + properties_extension) + one-shot
backfill from property_details.listing_events for pre-trigger history.
Tax reassessment forecast CA · Resets to sale price
- Current annual tax
- $45,178 · $3,765/mo
- Projected year-2 tax
- $45,178 · $3,765/mo
- Expected delta
- $0/yr ($0/mo · 0.0%)
ⓘ Screening estimate from a state-policy table — verify with the county assessor before closing.
Climate risk First Street
- Flood 1/10 Low FEMA zone X (unshaded) · 0% chance over 30 yrs
- Wildfire 1/10 Low
- Heat 5/10 Major 7 d/yr ≥85°F today · 20 d/yr by 30 yrs out
- Wind 1/10 Low
- Air quality 4/10 Moderate 5 unhealthy d/yr today · 6 by 30 yrs out
Nearby sold comps map
Loading sold comps map…
Walkable amenities ~0.75 mi
Loading nearby amenities…
Taxation est. · year 1
- Rental income
- $466,536
- − Mortgage interest
- −$193,254
- − Property taxes
- −$45,178
- − Insurance
- −$17,250
- − Repairs & maintenance
- −$37,323
- − Management
- −$37,323
- − Depreciation
- −$100,364
- Taxable income
- $35,845
- Est. tax owed @ 24.0%
- −$8,603
- After-tax cash flow
- $80,426/yr
For passive investors: Depreciation is non-cash, so a rental often shows a tax loss while cash-flowing — sheltering income. Rental losses are passive: they offset passive income freely, and up to $25,000/yr can offset ordinary (W-2) income if you actively participate and your MAGI is under $100k (phasing out to $0 by $150k); unused losses carry forward. On sale, claimed depreciation is recaptured at up to 25%, and gains may owe capital-gains tax (a 1031 exchange can defer both). Figures are a year-1 estimate at your 24.0% rate — not tax advice; consult a CPA.
Schools (NCES district)
- District
- Hawthorne
- NCES district ID
- 0616680
- Math proficiency
- 38% ▲ 1.00%
- Reading proficiency
- 47% ▲ 1.00%
- Median HH income
- $42,657
- Composite
- 38.17/100
- National rank
- #8589
- State rank
- #673 of 1400 in CA
Livability — Hawthorne
- Score
- 60/100
- State rank
- #597
- US rank
- #19278
Category grades
Schools grade is shown separately in the Schools card above.
Census & demographics
- Census place
- Hawthorne, CA
- County
- Los Angeles County · 9,444,647 people
- City population
- 93,826
- Metro
- Los Angeles-Long Beach-Anaheim, CA
- Population (ZIP)
- 93,826
- Household income
- $78,331
- Rent vs Own
- Severe rent burden
- 6620.0
Population outlook (Los Angeles County) Hauer SSP2
- Today (2025)
- 10,940,515 people
- By 2030
- 11,256,481 · +2.9%
- By 2040
- 11,729,929 · +7.2%
- By 2050
- 11,948,407 · +9.2%
- By 2075
- 11,818,114 · +8.0%
- By 2100
- 10,842,928 · -0.9%
Race, ethnicity, and origin ACS 2023
- Neighborhood character
- Diverse neighborhood (Simpson 0.63)
- Race & ethnicity
- Hispanic / Latino 55% Black 23% Two or more races 20% White 11% Asian 7% Native American 2%
- Hispanic origin (detail)
- Mexican 39% Puerto Rican 1%
- Common ancestry
- Lithuanian 1% Romanian 1%
- Foreign-born
- 33% · Canada, Vietnam, China
- Languages at home
- 44% English-only · Spanish 46% Other Indo-European 2% Tagalog/Filipino 1%
Political lean MEDSL · Los Angeles
- 2024 margin
- Solid D (+32.9) · D 64.8% · R 31.9% · Other 3.3%
- 2008→2024 swing
- -7.4pp toward R · 2008: 40.4pp · 2024: 32.9pp
- All cycles
- 2024: D+32.9 2020: D+44.2 2016: D+48.0 2012: D+40.0 2008: D+40.4
Not yet ingested
- Civics
- —
Market trends
- HPI YoY
- ▼ -948.55%
- Current HPI
- 409.3796
- Rent YoY
- ▲ 1.89%
- Metro
- Los Angeles-Long Beach-Anaheim, CA
- State GDP YoY
- ▲ 3.21%
- F500 in state
- 116
Industry mix (Fortune 500 HQ in CA)
| Industry | F500 HQs | Revenue |
|---|---|---|
| Technology | 27 | $1,492B |
|
||
| Financial Services | 3 | $174B |
|
||
| Retail | 3 | $44B |
|
||
| Insurance | 3 | $26B |
|
||
| Media / Entertainment | 2 | $115B |
|
||
| Pharmaceuticals / Biotech | 2 | $62B |
|
||
Price history
-99.9% since first listed14 events — show timeline
- 2026-05-04 Contingent — CRMLS
- 2026-04-12 Listed for Rent $1,875 RENTALBEAST
- 2026-04-09 Relisted — CRMLS
- 2026-04-01 Contingent — CRMLS
- 2026-03-25 Price Changed $3,700,000 CRMLS
- 2026-03-04 Listed $3,800,000 CRMLS
- 2026-02-20 Rental Removed $1,875 RENTALBEAST
- 2026-02-01 Listed for Rent $1,875 RENTALBEAST
- 2026-01-27 Rental Removed $1,875 RENTALBEAST
- 2026-01-14 Listed for Rent $1,875 RENTALBEAST
- 2016-08-24 Sold (Public Records) $2,900,000 Public Records
- 2015-08-14 Sold (Public Records) $2,000,000 Public Records
- 2012-02-28 Listing Removed — CRMLS
- 2011-10-04 Listed $1,850,000 CRMLS
Property tax history
+6.9%/yrLatest (2025): $45,178 · +4.1% YoY. Source: county tax records.
Cash-flow waterfall
monthlySold comps — $/sqft
last 12 mo · ≤1 miLoading sold comps…