 🏷️ Likely Rental
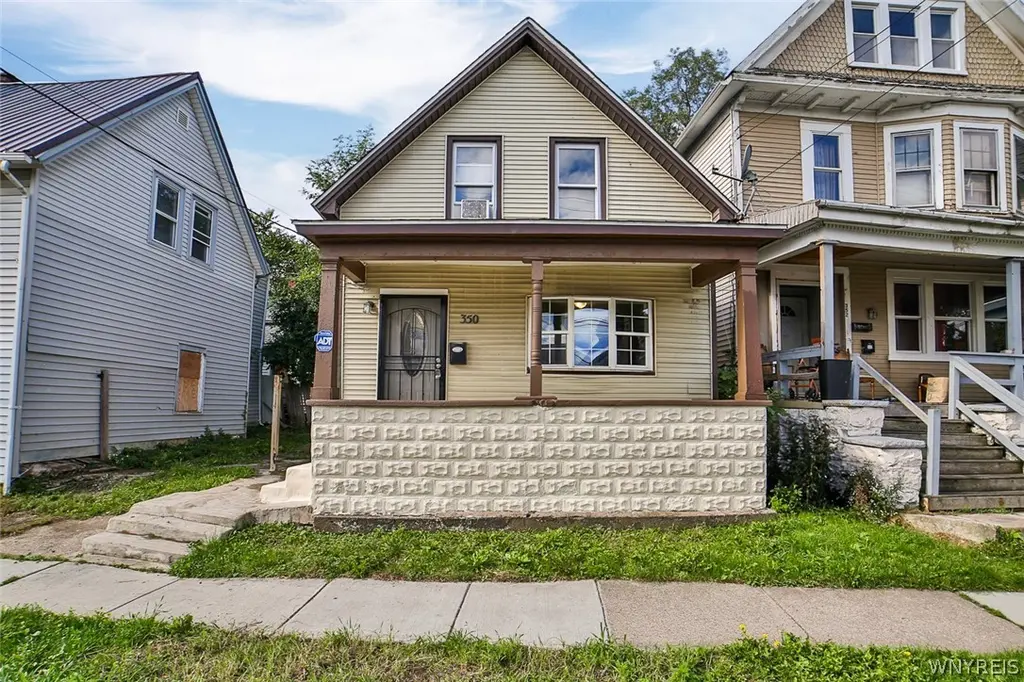
350 Herkimer St · Buffalo, NY
Flood risk 1/10 · Minimal
- FEMA flood zone
- X (unshaded)
- Chance of flooding over 30 yrs
- 0.0%
- Est. flood insurance / yr
- $473 – $860
Fire risk 1/10 · Minimal
- Est. fire insurance / yr
- $691 – $1,283
Heat risk 3/10 · Minor
- Hot days now (above 92°F)
- 7 days/yr
- Hot days in 30 yrs
- 14 days/yr
Wind risk 1/10 · Minimal
- Chance of severe wind over 30 yrs
- —
Air-quality risk 4/10 · Minor
- Unhealthy air days now
- 4 days/yr
- Unhealthy air days in 30 yrs
- 9 days/yr
Risk factors via First Street. Map © Google.
Why this score? — see what drove the A- grade
The composite is a weighted blend of 9 inputs, each scored 0–100. Each bar is that input's sub-score; the figure is the points it added to the 100-point composite (weight × sub-score).
- Cash flow +30.0/30.0
- ARV discount +15.0/15.0
- DSCR +10.0/10.0
- Appreciation +8.8/10.0
- 1% rule +8.7/10.0
- Livability +3.9/5.0
- Schools +3.3/10.0
- Condition / age +2.5/5.0
- Rent growth +2.4/5.0
$115,000
🖨 Deal sheet 📄 Offer letter ✓ Due diligence
Listing remarks MLS
OWNER HOLD OPPORTUNITY with 10 %down! Very affordable single family home with many updates! Own this home and pay less than monthly rent! This 3 bedroom, 1 bath home was freshly painted February 2026. Kitchen, furnace, bathroom and roof were updated in 2019. One bedroom on the first floor and two bedrooms on the second floor. Kitchen with modern cabinets, pantry, refrigerator and stove. First floor laundry with washer and dryer. All appliances included too! Front porch to relax on during those nice days. Minimal grass to cut in the front, no back yard. Investors - a perfect addition to your investment portfolio Last rent was $1250/month - making this perfect for a DSCR Loan.
Key facts
- First floor laundry
- Front porch
- 1,099 sq ft lot
Tags
Neighborhood map
What this means for you Summary
Snapshot
- This is a 3-bed/1.0-bath single-family listed at $115k.
Deal economics
- At list price, monthly cash flow is $574 ($7k/yr) — positive.
- The deal already cash-flows at list — no discount required.
- Meets the 1% rule at list price ($2k rent vs $115k).
- Recommended offer: $105k (9.0% below list) — sets the bar for market timing.
- Cap rate 12.3% vs local median 8.0% in Buffalo — top-decile yield for the area; either an underpriced asset or a hidden risk that comps aren't pricing in. Stress-test before assuming the spread holds.
Location & tenants
- Location reads 77/100 on livability (#195 in NY, #3,011 nationally) — a middle-class / working-renter tenant base. Strengths: commute A+, housing A+, health & safety A+; Watch: crime F, employment D-.
- Buffalo City School District (urban): math 41% / reading 40% proficiency, ranked #535 of 590 in NY (top 91%) — families likely to look elsewhere, expect single-tenant / working-renter base with shorter leases; 75% free/reduced lunch — lower-income household profile, screen leases tightly.
- Market conditions: Rents soft (-0.5%/yr); 137 active listings in the ZIP; 40 comparable units currently listed for rent nearby; rentals at typical pace (median 24d on market — plan ~3-4 weeks tenant-placement turnaround); 1,244 units permitted in Erie County in 2024 (563 in 5+ unit buildings).
- This rent runs 35% of the median local income ($54k/yr) — at the standard rent-burdened threshold; future hikes will face affordability resistance.
Forward outlook
- In year one you build about $9k of equity ($795 loan paydown + $9k appreciation (7.5% local appreciation)).
- At projected returns (7.5% appreciation + 0.0% rent growth), your $32k cash investment doubles in ~2 years — after that, you're playing with house money.
- By year 4, paydown + projected appreciation supports a ~$33k cash-out refi (75% LTV) — recoverable capital for the next deal without selling this one.
Negotiation context
- It's been on market 109 days — a 9% lower offer ($105k) is reasonable based on typical stale-listing flexibility.
- 5 sale attempts since 7y ago with the ask held roughly flat each time — persistent listings suggest the price (not the market) is what's stuck; bring a comps-based counter.
Risks & watch-outs
- Watch-outs: built in 1900 — expect roof / HVAC / electrical / plumbing capex.
Questions for the listing agent
- It's been on market 109 days. Have you received any prior offers? Is the seller open to a 9% concession, seller financing, or rate buy-down credit?
- Built in 1900 — when were the roof, HVAC, electrical panel, plumbing, and water heater last replaced?
- Why hasn't it sold? Are there any deal-killer items the seller is aware of (foundation, flood, title, zoning, code violations)?
- Is there a deadline driving the sale (1031 exchange, divorce, estate, relocation)? That informs how much negotiation room exists.
- Crime grade is F in this area — have there been break-ins, vandalism, or insurance claims at this property in the last 3 years? What carrier currently insures it and at what premium?
- What's the average days-on-market for RENTAL listings here right now (not sales)? A rising rental-DOM trend means longer vacancies and softer asking-rent achievability than the comps imply.
- What's the recent tenant-quality profile in this submarket — average credit score on applications, eviction rate, late-payment / NSF rate, and stable-employment percentage? A property-management company in the area should have these aggregated.
- How much new for-sale + rental construction is in the pipeline within 1–3 miles? Heavy new supply typically softens prices + rents 12–24 months out; constrained supply supports both.
Investment metrics
- 1% rule
- 1.37% ✓
- Cap rate
- 12.28%
- Cash-on-cash
- 21.39%
- DSCR
- 1.95
- GRM
- 6.1
CMA / ARV
- ARV (median comp)
- $196,963
- List price
- $115,000
- Delta
- -41.61%
- Verdict
- UNDERPRICED
- Comps
- 20 within 1.0 mi
Show comp detail 7 sales within ~0.75 mi
| Address | Dist | Beds/Ba | Sqft | Sold | Price | $/sf | Match |
|---|---|---|---|---|---|---|---|
| 23 Pooley Pl | 0.30mi | 3/1.0 | 1,044 (+8%) | 0mo | $144,900 | $139 | 73 |
| 25 Lafayette Ave | 0.29mi | 3/2.0 | 1,009 (+4%) | 5mo | $110,000 | $109 | 71 |
| 1069 West Ave | 0.28mi | 3/1.0 | 1,040 (+7%) | 11mo | $150,000 | $144 | 65 |
| 153 Garner Ave | 0.26mi | 2/1.0 (-1) | 864 (-11%) | 12mo | $70,653 | $82 | 55 |
| 123 Hawley St | 0.63mi | 3/1.0 | 930 (-4%) | 13mo | $191,000 | $205 | 53 |
| 74 Baynes St | 0.48mi | 4/2.0 (+1) | 1,075 (+11%) | 4mo | $195,925 | $182 | 48 |
| 11 S Putnam St | 0.62mi | 2/2.5 (-1) | 1,073 (+11%) | 22mo | $277,000 | $258 | 24 |
Match score weights: distance 35% · size 25% · config 20% · recency 20%. Top-matched comps best support the ARV.
Projected returns pro-forma
7.51% appreciation · 0.0% rent growth · sell at horizon
- IRR
- 34.4%
- Equity multiple
- 3.35×
- Total profit
- $75,691
- Equity at exit
- $83,579
- IRR
- 29.8%
- Equity multiple
- 6.71×
- Total profit
- $183,856
- Equity at exit
- $162,414
Cash invested: $32,200 (down + closing). Projections, not guarantees.
Landlord ↔ Tenant lean methodology
- Overall (STATE)
- 15 Strongly Tenant-Friendly
- State New York
- 15 Strongly Tenant-Friendly · D+10
- County
- — inherits STATE
- City
- — inherits STATE
ZIP-level market 14213
- Home prices YoY
- 1.7%
- Rents YoY
- -0.5%
- Active inventory
- 137
- Price-to-rent
- 6.1×
Monthly cashflow live
- Estimated rent
- $1,576 high interval (Pro) →
- Mortgage (P&I)
- −$603
- Tax from tax record
- −$21 /mo · $247/yr
- Insurance
- −$48
- HOA
- −$0
- Vacancy / Maint / Mgmt
- −$331
- Net cashflow
- $574
Break-even live
UW: 25.0% down · 7.5% · 30yr · 1.5% tax · 5.0% vac · 8.0% maint · 8.0% mgmt
Financing live
Cash to close
- Down payment
- $28,750
- Closing costs
- $3,450
- Reserves months
- —
- Total cash needed
- —
Loan-product check · same deal, 3 products live
Conventional
25% down · 7.5% · 30yr
- Down + closing
- —
- Monthly P&I
- —
- Monthly cashflow
- —
- DSCR
- —
- Eligible?
- —
Personal DTI + credit; lowest rate.
DSCR
20% down · 8.5% · 30yr
- Down + closing
- —
- Monthly P&I
- —
- Monthly cashflow
- —
- DSCR
- —
- Eligible?
- —
No personal income docs; deal must DSCR.
Hard money
10% down · 12.0% · 12mo
- Down + closing
- —
- Monthly P&I
- —
- Monthly cashflow
- —
- DSCR
- —
- Eligible?
- —
Short-term bridge; refi at stabilization.
Rent comps 40 comps
| Address | Beds | Baths | Sqft | Rent | $/sqft | DOM | Units | Dist |
|---|---|---|---|---|---|---|---|---|
| 163 W Delavan Ave Buffalo, NY | 3.0 | 1.0 | 1000 | $1,500 | $1.50 | 23d | 1 | 0.03mi |
| 196 Auburn Ave Buffalo, NY | 3.0 | 1.0 | 1000 | $1,300 | $1.30 | 44d | 1 | 0.23mi |
| 257 Lafayette Ave Unit 317 Buffalo, NY | 2.0 | 1.0 | 897 | $1,400 | $1.56 | 23d | 1 | 0.27mi |
| 257 Lafayette Ave Apt 319 Buffalo, NY | 2.0 | 1.0 | 900 | $1,395 | $1.55 | 23d | 1 | 0.28mi |
| 1485 Niagara St Buffalo, NY | 1.0–2.0 | 1.0 | 925 | $2,174 | $2.35 | 1d | 1 | 0.31mi |
| 309 Bird Ave Unit 1 Buffalo, NY | 3.0 | 1.0 | 1100 | $2,200 | $2.00 | 44d | 1 | 0.38mi |
| 100 Forest Ave Buffalo, NY | 2.0–4.0 | 2.0–4.0 | 1304 | $1,600 | $1.23 | 1d | 14 | 0.47mi |
| 46 Hawley St #1 Buffalo, NY | 2.0 | 1.0 | 900 | $1,300 | $1.44 | 44d | 1 | 0.50mi |
| 67 Herkimer St Buffalo, NY | 3.0 | 1.0 | 1000 | $1,300 | $1.30 | 14d | 1 | 0.51mi |
| 478 Breckenridge St Buffalo, NY | 3.0 | 1.0 | 1100 | $1,575 | $1.43 | 44d | 1 | 0.57mi |
| 411 W Ferry St Buffalo, NY | 2.0 | 1.0 | 900 | $1,100 | $1.22 | 14d | 1 | 0.58mi |
| 77 California St Unit 1 Buffalo, NY | 2.0 | 1.0 | 800 | $1,100 | $1.38 | 44d | 1 | 0.60mi |
| 57 Abbottsford Pl Buffalo, NY | 2.0 | 1.0 | 1000 | $1,550 | $1.55 | 23d | 1 | 0.63mi |
| 865 Richmond Ave Unit Rear Buffalo, NY | 2.0 | 1.0 | 850 | $1,100 | $1.29 | 44d | 1 | 0.72mi |
| 484 Ashland Ave Unit 9 Buffalo, NY | 2.0 | 1.0 | 800 | $1,250 | $1.56 | 23d | 1 | 0.76mi |
| 460 Rhode Island St Buffalo, NY | 2.0 | 1.0 | 1089 | $1,500 | $1.38 | 14d | 1 | 0.79mi |
| 1015 Elmwood Ave Unit 3 Buffalo, NY | 2.0 | 2.0 | 1000 | $1,400 | $1.40 | 44d | 1 | 0.85mi |
| 664 Auburn Ave Unit 2 Buffalo, NY | 2.0 | 1.0 | 900 | $2,200 | $2.44 | 44d | 1 | 0.89mi |
| 273 Richmond Ave Buffalo, NY | 1.0–2.0 | 1.0–1.5 | 789 | $1,819 | $2.31 | 23d | 1 | 1.01mi |
| 102 17th St Buffalo, NY | 2.0 | 1.0 | 1086 | $1,290 | $1.19 | 23d | 1 | 1.01mi |
| 256 14th St Unit 1 Buffalo, NY | 2.0 | 1.0 | 800 | $1,100 | $1.38 | 14d | 1 | 1.03mi |
| 1920 Niagara St Unit 1 Buffalo, NY | 2.0 | 1.0 | 695 | $999 | $1.44 | 44d | 1 | 1.12mi |
| 346 Bryant St Buffalo, NY | 2.0 | 1.0 | 792 | $1,834 | $2.32 | 3d | 1 | 1.14mi |
| 68 Peter St Buffalo, NY | 2.0 | 1.0 | 900 | $900 | $1.00 | 23d | 1 | 1.23mi |
| 1310 Delaware Ave Buffalo, NY | 2.0 | 1.0 | 684 | $1,275 | $1.86 | 44d | 1 | 1.24mi |
| 1560 Delaware Ave Unit 1 Buffalo, NY | 3.0 | 1.0 | 1000 | $2,800 | $2.80 | 23d | 1 | 1.30mi |
| 31 Norwood Ave Unit 2 Buffalo, NY | 3.0 | 1.0 | 1000 | $1,950 | $1.95 | 12d | 1 | 1.31mi |
| 1040 Delaware Ave Buffalo, NY | 1.0–2.0 | 1.0 | 687 | $1,500 | $2.18 | 3d | 4 | 1.31mi |
| 1165 Delaware Ave Buffalo, NY | 1.0–2.0 | 1.0 | 658 | $1,250 | $1.90 | 44d | 1 | 1.31mi |
| 344 Elmwood Ave Unit 3rd floor Buffalo, NY | 2.0 | 1.0 | 1000 | $1,400 | $1.40 | 23d | 1 | 1.33mi |
| 155 Germain St Apt 1 Buffalo, NY | 2.0 | 1.0 | 1000 | $1,000 | $1.00 | 10d | 1 | 1.36mi |
| 1558 Elmwood Ave Unit 4 Buffalo, NY | 2.0 | 1.0 | 800 | $1,100 | $1.38 | 44d | 1 | 1.39mi |
| 916 Delaware Ave Buffalo, NY | 2.0 | 1.0 | 750 | $1,625 | $2.17 | 3d | 9 | 1.40mi |
| 88 W Utica St Unit 1 Buffalo, NY | 3.0 | 2.0 | 990 | $2,150 | $2.17 | 14d | 1 | 1.41mi |
| 88 W Utica St Unit 1 Buffalo, NY | 3.0 | 2.0 | 990 | $2,150 | $2.17 | 3d | 1 | 1.41mi |
| 72 Reservation St Unit 2 Buffalo, NY | 3.0 | 1.0 | 950 | $1,150 | $1.21 | 23d | 1 | 1.41mi |
| 888 Delaware Ave Buffalo, NY | 2.0 | 1.0–2.0 | 899 | $2,440 | $2.71 | 23d | 1 | 1.43mi |
| 279 North St Buffalo, NY | 1.0–2.0 | 1.0–2.0 | 820 | $2,050 | $2.50 | 44d | 1 | 1.44mi |
| 213 Summer St Unit 3 Buffalo, NY | 2.0 | 1.0 | 1020 | $2,450 | $2.40 | 21d | 1 | 1.45mi |
| 238 Oxford Ave Unit Upper Buffalo, NY | 3.0 | 1.0 | 1100 | $1,600 | $1.45 | 23d | 1 | 1.47mi |
Listing history 30 events
-
2026-06-18days on market $115,000 Active 109 DOM
-
2026-06-17days on market $115,000 Active 108 DOM
-
2026-06-16days on market $115,000 Active 107 DOM
-
2026-06-15days on market $115,000 Active 106 DOM
-
2026-06-13days on market $115,000 Active 104 DOM
-
2026-06-13days on market $115,000 Active 103 DOM
-
2026-06-10days on market $115,000 Active 101 DOM
-
2026-06-09days on market $115,000 Active 100 DOM
-
2026-06-08days on market $115,000 Active 99 DOM
-
2026-06-07days on market $115,000 Active 98 DOM
-
2026-06-03days on market $115,000 Active 94 DOM
-
2026-06-02days on market $115,000 Active 93 DOM
-
2026-06-01days on market $115,000 Active 92 DOM
-
2026-05-31days on market $115,000 Active 91 DOM
-
2026-03-01$115,000 Active 683-char remark
Show marketing remark (683 chars)
OWNER HOLD OPPORTUNITY with 10 %down! Very affordable single family home with many updates! Own this home and pay less than monthly rent! This 3 bedroom, 1 bath home was freshly painted February 2026. Kitchen, furnace, bathroom and roof were updated in 2019. One bedroom on the first floor and two bedrooms on the second floor. Kitchen with modern cabinets, pantry, refrigerator and stove. First floor laundry with washer and dryer. All appliances included too! Front porch to relax on during those nice days. Minimal grass to cut in the front, no back yard. Investors - a perfect addition to your investment portfolio Last rent was $1250/month - making this perfect for a DSCR Loan.
-
2024-12-09historical
-
2024-11-20price $140,000
-
2024-10-02$150,000 Active
-
2022-09-27soldstatus $150,000
-
2022-09-23soldstatus $150,000 Closed Sale or Rented
-
2022-07-02price $150,000
-
2022-07-02status Pending Sale
-
2022-06-30$135,000 Active
-
2020-03-05status Pending Sale
-
2020-03-05historical
-
2019-12-30status Active
-
2019-12-20status Under Contract- Do Not Show
-
2019-12-13$59,999 Active
-
2004-02-17soldstatus $8,500
-
1994-09-23soldstatus $13,400
ⓘ Source: listings_history table (triggers on properties + properties_extension) + one-shot
backfill from property_details.listing_events for pre-trigger history.
Tax reassessment forecast NY · Partial reset (capped growth)
- Current annual tax
- $247 · $21/mo
- Projected year-2 tax
- $1,095 · $91/mo
- Expected delta
- +$848/yr (+$71/mo · 344.1%)
ⓘ Screening estimate from a state-policy table — verify with the county assessor before closing.
Climate risk First Street
- Flood 1/10 Low FEMA zone X (unshaded) · 0% chance over 30 yrs
- Wildfire 1/10 Low
- Heat 3/10 Moderate 7 d/yr ≥92°F today · 14 d/yr by 30 yrs out
- Wind 1/10 Low
- Air quality 4/10 Moderate 4 unhealthy d/yr today · 9 by 30 yrs out
Nearby sold comps map
Loading sold comps map…
Walkable amenities ~0.75 mi
Loading nearby amenities…
Taxation est. · year 1
- Rental income
- $18,918
- − Mortgage interest
- −$6,442
- − Property taxes
- −$247
- − Insurance
- −$575
- − Repairs & maintenance
- −$1,513
- − Management
- −$1,513
- − Depreciation
- −$3,345
- Taxable income
- $5,282
- Est. tax owed @ 24.0%
- −$1,268
- After-tax cash flow
- $5,619/yr
For passive investors: Depreciation is non-cash, so a rental often shows a tax loss while cash-flowing — sheltering income. Rental losses are passive: they offset passive income freely, and up to $25,000/yr can offset ordinary (W-2) income if you actively participate and your MAGI is under $100k (phasing out to $0 by $150k); unused losses carry forward. On sale, claimed depreciation is recaptured at up to 25%, and gains may owe capital-gains tax (a 1031 exchange can defer both). Figures are a year-1 estimate at your 24.0% rate — not tax advice; consult a CPA.
Schools (NCES district)
- District
- Buffalo City School District
- NCES district ID
- 3605850
- Math proficiency
- 41% ▲ 11.00%
- Reading proficiency
- 40% ▲ 7.00%
- Median HH income
- $31,665
- Composite
- 33.17/100
- National rank
- #5544
- State rank
- #535 of 590 in NY
Livability — Buffalo
- Score
- 77/100
- State rank
- #195
- US rank
- #3011
Category grades
Schools grade is shown separately in the Schools card above.
Census & demographics
- Census place
- Buffalo, NY
- County
- Erie County · 714,559 people
- City population
- 440,021
- Metro
- Buffalo-Cheektowaga, NY
- Population (ZIP)
- 24,107
- Household income
- $53,870
- Rent vs Own
- Severe rent burden
- 1501.0
Population outlook (Erie County) Hauer SSP2
- Today (2025)
- 933,037 people
- By 2030
- 935,181 · +0.2%
- By 2040
- 928,531 · -0.5%
- By 2050
- 905,725 · -2.9%
- By 2075
- 834,037 · -10.6%
- By 2100
- 708,033 · -24.1%
Race, ethnicity, and origin ACS 2023
- Neighborhood character
- Highly diverse neighborhood (Simpson 0.70)
- Race & ethnicity
- White 46% Hispanic / Latino 20% Black 18% Asian 12% Two or more races 10%
- Hispanic origin (detail)
- Mexican 1% Puerto Rican 16% Dominican 1%
- Common ancestry
- Romanian 6% Slovak 3% Lithuanian 3%
- Foreign-born
- 16% · Philippines, Canada, India
- Languages at home
- 68% English-only · Spanish 12% Other Asian/Pacific 7% Arabic 3%
Political lean MEDSL · Erie
- 2024 margin
- Lean D (+9.7) · D 54.8% · R 45.2%
- 2008→2024 swing
- -7.9pp toward R · 2008: 17.5pp · 2024: 9.7pp
- All cycles
- 2024: D+9.7 2020: D+14.7 2016: D+4.8 2012: D+15.6 2008: D+17.5
Not yet ingested
- Civics
- —
Market trends
- HPI YoY
- ▲ 7.51%
- Current HPI
- 448.4879
- Rent YoY
- ▼ -0.49%
- Metro
- Buffalo-Cheektowaga, NY
- State GDP YoY
- ▲ 2.60%
- F500 in state
- 92
Industry mix (Fortune 500 HQ in NY)
| Industry | F500 HQs | Revenue |
|---|---|---|
| Financial Services | 10 | $950B |
|
||
| Consumer Goods | 9 | $162B |
|
||
| Insurance | 4 | $225B |
|
||
| Telecommunications | 2 | $144B |
|
||
| Pharmaceuticals | 2 | $112B |
|
||
| Media / Entertainment | 2 | $69B |
|
||
Price history
+758.2% since first listed16 events — show timeline
- 2026-03-01 Listed $115,000 WNYREIS
- 2024-12-09 Listing Removed — WNYREIS
- 2024-11-20 Price Changed $140,000 WNYREIS
- 2024-10-02 Listed $150,000 WNYREIS
- 2022-09-27 Sold (Public Records) $150,000 Public Records
- 2022-09-23 Sold (MLS) $150,000 WNYREIS
- 2022-07-02 Price Changed $150,000 WNYREIS
- 2022-07-02 Pending — WNYREIS
- 2022-06-30 Listed $135,000 WNYREIS
- 2020-03-05 Pending — WNYREIS
- 2020-03-05 Listing Removed — WNYREIS
- 2019-12-30 Relisted — WNYREIS
- 2019-12-20 Pending — WNYREIS
- 2019-12-13 Listed $59,999 WNYREIS
- 2004-02-17 Sold (Public Records) $8,500 Public Records
- 1994-09-23 Sold (Public Records) $13,400 Public Records
Property tax history
+6.8%/yrLatest (2025): $247 · +0.0% YoY. Source: county tax records.
Cash-flow waterfall
monthlySold comps — $/sqft
last 12 mo · ≤1 miLoading sold comps…