1432 Surrey Ln · St. Peters, MO
Flood risk 1/10 · Minimal
- FEMA flood zone
- X (unshaded)
- Chance of flooding over 30 yrs
- 0.0%
- Est. flood insurance / yr
- $507 – $1,088
Fire risk 1/10 · Minimal
- Est. fire insurance / yr
- $1,054 – $1,958
Heat risk 5/10 · Moderate
- Hot days now (above 108°F)
- 7 days/yr
- Hot days in 30 yrs
- 20 days/yr
Wind risk 2/10 · Minimal
- Chance of severe wind over 30 yrs
- 1.0%
Air-quality risk 2/10 · Minimal
- Unhealthy air days now
- 2 days/yr
- Unhealthy air days in 30 yrs
- 2 days/yr
Risk factors via First Street. Map © Google.
Why this score? — see what drove the D- grade
The composite is a weighted blend of 9 inputs, each scored 0–100. Each bar is that input's sub-score; the figure is the points it added to the 100-point composite (weight × sub-score).
- Cash flow +10.3/30.0
- ARV discount +7.5/15.0
- 1% rule +5.5/10.0
- Schools +5.2/10.0
- Rent growth +3.1/5.0
- DSCR +3.0/10.0
- Livability +2.5/5.0
- Condition / age +2.5/5.0
- Appreciation +0.0/10.0
$169,000
🖨 Deal sheet 📄 Offer letter ✓ Due diligence
Listing remarks MLS
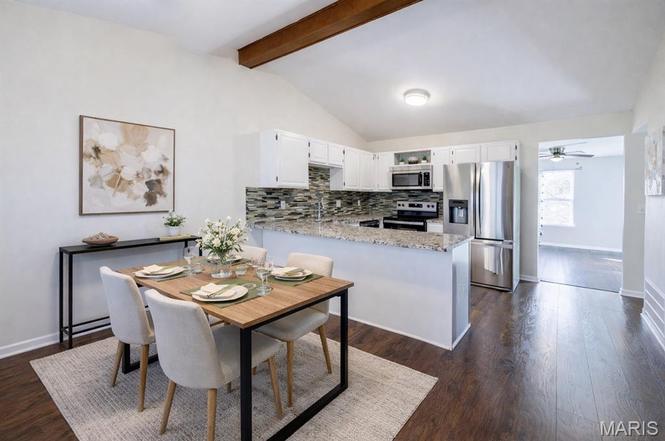
No showings until after the open house Sunday 10/25/2020 1-3pm... This is a must see 2 bed 2 full bath condo. This home has been fully renovated with new laminate flooring, fresh paint, 6 panel doors, HVAC and updated bathrooms. The large master suite shows its beauty with vaulted ceilings and a bay window. The kitchen upgrades include granite counter tops, tile back splash and stainless steel appliances. Enjoy your evenings sitting on the back deck over looking the large back yard. Centrally located in the heart of St Peters close to parks, shopping, schools and quick access to multiple highways. Make your appointment today and come see this beauty. Location: Upper Level
Key facts
- $327 HOA
- Built 1988
- Listed 144 days
Neighborhood map
What this means for you Summary
Snapshot
- This is a 2-bed/2.0-bath condo listed at $169k.
Deal economics
- At list price, monthly cash flow is $-93 ($-1k/yr) — negative.
- To cash-flow at today's rent, offer at most $156k (8.0% below list).
- Meets the 1% rule at list price ($2k rent vs $169k).
- Recommended offer: $149k (12.0% below list) — sets the bar for market timing.
- Cap rate 5.6% vs local median 4.2% in St. Peters — top-decile yield for the area; either an underpriced asset or a hidden risk that comps aren't pricing in. Stress-test before assuming the spread holds.
Location & tenants
- Location reads: area grade D — affects rentability + tenant quality, not the cash-flow math above.
- Francis Howell R-III (suburban): math 53% / reading 63% proficiency, ranked #11 of 324 in MO (top 3%) — acceptable for families but not a draw, mixed tenant base, ~2y average lease; only 15% free/reduced lunch — higher-income household profile.
- Zoned schools: Central Elem. (math 40% / reading 52%, grade D-, #402 of 1,115 statewide, top 36%, 831 students, 32% FRL); Francis Howell Central High (math 36% / reading 74%, grade C, #65 of 521 statewide, top 13%, 1,805 students, 18% FRL).
- Market conditions: Rents rising (+2.5%/yr); 278 active listings in the ZIP; 5 comparable units currently listed for rent nearby; rentals leasing fast (median 8d on market — plan ~1-2 weeks tenant-placement turnaround); high-income renter base; 2,021 units permitted in St. Charles County in 2024 (568 in 5+ unit buildings).
Forward outlook
- Local home prices are declining (-3.0%/yr); year-one equity from $1k of loan paydown is wiped out by about $5k of value loss. Plan a longer hold.
- St. Charles County population projected at +22% by 2050 — long-run rental-demand tailwind backs the buy-and-hold thesis.
Negotiation context
- It's been on market 144 days — a 12% lower offer ($149k) is reasonable based on typical stale-listing flexibility.
- 5 sale attempts since 12y ago; this cycle's ask has dropped $36k (18%) from the opening price — seller is motivated, your offer sets the floor, not the list.
Risks & watch-outs
- Climate carrying-cost: extreme-heat days projected 7→20/yr by 2055 (HVAC capex compounding) — expect insurance premiums to compound above CPI over the hold.
Questions for the listing agent
- What do current leases actually rent for vs. the listed asking? Can we see a recent rent roll and the last 12 months of T-12 income?
- It's been on market 144 days. Have you received any prior offers? Is the seller open to a 12% concession, seller financing, or rate buy-down credit?
- What does the HOA fee cover, when was the last increase, and are there any pending special assessments or reserve-fund shortfalls?
- Any open or pending special assessments — roof, HVAC, plumbing, elevator, façade? What's the per-unit balance and payoff schedule, and is the seller paying it off at close or rolling it to the buyer?
- Why hasn't it sold? Are there any deal-killer items the seller is aware of (foundation, flood, title, zoning, code violations)?
- Is there a deadline driving the sale (1031 exchange, divorce, estate, relocation)? That informs how much negotiation room exists.
- The area grade is low — what's the realistic commute time and amenity access for the typical tenant pool here? Any planned neighborhood developments (good or bad) we should know about?
- What's the average days-on-market for RENTAL listings here right now (not sales)? A rising rental-DOM trend means longer vacancies and softer asking-rent achievability than the comps imply.
- What's the recent tenant-quality profile in this submarket — average credit score on applications, eviction rate, late-payment / NSF rate, and stable-employment percentage? A property-management company in the area should have these aggregated.
- How much new apartment / multifamily construction is in the pipeline within 1–3 miles? Heavy new supply (>2% of stock underway) typically softens rents 12–24 months out; light construction supports rent growth.
Investment metrics
- 1% rule
- 1.05% ✓
- Cap rate
- 5.63%
- Cash-on-cash
- -2.36%
- DSCR
- 0.90
- GRM
- 7.9
CMA / ARV
No comps found within radius.
Projected returns pro-forma
-3.0% appreciation · 2.52% rent growth · sell at horizon
- IRR
- -20.7%
- Equity multiple
- 0.28×
- Total profit
- $-33,925
- Equity at exit
- $25,198
- IRR
- -15.1%
- Equity multiple
- 0.16×
- Total profit
- $-39,700
- Equity at exit
- $14,612
Cash invested: $47,320 (down + closing). Projections, not guarantees.
Landlord ↔ Tenant lean methodology
- Overall (STATE)
- 81 Strongly Landlord-Friendly
- State Missouri
- 81 Strongly Landlord-Friendly · R+10
- County
- — inherits STATE
- City
- — inherits STATE
ZIP-level market 63304
- Rents YoY
- 2.5%
- Active inventory
- 278
- Price-to-rent
- 7.9×
Monthly cashflow live
- Estimated rent
- $1,775 high interval (Pro) →
- Mortgage (P&I)
- −$886
- Tax est. 1.5%
- −$211 /mo · $2,535/yr
- Insurance
- −$70
- HOA
- −$327
- Vacancy / Maint / Mgmt
- −$373
- Net cashflow
- $-93
Break-even live
UW: 25.0% down · 7.5% · 30yr · 1.5% tax · 5.0% vac · 8.0% maint · 8.0% mgmt
Financing live
Cash to close
- Down payment
- $42,250
- Closing costs
- $5,070
- Reserves months
- —
- Total cash needed
- —
Loan-product check · same deal, 3 products live
Conventional
25% down · 7.5% · 30yr
- Down + closing
- —
- Monthly P&I
- —
- Monthly cashflow
- —
- DSCR
- —
- Eligible?
- —
Personal DTI + credit; lowest rate.
DSCR
20% down · 8.5% · 30yr
- Down + closing
- —
- Monthly P&I
- —
- Monthly cashflow
- —
- DSCR
- —
- Eligible?
- —
No personal income docs; deal must DSCR.
Hard money
10% down · 12.0% · 12mo
- Down + closing
- —
- Monthly P&I
- —
- Monthly cashflow
- —
- DSCR
- —
- Eligible?
- —
Short-term bridge; refi at stabilization.
Rent comps 5 comps
| Address | Beds | Baths | Sqft | Rent | $/sqft | DOM | Units | Dist |
|---|---|---|---|---|---|---|---|---|
| 1360 Park Ashwood Dr St Charles, MO | 2.0–3.0 | 2.0 | 1038 | $1,510 | $1.45 | 1d | 5 | 0.52mi |
| 11 Rose Dr St Charles, MO | 2.0 | 1.5 | 860 | $1,850 | $2.15 | 7d | 1 | 0.78mi |
| 4153 McClay Rd Saint Charles, MO | 3.0 | 2.0 | 1096 | $2,100 | $1.92 | 43d | 1 | 0.90mi |
| 4507 Cambrook Dr Saint Charles, MO | 3.0 | 2.0 | 1279 | $2,300 | $1.80 | 11d | 1 | 0.91mi |
| 1400 Britain Way St Charles, MO | 1.0–2.0 | 1.0 | 762 | $1,484 | $1.95 | 1d | 7 | 1.02mi |
HOA detail condo
- Monthly dues
- $327 · $3,924/yr
- Assessments
- None detected in remarks — confirm with the listing agent.
Listing history 16 events
-
2026-04-05status Pending
-
2026-03-14status Active
-
2026-03-09status Pending
-
2026-02-18price $169,000
-
2026-02-01status Active
-
2026-01-29price $178,000
-
2025-12-17price $185,000
-
2025-11-22price $195,000
-
2025-11-10price $200,000
-
2025-11-06$205,000 Active
-
2025-11-01historical $205,000
-
2020-12-10soldstatus Closed 680-char remark
Show marketing remark (680 chars)
No showings until after the open house Sunday 10/25/2020 1-3pm... This is a must see 2 bed 2 full bath condo. This home has been fully renovated with new laminate flooring, fresh paint, 6 panel doors, HVAC and updated bathrooms. The large master suite shows its beauty with vaulted ceilings and a bay window. The kitchen upgrades include granite counter tops, tile back splash and stainless steel appliances. Enjoy your evenings sitting on the back deck over looking the large back yard. Centrally located in the heart of St Peters close to parks, shopping, schools and quick access to multiple highways. Make your appointment today and come see this beauty. Location: Upper Level
-
2020-10-27status Pending 680-char remark
Show marketing remark (680 chars)
No showings until after the open house Sunday 10/25/2020 1-3pm... This is a must see 2 bed 2 full bath condo. This home has been fully renovated with new laminate flooring, fresh paint, 6 panel doors, HVAC and updated bathrooms. The large master suite shows its beauty with vaulted ceilings and a bay window. The kitchen upgrades include granite counter tops, tile back splash and stainless steel appliances. Enjoy your evenings sitting on the back deck over looking the large back yard. Centrally located in the heart of St Peters close to parks, shopping, schools and quick access to multiple highways. Make your appointment today and come see this beauty. Location: Upper Level
-
2020-10-25$135,000 Active 680-char remark
Show marketing remark (680 chars)
No showings until after the open house Sunday 10/25/2020 1-3pm... This is a must see 2 bed 2 full bath condo. This home has been fully renovated with new laminate flooring, fresh paint, 6 panel doors, HVAC and updated bathrooms. The large master suite shows its beauty with vaulted ceilings and a bay window. The kitchen upgrades include granite counter tops, tile back splash and stainless steel appliances. Enjoy your evenings sitting on the back deck over looking the large back yard. Centrally located in the heart of St Peters close to parks, shopping, schools and quick access to multiple highways. Make your appointment today and come see this beauty. Location: Upper Level
-
2014-10-30soldstatus 161-char remark
Show marketing remark (161 chars)
Wow, this condo is a must see! It features 2 bedroom, 2 bathroom and is in the Francis Howell school District. Hurry this will not last long at this great price!
-
2014-07-23$59,900 161-char remark
Show marketing remark (161 chars)
Wow, this condo is a must see! It features 2 bedroom, 2 bathroom and is in the Francis Howell school District. Hurry this will not last long at this great price!
ⓘ Source: listings_history table (triggers on properties + properties_extension) + one-shot
backfill from property_details.listing_events for pre-trigger history.
Climate risk First Street
- Flood 1/10 Low FEMA zone X (unshaded) · 0% chance over 30 yrs
- Wildfire 1/10 Low
- Heat 5/10 Major 7 d/yr ≥108°F today · 20 d/yr by 30 yrs out
- Wind 2/10 Low 100% chance of damaging wind over 30 yrs
- Air quality 2/10 Low 2 unhealthy d/yr today · 2 by 30 yrs out
Nearby sold comps map
Loading sold comps map…
Walkable amenities ~0.75 mi
Loading nearby amenities…
Taxation est. · year 1
- Rental income
- $21,297
- − Mortgage interest
- −$9,467
- − Property taxes
- −$2,535
- − Insurance
- −$845
- − Repairs & maintenance
- −$1,704
- − Management
- −$1,704
- − HOA
- −$3,924
- − Depreciation
- −$4,916
- Taxable loss
- −$3,798
- Est. tax savings @ 24.0%
- +$911
- After-tax cash flow
- $-203/yr
For passive investors: Depreciation is non-cash, so a rental often shows a tax loss while cash-flowing — sheltering income. Rental losses are passive: they offset passive income freely, and up to $25,000/yr can offset ordinary (W-2) income if you actively participate and your MAGI is under $100k (phasing out to $0 by $150k); unused losses carry forward. On sale, claimed depreciation is recaptured at up to 25%, and gains may owe capital-gains tax (a 1031 exchange can defer both). Figures are a year-1 estimate at your 24.0% rate — not tax advice; consult a CPA.
Schools (NCES district)
- District
- Francis Howell R-III
- NCES district ID
- 2928950
- Math proficiency
- 53% ▼ -12.00%
- Reading proficiency
- 63% ▼ -5.00%
- Median HH income
- $79,768
- Composite
- 52.23/100
- National rank
- #1602
- State rank
- #11 of 324 in MO
Livability — St. Peters
No livability data for this city. (Only ~50 U.S. cities are tracked.)
Census & demographics
- Census place
- St. Peters, MO
- County
- Saint Charles County · 399,703 people
- City population
- 74,876
- Metro
- St. Louis, MO-IL
- Population (ZIP)
- 43,195
- Household income
- $114,442
- Rent vs Own
- Severe rent burden
- 560.0
Population outlook (St. Charles County) Hauer SSP2
- Today (2025)
- 437,857 people
- By 2030
- 461,707 · +5.4%
- By 2040
- 503,222 · +14.9%
- By 2050
- 534,684 · +22.1%
- By 2075
- 597,047 · +36.4%
- By 2100
- 609,682 · +39.2%
Race, ethnicity, and origin ACS 2023
- Neighborhood character
- Predominantly White (87%)
- Race & ethnicity
- White 87% Two or more races 4% Hispanic / Latino 4% Black 4% Asian 2%
- Common ancestry
- Lithuanian 3% Romanian 3% Italian 3%
- Foreign-born
- 5% · Canada
- Languages at home
- 95% English-only · Spanish 2% Other Indo-European 1% Russian/Polish/Slavic 1%
Political lean MEDSL · St. Charles
- 2024 margin
- R (+17.0) · D 40.8% · R 57.8% · Other 1.4%
- 2008→2024 swing
- -7.2pp toward R · 2008: -9.7pp · 2024: -17.0pp
- All cycles
- 2024: R+17.0 2020: R+17.5 2016: R+26.4 2012: R+21.0 2008: R+9.7
Not yet ingested
- Civics
- —
Market trends
- HPI YoY
- ▼ -225.72%
- Current HPI
- 233.745
- Rent YoY
- ▲ 2.52%
- Metro
- St. Louis, MO-IL
- State GDP YoY
- ▲ 1.84%
- F500 in state
- 20
Industry mix (Fortune 500 HQ in MO)
| Industry | F500 HQs | Revenue |
|---|---|---|
| Healthcare | 1 | $163B |
|
||
| Insurance | 1 | $21B |
|
||
| Industrial Technology | 1 | $17B |
|
||
| Retail | 1 | $16B |
|
||
| Industrial Distribution | 1 | $10B |
|
||
| Utilities | 1 | $9B |
|
||
Price history
+182.1% since first listed16 events — show timeline
- 2026-04-05 Pending — MARIS as Distributed by MLS Grid
- 2026-03-14 Relisted — MARIS as Distributed by MLS Grid
- 2026-03-09 Pending — MARIS as Distributed by MLS Grid
- 2026-02-18 Price Changed $169,000 MARIS as Distributed by MLS Grid
- 2026-02-01 Relisted — MARIS as Distributed by MLS Grid
- 2026-01-29 Price Changed $178,000 MARIS as Distributed by MLS Grid
- 2025-12-17 Price Changed $185,000 MARIS as Distributed by MLS Grid
- 2025-11-22 Price Changed $195,000 MARIS as Distributed by MLS Grid
- 2025-11-10 Price Changed $200,000 MARIS as Distributed by MLS Grid
- 2025-11-06 Listed $205,000 MARIS as Distributed by MLS Grid
- 2025-11-01 Coming Soon $205,000 MARIS as Distributed by MLS Grid
- 2020-12-10 Sold (MLS) — MARIS as Distributed by MLS Grid
- 2020-10-27 Pending — MARIS as Distributed by MLS Grid
- 2020-10-25 Listed $135,000 MARIS as Distributed by MLS Grid
- 2014-10-30 Sold (MLS) — MARIS as Distributed by MLS Grid
- 2014-07-23 Listed $59,900 MARIS as Distributed by MLS Grid
Cash-flow waterfall
monthlySold comps — $/sqft
last 12 mo · ≤1 miLoading sold comps…