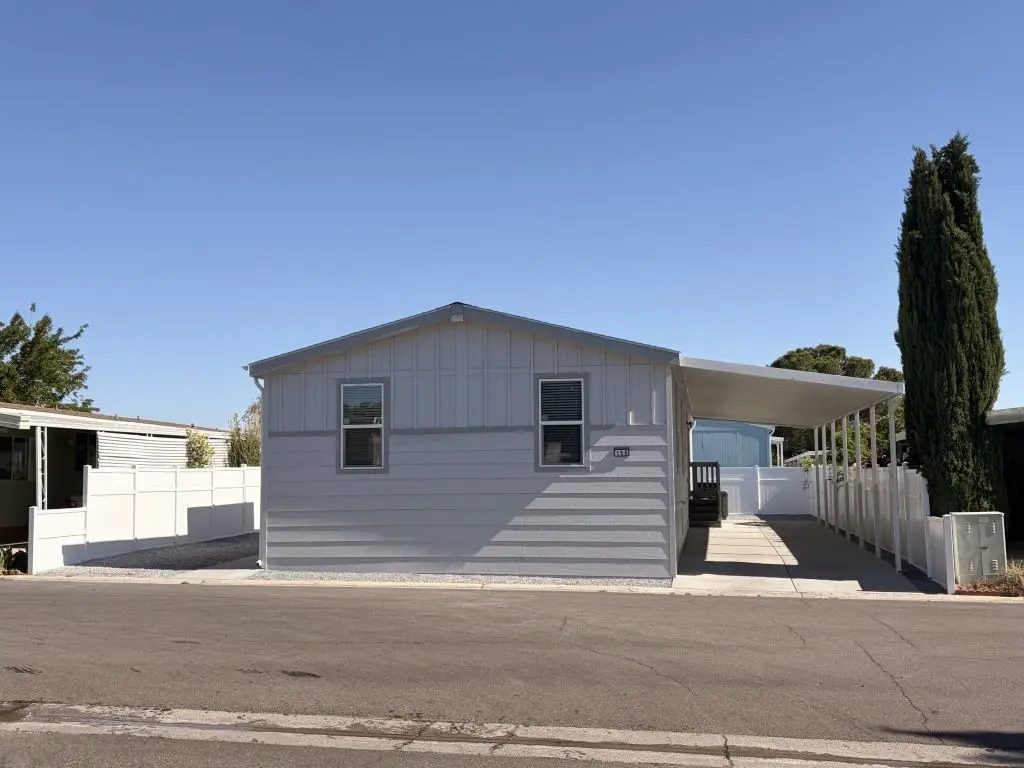
20683 Waalew Rd #155 · Apple Valley, CA
Flood risk 1/10 · Minimal
- FEMA flood zone
- X (unshaded)
- Chance of flooding over 30 yrs
- 0.0%
- Est. flood insurance / yr
- $507 – $1,088
Fire risk 6/10 · Moderate
- Est. fire insurance / yr
- $659 – $1,223
Heat risk 7/10 · Major
- Hot days now (above 100°F)
- 1 days/yr
- Hot days in 30 yrs
- 4 days/yr
Wind risk 1/10 · Minimal
- Chance of severe wind over 30 yrs
- —
Air-quality risk 9/10 · Severe
- Unhealthy air days now
- 21 days/yr
- Unhealthy air days in 30 yrs
- 26 days/yr
Risk factors via First Street. Map © Google.
Why this score? — see what drove the B grade
The composite is a weighted blend of 9 inputs, each scored 0–100. Each bar is that input's sub-score; the figure is the points it added to the 100-point composite (weight × sub-score).
- Cash flow +30.0/30.0
- 1% rule +10.0/10.0
- DSCR +10.0/10.0
- ARV discount +7.5/15.0
- Rent growth +3.9/5.0
- Condition / age +3.8/5.0
- Schools +3.1/10.0
- Livability +3.1/5.0
- Appreciation +0.0/10.0
$184,900
🖨 Deal sheet 📄 Offer letter ✓ Due diligence
Listing remarks
DBA: Decal: CAV220CA2542899A/B Dealer Number: 91126.Welcome to Los Ranchos, an all-age, active and vibrant community, where you can find yourself in your dream home. We have a brand-new 2026 4-bed, 2-bath home for sale featuring 1,310.40 sq ft of beautifully designed living space. Located in/near Apple Valley, this property offers the perfect blend of modern amenities and timeless charm. Step inside to find an open-concept floor plan, hardwood floors, high ceilings, and natural light. The kitchen boasts features like custom cabinetry, perfect for both everyday living and entertaining. The spacious suite offers a peaceful retreat, complete with dual vanities and a spacious walk-in shower. Ad
Key facts
- Custom cabinetry
- Dual vanities
- High ceilings
Tags
Property features AI
Finance
- Other: Address: 20683 Waalew Rd #155, Apple Valley, CA 92307; Listing provided by Zillow; information deemed reliable but not guaranteed
- Financial info: List price $187,900
Exterior
- Home design: Single-family plan (Claremont)
- Exterior features: Living area approximately 1,310
Interior
- Bedrooms: 4 bedrooms
- Bathrooms: 2 bathrooms
- Interior features: Spec home, Plan: Claremont; Active listing
Neighborhood map
What this means for you Summary
Snapshot
- This is a 4-bed/2.0-bath manufactured listed at $185k. Condition is rated good.
Deal economics
- At list price, monthly cash flow is $2k ($18k/yr) — positive.
- The deal already cash-flows at list — no discount required.
- Meets the 1% rule at list price ($4k rent vs $185k).
- Recommended offer: $179k (3.0% below list) — sets the bar for market timing.
- Cap rate 16.2% vs local median 3.5% in Apple Valley — top-decile yield for the area; either an underpriced asset or a hidden risk that comps aren't pricing in. Stress-test before assuming the spread holds.
Location & tenants
- Location reads 61/100 on livability (#532 in CA) — a middle-class / working-renter tenant base. Strengths: housing A+, commute B+; Watch: employment D+, schools F, crime D-.
- Apple Valley Unified (suburban): math 25% / reading 40% proficiency, ranked #955 of 1,400 in CA (top 68%) — families likely to look elsewhere, expect single-tenant / working-renter base with shorter leases; 60% free/reduced lunch — lower-income household profile, screen leases tightly.
- Market conditions: Rents rising fast (+5.5%/yr); 526 active listings in the ZIP; 3 comparable units currently listed for rent nearby; rentals at typical pace (median 24d on market — plan ~3-4 weeks tenant-placement turnaround); solid renter incomes; 5,458 units permitted in San Bernardino County in 2024 (1,500 in 5+ unit buildings).
- At $3,559/mo this rent would consume 55% of the median local household income ($77k/yr) (locally 1069% of renters already pay >50% of income on rent) — very limited rent-growth headroom before tenants either downsize or default.
Forward outlook
- Local home prices are declining (-3.0%/yr); year-one equity from $1k of loan paydown is wiped out by about $6k of value loss. Plan a longer hold.
- San Bernardino County population projected at +15% by 2050 — modest demand growth; plan on rents tracking national, not racing it.
- At projected returns (-3.0% appreciation + 5.5% rent growth), your $52k cash investment doubles in ~4 years — after that, you're playing with house money.
Negotiation context
- It's been on market 34 days — a 3% lower offer ($179k) is reasonable based on typical stale-listing flexibility.
Risks & watch-outs
- Climate carrying-cost: major wildfire risk; extreme-heat days projected 1→4/yr by 2055 (HVAC capex compounding) — expect insurance premiums to compound above CPI over the hold.
Questions for the listing agent
- It's been on market 34 days. Have you received any prior offers? Is the seller open to a 3% concession, seller financing, or rate buy-down credit?
- Is there a deadline driving the sale (1031 exchange, divorce, estate, relocation)? That informs how much negotiation room exists.
- Schools are F-rated, which usually means shorter tenancies and higher turnover. Who's the typical renter profile here, and what's been the actual vacancy rate?
- Crime grade is D in this area — have there been break-ins, vandalism, or insurance claims at this property in the last 3 years? What carrier currently insures it and at what premium?
- What's the average days-on-market for RENTAL listings here right now (not sales)? A rising rental-DOM trend means longer vacancies and softer asking-rent achievability than the comps imply.
- What's the recent tenant-quality profile in this submarket — average credit score on applications, eviction rate, late-payment / NSF rate, and stable-employment percentage? A property-management company in the area should have these aggregated.
- How much new for-sale + rental construction is in the pipeline within 1–3 miles? Heavy new supply typically softens prices + rents 12–24 months out; constrained supply supports both.
Investment metrics
- 1% rule
- 1.92% ✓
- Cap rate
- 16.25%
- Cash-on-cash
- 35.55%
- DSCR
- 2.58
- GRM
- 4.3
CMA / ARV
- ARV (median comp)
- $86,205
- List price
- $184,900
- Delta
- 114.49%
- Verdict
- OVERPRICED
- Comps
- 20 within 1.0 mi
Show comp detail 12 sales within ~0.75 mi
| Address | Dist | Beds/Ba | Sqft | Sold | Price | $/sf | Match |
|---|---|---|---|---|---|---|---|
| 20843 Waalew Rd Unit C44 | 0.18mi | 3/2.0 (-1) | 1,296 (-1%) | 8mo | $95,000 | $73 | 78 |
| 20843 Waalew Rd #19 | 0.13mi | 4/2.0 | 1,344 (+3%) | 16mo | $125,000 | $93 | 77 |
| 20843 Waalew Rd #12 | 0.12mi | 3/2.0 (-1) | 1,344 (+3%) | 12mo | $89,999 | $67 | 75 |
| 20843 Waalew Rd Unit C79 | 0.18mi | 3/2.0 (-1) | 1,296 (-1%) | 16mo | $125,000 | $96 | 72 |
| 20843 Waalew Unit C4 | 0.18mi | 3/2.0 (-1) | 1,176 (-10%) | 1mo | $71,000 | $60 | 69 |
| 20683 Waalew Rd Unit B87 | 0.17mi | 3/2.0 (-1) | 1,392 (+6%) | 12mo | $111,500 | $80 | 66 |
| 20843 Waalew Rd Unit C94 | 0.18mi | 4/2.0 | 1,440 (+10%) | 12mo | $90,000 | $63 | 65 |
| 20843 Waalew C57 Unit C57 | 0.18mi | 3/2.0 (-1) | 1,152 (-12%) | 3mo | $68,500 | $59 | 64 |
| 20683 Waalew SPC B54 Rd Unit B54 | 0.17mi | 3/2.0 (-1) | 1,440 (+10%) | 9mo | $130,600 | $91 | 63 |
| 20843 Waalew Rd Unit C92 | 0.18mi | 3/2.0 (-1) | 1,152 (-12%) | 5mo | $75,000 | $65 | 62 |
| 20683 Waalew Rd Unit B120 | 0.17mi | 3/2.0 (-1) | 1,431 (+9%) | 13mo | $90,000 | $63 | 60 |
| 20843 Waalew #163 | 0.13mi | 3/2.0 (-1) | 1,456 (+11%) | 13mo | $89,000 | $61 | 60 |
Match score weights: distance 35% · size 25% · config 20% · recency 20%. Top-matched comps best support the ARV.
Projected returns pro-forma
-3.0% appreciation · 5.48% rent growth · sell at horizon
- IRR
- 34.0%
- Equity multiple
- 2.48×
- Total profit
- $76,863
- Equity at exit
- $27,569
- IRR
- 42.2%
- Equity multiple
- 5.49×
- Total profit
- $232,204
- Equity at exit
- $15,987
Cash invested: $51,772 (down + closing). Projections, not guarantees.
Landlord ↔ Tenant lean methodology
- Overall (STATE)
- 18 Strongly Tenant-Friendly
- State California
- 18 Strongly Tenant-Friendly · D+13
- County
- — inherits STATE
- City
- — inherits STATE
ZIP-level market 92307
- Rents YoY
- 5.5%
- Active inventory
- 526
- Price-to-rent
- 4.3×
Monthly cashflow live
- Estimated rent
- $3,559 medium interval (Pro) →
- Mortgage (P&I)
- −$970
- Tax est. 1.5%
- −$231 /mo · $2,774/yr
- Insurance
- −$77
- HOA
- −$0
- Vacancy / Maint / Mgmt
- −$747
- Net cashflow
- $1,534
Break-even live
UW: 25.0% down · 7.5% · 30yr · 1.5% tax · 5.0% vac · 8.0% maint · 8.0% mgmt
Financing live
Cash to close
- Down payment
- $46,225
- Closing costs
- $5,547
- Reserves months
- —
- Total cash needed
- —
Loan-product check · same deal, 3 products live
Conventional
25% down · 7.5% · 30yr
- Down + closing
- —
- Monthly P&I
- —
- Monthly cashflow
- —
- DSCR
- —
- Eligible?
- —
Personal DTI + credit; lowest rate.
DSCR
20% down · 8.5% · 30yr
- Down + closing
- —
- Monthly P&I
- —
- Monthly cashflow
- —
- DSCR
- —
- Eligible?
- —
No personal income docs; deal must DSCR.
Hard money
10% down · 12.0% · 12mo
- Down + closing
- —
- Monthly P&I
- —
- Monthly cashflow
- —
- DSCR
- —
- Eligible?
- —
Short-term bridge; refi at stabilization.
Rent comps 3 comps
| Address | Beds | Baths | Sqft | Rent | $/sqft | DOM | Units | Dist |
|---|---|---|---|---|---|---|---|---|
| 20414 Zuni Rd Unit 1 Apple Valley, CA | 3.0 | 2.0 | 1250 | $1,700 | $1.36 | 43d | 1 | 1.26mi |
| 16100 Navajo Rd Unit 1 Apple Valley, CA | 4.0 | 2.5 | 1600 | $2,450 | $1.53 | 24d | 1 | 1.46mi |
| 16100 Navajo Rd Apple Valley, CA | 4.0 | 2.5 | 1600 | $7,900 | $4.94 | 18d | 1 | 1.46mi |
Listing history 17 events
-
2026-06-18days on market $184,900 Active 34 DOM
-
2026-06-17days on market $184,900 Active 33 DOM
-
2026-06-16days on market $184,900 Active 32 DOM
-
2026-06-15days on market $184,900 Active 31 DOM
-
2026-06-13days on market $184,900 Active 29 DOM
-
2026-06-13days on market $184,900 Active 28 DOM
-
2026-06-09days on market $184,900 Active 25 DOM
-
2026-06-08days on market $184,900 Active 24 DOM
-
2026-06-07days on market $184,900 Active 23 DOM
-
2026-06-04days on market $184,900 Active 20 DOM
-
2026-06-03days on market $184,900 Active 19 DOM
-
2026-06-02days on market $184,900 Active 18 DOM
-
2026-06-01days on market $184,900 Active 17 DOM
-
2026-05-31days on market $184,900 Active 16 DOM
-
2026-05-16$187,900 Active 1313-char remark
-
2021-11-25historical
-
2015-01-29$27,000
ⓘ Source: listings_history table (triggers on properties + properties_extension) + one-shot
backfill from property_details.listing_events for pre-trigger history.
Climate risk First Street
- Flood 1/10 Low FEMA zone X (unshaded) · 0% chance over 30 yrs
- Wildfire 6/10 Major
- Heat 7/10 Severe 1 d/yr ≥100°F today · 4 d/yr by 30 yrs out
- Wind 1/10 Low
- Air quality 9/10 Extreme 21 unhealthy d/yr today · 26 by 30 yrs out
Nearby sold comps map
Loading sold comps map…
Walkable amenities ~0.75 mi
Loading nearby amenities…
Taxation est. · year 1
- Rental income
- $42,704
- − Mortgage interest
- −$10,357
- − Property taxes
- −$2,774
- − Insurance
- −$924
- − Repairs & maintenance
- −$3,416
- − Management
- −$3,416
- − Depreciation
- −$5,379
- Taxable income
- $16,437
- Est. tax owed @ 24.0%
- −$3,945
- After-tax cash flow
- $14,457/yr
For passive investors: Depreciation is non-cash, so a rental often shows a tax loss while cash-flowing — sheltering income. Rental losses are passive: they offset passive income freely, and up to $25,000/yr can offset ordinary (W-2) income if you actively participate and your MAGI is under $100k (phasing out to $0 by $150k); unused losses carry forward. On sale, claimed depreciation is recaptured at up to 25%, and gains may owe capital-gains tax (a 1031 exchange can defer both). Figures are a year-1 estimate at your 24.0% rate — not tax advice; consult a CPA.
Condition & rehab AI · 1 photo
This 2026 manufactured home in Apple Valley, CA, is in excellent condition with a good condition score of 75. It offers a modern floor plan, hardwood floors, and a spacious suite with dual vanities and a walk-in shower. The home is move-in ready with minimal cosmetic updates needed to enhance its resale and rental value.
Value-add opportunities
- Both Painting exterior and interior walls — Fresh paint enhances curb appeal and interior aesthetics.
- Both Landscaping improvements — Enhances curb appeal and adds value to the property.
- Both New flooring in bathrooms — Modernizes the bathrooms and improves aesthetics.
- Both New kitchen appliances — Modernizes the kitchen and improves functionality for potential buyers/renters.
Renovation cost estimate screening
Value-add ROI direction
- Both Painting exterior and interior walls — Fresh paint enhances curb appeal and interior aesthetics. ↑
- Both Landscaping improvements — Enhances curb appeal and adds value to the property. ↑
- Both New flooring in bathrooms — Modernizes the bathrooms and improves aesthetics. ↑
- Both New kitchen appliances — Modernizes the kitchen and improves functionality for potential buyers/renters. ↑
ⓘ Cost ranges are severity-bucket heuristics (US national rule-of-thumb). Get contractor quotes + a written scope before underwriting a rehab budget.
Schools (NCES district)
- District
- Apple Valley Unified
- NCES district ID
- 0600017
- Math proficiency
- 25% ▬ 0.00%
- Reading proficiency
- 40% ▬ 0.00%
- Median HH income
- $49,264
- Composite
- 30.91/100
- National rank
- #11351
- State rank
- #955 of 1400 in CA
Livability — Apple Valley
- Score
- 61/100
- State rank
- #532
- US rank
- #17800
Category grades
Schools grade is shown separately in the Schools card above.
Census & demographics
- Census place
- Apple Valley, CA
- County
- San Bernardino County · 2,030,291 people
- City population
- 83,889
- Metro
- Riverside-San Bernardino-Ontario, CA
- Population (ZIP)
- 41,180
- Household income
- $77,106
- Rent vs Own
- Severe rent burden
- 1069.0
Population outlook (San Bernardino County) Hauer SSP2
- Today (2025)
- 2,300,329 people
- By 2030
- 2,378,907 · +3.4%
- By 2040
- 2,523,137 · +9.7%
- By 2050
- 2,642,388 · +14.9%
- By 2075
- 2,880,769 · +25.2%
- By 2100
- 2,909,436 · +26.5%
Race, ethnicity, and origin ACS 2023
- Neighborhood character
- Diverse neighborhood (Simpson 0.63)
- Race & ethnicity
- White 47% Hispanic / Latino 38% Two or more races 22% Black 5% Asian 3% Native American 2%
- Hispanic origin (detail)
- Mexican 34% Puerto Rican 1%
- Common ancestry
- Lithuanian 3% Italian 3% Slovak 2%
- Foreign-born
- 10% · Canada, China
- Languages at home
- 75% English-only · Spanish 20% Arabic 1% Other Indo-European 1%
Political lean MEDSL · San Bernardino
- 2024 margin
- Toss-up / Even · D 47.5% · R 49.7% · Other 2.8%
- 2008→2024 swing
- -8.5pp toward R · 2008: 6.3pp · 2024: -2.1pp
- All cycles
- 2024: R+2.1 2020: D+10.7 2016: D+9.8 2012: D+5.4 2008: D+6.3
Not yet ingested
- Civics
- —
Market trends
- HPI YoY
- ▼ -262.21%
- Current HPI
- 347.8498
- Rent YoY
- ▲ 5.48%
- Metro
- Riverside-San Bernardino-Ontario, CA
- State GDP YoY
- ▲ 3.21%
- F500 in state
- 116
Industry mix (Fortune 500 HQ in CA)
| Industry | F500 HQs | Revenue |
|---|---|---|
| Technology | 27 | $1,492B |
|
||
| Financial Services | 3 | $174B |
|
||
| Retail | 3 | $44B |
|
||
| Insurance | 3 | $26B |
|
||
| Media / Entertainment | 2 | $115B |
|
||
| Pharmaceuticals / Biotech | 2 | $62B |
|
||
Cash-flow waterfall
monthlySold comps — $/sqft
last 12 mo · ≤1 miLoading sold comps…