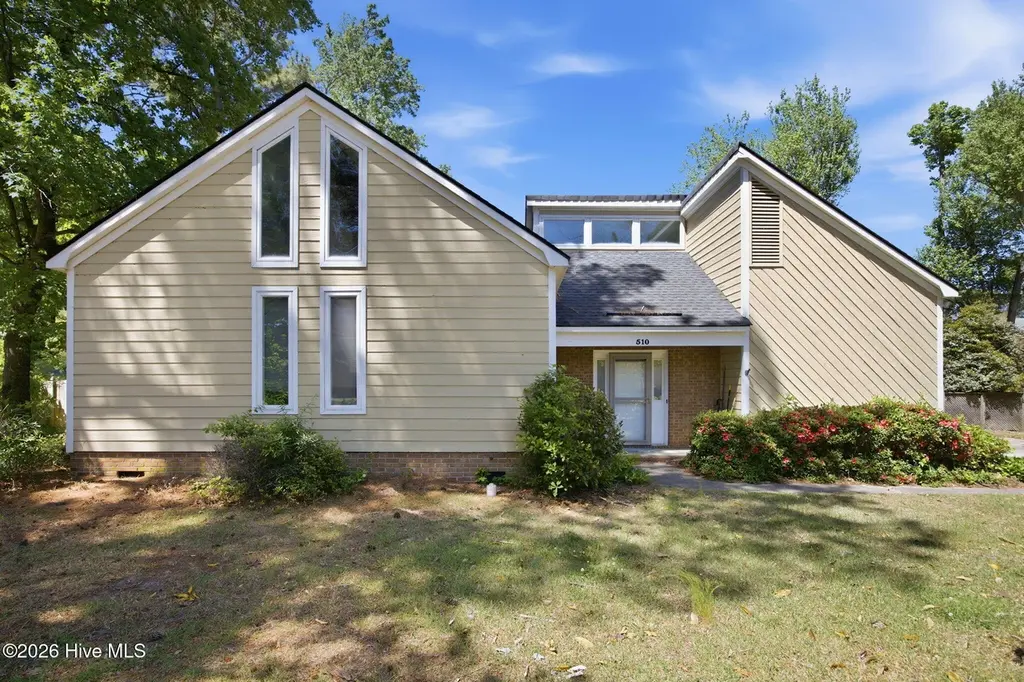
510 Winstead Rd · Greenville, NC
Flood risk 1/10 · Minimal
- FEMA flood zone
- X (unshaded)
- Chance of flooding over 30 yrs
- 0.0%
- Est. flood insurance / yr
- $507 – $1,088
Fire risk 2/10 · Minimal
- Est. fire insurance / yr
- $906 – $1,684
Heat risk 8/10 · Major
- Hot days now (above 106°F)
- 7 days/yr
- Hot days in 30 yrs
- 17 days/yr
Wind risk 8/10 · Major
- Chance of severe wind over 30 yrs
- 80.0%
Air-quality risk 3/10 · Minor
- Unhealthy air days now
- 3 days/yr
- Unhealthy air days in 30 yrs
- 3 days/yr
Risk factors via First Street. Map © Google.
Why this score? — see what drove the D+ grade
The composite is a weighted blend of 9 inputs, each scored 0–100. Each bar is that input's sub-score; the figure is the points it added to the 100-point composite (weight × sub-score).
- ARV discount +15.0/15.0
- Cash flow +12.2/30.0
- Rent growth +3.9/5.0
- Livability +3.9/5.0
- DSCR +3.6/10.0
- Schools +3.6/10.0
- 1% rule +3.1/10.0
- Condition / age +2.5/5.0
- Appreciation +0.0/10.0
$235,000
🖨 Deal sheet 📄 Offer letter ✓ Due diligence
Listing remarks
Beautiful entry into this open 3 bedroom, 2 bath home with high ceilings and great natural light from the large windows. If you're looking for a more unique floor plan, this one stands out. The open dining area is a central feature and connects well to the two separate living spaces, offering flexibility for everyday living or entertaining. There's a covered deck just off the kitchen and one of the living areas. A screened porch off the primary bedroom and second bedroom is a great spot for morning coffee or relaxing in the evenings. The backyard is fenced and includes a large storage building. Located in a well-established neighborhood with mature trees and tucked away in the middle of Gre
Key facts
- Covered deck
- Open floor plan
- Screened porch
Tags
Property features AI
Exterior
- Parking: On-site parking
- Utilities: Water connected; Sewer connected
- Home design: Single family residence; One story; Entry level is first floor; Residential property
- Construction: Wood siding and frame construction; Shingle roof; Crawl space foundation; Built on one level
- Exterior features: Covered patio/porch; Deck; Porch; Wood fencing; Has a view; Paved road access
Interior
- Bedrooms: Total rooms: 5; Entry level: 1
- Bathrooms: 2 full bathrooms
- Heating & cooling: Heat pump and electric heating; Heat pump cooling
- Interior features: High ceilings; Window coverings; Gas log fireplace
Neighborhood map
What this means for you Summary
Snapshot
- This is a 3-bed/2.0-bath single-family listed at $235k.
Deal economics
- At list price, monthly cash flow is $-46 ($-551/yr) — negative.
- To cash-flow at today's rent, offer at most $227k (3.5% below list).
- To meet the 1% rule (rent ≥ 1% of price), the offer needs to be $190k (19.2% below list).
- Recommended offer: $190k (19.2% below list) — sets the bar for 1% rule.
- Cap rate 6.1% vs local median 3.8% in Greenville — top-decile yield for the area; either an underpriced asset or a hidden risk that comps aren't pricing in. Stress-test before assuming the spread holds.
Location & tenants
- Location reads 77/100 on livability (#30 in NC, #2,977 nationally) — a middle-class / working-renter tenant base. Strengths: commute A+, cost of living A+, health & safety A+; Watch: crime F, employment F.
- Pitt County Schools (rural): math 41% / reading 44% proficiency, ranked #100 of 178 in NC (top 56%) — families likely to look elsewhere, expect single-tenant / working-renter base with shorter leases.
- Zoned schools: Ridgewood Elementary (math 50% / reading 57%, grade C, #335 of 1,410 statewide, top 24%, 722 students, 47% FRL); E B Aycock Middle (math 27% / reading 30%, grade F, #355 of 475 statewide, top 76%, 661 students, 99% FRL); South Central (math 42% / reading 51%, grade D-, #344 of 535 statewide, top 64%, 1,675 students, 55% FRL).
- Market conditions: Rents rising fast (+5.4%/yr); 350 active listings in the ZIP; 7 comparable units currently listed for rent nearby; rentals at typical pace (median 21d on market — plan ~3-4 weeks tenant-placement turnaround); 1,300 units permitted in Pitt County in 2024 (204 in 5+ unit buildings).
- At $1,898/mo this rent would consume 47% of the median local household income ($49k/yr) (locally 3319% of renters already pay >50% of income on rent) — very limited rent-growth headroom before tenants either downsize or default.
Forward outlook
- Local home prices are declining (-3.0%/yr); year-one equity from $2k of loan paydown is wiped out by about $7k of value loss. Plan a longer hold.
- Pitt County population projected at +22% by 2050 — long-run rental-demand tailwind backs the buy-and-hold thesis.
Negotiation context
- Only 6 days on market — expect competitive offers; lowballing is unlikely to land.
- 4 sale attempts since 18y ago with the ask held roughly flat each time — persistent listings suggest the price (not the market) is what's stuck; bring a comps-based counter.
- Current owner paid $158k; 49% above their basis — modest negotiation headroom, anchor on the comps not their cost.
Risks & watch-outs
- Climate carrying-cost: severe wind risk, 80% chance of damaging wind over 30y; extreme-heat days projected 7→17/yr by 2055 (HVAC capex compounding) — expect insurance premiums to compound above CPI over the hold.
Questions for the listing agent
- What do current leases actually rent for vs. the listed asking? Can we see a recent rent roll and the last 12 months of T-12 income?
- Is there a deadline driving the sale (1031 exchange, divorce, estate, relocation)? That informs how much negotiation room exists.
- Crime grade is F in this area — have there been break-ins, vandalism, or insurance claims at this property in the last 3 years? What carrier currently insures it and at what premium?
- The area grade is low — what's the realistic commute time and amenity access for the typical tenant pool here? Any planned neighborhood developments (good or bad) we should know about?
- What's the average days-on-market for RENTAL listings here right now (not sales)? A rising rental-DOM trend means longer vacancies and softer asking-rent achievability than the comps imply.
- What's the recent tenant-quality profile in this submarket — average credit score on applications, eviction rate, late-payment / NSF rate, and stable-employment percentage? A property-management company in the area should have these aggregated.
- How much new for-sale + rental construction is in the pipeline within 1–3 miles? Heavy new supply typically softens prices + rents 12–24 months out; constrained supply supports both.
Investment metrics
- 1% rule
- 0.81% ✗
- Cap rate
- 6.06%
- Cash-on-cash
- -0.84%
- DSCR
- 0.96
- GRM
- 10.3
CMA / ARV
- ARV (on-the-fly)
- $293,592
- Comps found
- 12
Show comp detail 12 sales within ~0.75 mi
| Address | Dist | Beds/Ba | Sqft | Sold | Price | $/sf | Match |
|---|---|---|---|---|---|---|---|
| 510 Winstead Rd | 0.00mi | 3/2.0 | 1,882 (0%) | 1mo | $242,000 | $129 | 99 |
| 506 Cedarhurst Rd | 0.12mi | 3/2.5 | 1,775 (-6%) | 1mo | $325,000 | $183 | 82 |
| 3661 Thornbrook Dr | 0.40mi | 3/2.0 | 1,879 (-0%) | 4mo | $303,000 | $161 | 78 |
| 210 Westhaven Rd | 0.29mi | 3/2.0 | 1,972 (+5%) | 3mo | $265,000 | $134 | 76 |
| 3813 E Baywood Ln | 0.40mi | 3/3.0 | 1,966 (+4%) | 1mo | $345,000 | $175 | 69 |
| 3805 Blarney St | 0.60mi | 3/2.0 | 1,845 (-2%) | 5mo | $331,000 | $179 | 65 |
| 100 Lindenwood Dr | 0.44mi | 3/2.0 | 1,724 (-8%) | 3mo | $252,000 | $146 | 63 |
| 100 Woodstock Dr | 0.54mi | 3/2.0 | 1,752 (-7%) | 3mo | $256,000 | $146 | 60 |
| 107 Woodhaven Rd | 0.44mi | 4/2.5 (+1) | 2,008 (+7%) | 2mo | $243,500 | $121 | 60 |
| 3809 E Baywood Ln | 0.40mi | 3/3.0 | 2,078 (+10%) | 1mo | $355,000 | $171 | 59 |
| 207 Belvedere Dr | 0.57mi | 3/2.0 | 1,695 (-10%) | 4mo | $205,500 | $121 | 53 |
| 107 E Baywood Ln | 0.48mi | 4/2.0 (+1) | 1,600 (-15%) | 7mo | $250,000 | $156 | 42 |
Match score weights: distance 35% · size 25% · config 20% · recency 20%. Top-matched comps best support the ARV.
Projected returns pro-forma
-3.0% appreciation · 5.44% rent growth · sell at horizon
- IRR
- -15.1%
- Equity multiple
- 0.45×
- Total profit
- $-36,249
- Equity at exit
- $35,039
- IRR
- -3.0%
- Equity multiple
- 0.77×
- Total profit
- $-14,813
- Equity at exit
- $20,319
Cash invested: $65,800 (down + closing). Projections, not guarantees.
Landlord ↔ Tenant lean methodology
- Overall (STATE)
- 85 Strongly Landlord-Friendly
- State North Carolina
- 85 Strongly Landlord-Friendly · R+3
- County
- — inherits STATE
- City
- — inherits STATE
ZIP-level market 27834
- Rents YoY
- 5.4%
- Active inventory
- 350
- Price-to-rent
- 10.3×
Monthly cashflow live
- Estimated rent
- $1,898 high interval (Pro) →
- Mortgage (P&I)
- −$1,232
- Tax from tax record
- −$215 /mo · $2,585/yr
- Insurance
- −$98
- HOA
- −$0
- Vacancy / Maint / Mgmt
- −$399
- Net cashflow
- $-46
Break-even live
UW: 25.0% down · 7.5% · 30yr · 1.5% tax · 5.0% vac · 8.0% maint · 8.0% mgmt
Financing live
Cash to close
- Down payment
- $58,750
- Closing costs
- $7,050
- Reserves months
- —
- Total cash needed
- —
Loan-product check · same deal, 3 products live
Conventional
25% down · 7.5% · 30yr
- Down + closing
- —
- Monthly P&I
- —
- Monthly cashflow
- —
- DSCR
- —
- Eligible?
- —
Personal DTI + credit; lowest rate.
DSCR
20% down · 8.5% · 30yr
- Down + closing
- —
- Monthly P&I
- —
- Monthly cashflow
- —
- DSCR
- —
- Eligible?
- —
No personal income docs; deal must DSCR.
Hard money
10% down · 12.0% · 12mo
- Down + closing
- —
- Monthly P&I
- —
- Monthly cashflow
- —
- DSCR
- —
- Eligible?
- —
Short-term bridge; refi at stabilization.
Rent comps 7 comps
| Address | Beds | Baths | Sqft | Rent | $/sqft | DOM | Units | Dist |
|---|---|---|---|---|---|---|---|---|
| 205 South Pointe Dr Unit B Winterville, NC | 3.0 | 2.5 | 1584 | $1,900 | $1.20 | 21d | 1 | 0.38mi |
| 409 Ophelia WAY Winterville, NC | 2.0 | 2.5 | 1852 | $2,170 | $1.17 | 13d | 20 | 0.39mi |
| 207 Belvedere Dr Greenville, NC | 3.0 | 2.0 | 1695 | $2,300 | $1.36 | 21d | 1 | 0.55mi |
| 3278 Colony Ct Greenville, NC | 1.0–3.0 | 1.0–2.0 | 1170 | $1,350 | $1.15 | 21d | 1 | 0.70mi |
| 102 White Oak Dr Greenville, NC | 4.0 | 2.0 | 2406 | $2,600 | $1.08 | 21d | 1 | 0.77mi |
| 3979 Sterling Pointe Dr Unit MMM3 Winterville, NC | 2.0 | 2.5 | 1453 | $1,050 | $0.72 | 21d | 1 | 1.10mi |
| 311 Nantucket Ct Winterville, NC | 3.0 | 2.5 | 1612 | $1,850 | $1.15 | 13d | 1 | 1.29mi |
Listing history 10 events
-
2026-04-29status Pending
-
2026-04-23$235,000 Active
-
2016-04-09historical
-
2015-11-08$154,900
-
2015-09-25historical
-
2015-03-11$164,900
-
2008-05-16soldstatus $158,000
-
2008-05-16soldstatus $158,000
-
2008-04-03$164,000
-
2003-07-01soldstatus $146,500
ⓘ Source: listings_history table (triggers on properties + properties_extension) + one-shot
backfill from property_details.listing_events for pre-trigger history.
Tax reassessment forecast NC · Resets to sale price
- Current annual tax
- $2,585 · $215/mo
- Projected year-2 tax
- $2,585 · $215/mo
- Expected delta
- $0/yr ($0/mo · 0.0%)
ⓘ Screening estimate from a state-policy table — verify with the county assessor before closing.
Climate risk First Street
- Flood 1/10 Low FEMA zone X (unshaded) · 0% chance over 30 yrs
- Wildfire 2/10 Low
- Heat 8/10 Severe 7 d/yr ≥106°F today · 17 d/yr by 30 yrs out
- Wind 8/10 Severe 80% chance of damaging wind over 30 yrs
- Air quality 3/10 Moderate 3 unhealthy d/yr today · 3 by 30 yrs out
Nearby sold comps map
Loading sold comps map…
Walkable amenities ~0.75 mi
Loading nearby amenities…
Taxation est. · year 1
- Rental income
- $22,781
- − Mortgage interest
- −$13,164
- − Property taxes
- −$2,585
- − Insurance
- −$1,175
- − Repairs & maintenance
- −$1,822
- − Management
- −$1,822
- − Depreciation
- −$6,836
- Taxable loss
- −$4,623
- Est. tax savings @ 24.0%
- +$1,110
- After-tax cash flow
- $559/yr
For passive investors: Depreciation is non-cash, so a rental often shows a tax loss while cash-flowing — sheltering income. Rental losses are passive: they offset passive income freely, and up to $25,000/yr can offset ordinary (W-2) income if you actively participate and your MAGI is under $100k (phasing out to $0 by $150k); unused losses carry forward. On sale, claimed depreciation is recaptured at up to 25%, and gains may owe capital-gains tax (a 1031 exchange can defer both). Figures are a year-1 estimate at your 24.0% rate — not tax advice; consult a CPA.
Schools (NCES district)
- District
- Pitt County Schools
- NCES district ID
- 3700012
- Math proficiency
- 41% ▬ 0.00%
- Reading proficiency
- 44% ▲ 2.00%
- Median HH income
- $40,631
- Composite
- 35.67/100
- National rank
- #4877
- State rank
- #100 of 178 in NC
Livability — Greenville
- Score
- 77/100
- State rank
- #30
- US rank
- #2977
Category grades
Schools grade is shown separately in the Schools card above.
Census & demographics
- Census place
- Greenville, NC
- County
- Pitt County · 142,592 people
- City population
- 115,121
- Metro
- Greenville, NC
- Population (ZIP)
- 56,347
- Household income
- $48,935
- Rent vs Own
- Severe rent burden
- 3319.0
Population outlook (Pitt County) Hauer SSP2
- Today (2025)
- 194,585 people
- By 2030
- 203,756 · +4.7%
- By 2040
- 220,807 · +13.5%
- By 2050
- 236,614 · +21.6%
- By 2075
- 275,940 · +41.8%
- By 2100
- 300,058 · +54.2%
Race, ethnicity, and origin ACS 2023
- Neighborhood character
- Diverse neighborhood (Simpson 0.59)
- Race & ethnicity
- Black 54% White 33% Hispanic / Latino 8% Two or more races 3% Asian 2%
- Hispanic origin (detail)
- Mexican 7%
- Common ancestry
- Lithuanian 1% Slovak 1% Romanian 1%
- Foreign-born
- 7% · Canada, China
- Languages at home
- 91% English-only · Spanish 6% Other Asian/Pacific 1%
Political lean MEDSL · Pitt
- 2024 margin
- Lean D (+6.0) · D 52.5% · R 46.5% · Other 1.1%
- 2008→2024 swing
- -2.8pp toward R · 2008: 8.8pp · 2024: 6.0pp
- All cycles
- 2024: D+6.0 2020: D+9.4 2016: D+7.4 2012: D+6.7 2008: D+8.8
Not yet ingested
- Civics
- —
Market trends
- HPI YoY
- ▼ -187.99%
- Current HPI
- 190.6869
- Rent YoY
- ▲ 5.44%
- Metro
- Greenville, NC
- State GDP YoY
- ▲ 3.28%
- F500 in state
- 26
Industry mix (Fortune 500 HQ in NC)
| Industry | F500 HQs | Revenue |
|---|---|---|
| Financial Services | 2 | $213B |
|
||
| Retail | 2 | $95B |
|
||
| Industrial Conglomerate | 1 | $38B |
|
||
| Metals / Steel | 1 | $35B |
|
||
| Utilities | 1 | $30B |
|
||
| Industrial Machinery | 1 | $19B |
|
||
Price history
+60.4% since first listed10 events — show timeline
- 2026-04-29 Pending — Hive MLS
- 2026-04-23 Listed $235,000 Hive MLS
- 2016-04-09 Listing Removed — Hive MLS
- 2015-11-08 Listed $154,900 Hive MLS
- 2015-09-25 Listing Removed — Hive MLS
- 2015-03-11 Listed $164,900 Hive MLS
- 2008-05-16 Sold (Public Records) $158,000 Public Records
- 2008-05-16 Sold (MLS) $158,000 Hive MLS
- 2008-04-03 Listed $164,000 Hive MLS
- 2003-07-01 Sold (Public Records) $146,500 Public Records
Property tax history
+4.6%/yrLatest (2025): $2,585 · +0.5% YoY. Source: county tax records.
Cash-flow waterfall
monthlySold comps — $/sqft
last 12 mo · ≤1 miLoading sold comps…