 Multi-family
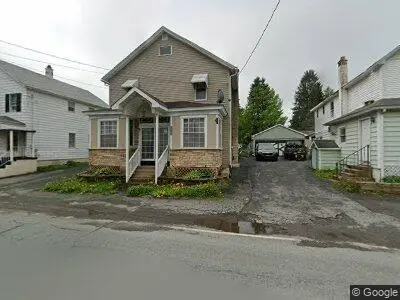
1316 Main St · Browndale, PA
Flood risk 1/10 · Minimal
- FEMA flood zone
- X (unshaded)
- Chance of flooding over 30 yrs
- 0.0%
- Est. flood insurance / yr
- $473 – $860
Fire risk 1/10 · Minimal
- Est. fire insurance / yr
- $511 – $949
Heat risk 2/10 · Minimal
- Hot days now (above 88°F)
- 8 days/yr
- Hot days in 30 yrs
- 18 days/yr
Wind risk 2/10 · Minimal
- Chance of severe wind over 30 yrs
- 2.0%
Air-quality risk 2/10 · Minimal
- Unhealthy air days now
- 1 days/yr
- Unhealthy air days in 30 yrs
- 1 days/yr
Risk factors via First Street. Map © Google.
Why this score? — see what drove the B+ grade
The composite is a weighted blend of 9 inputs, each scored 0–100. Each bar is that input's sub-score; the figure is the points it added to the 100-point composite (weight × sub-score).
- Cash flow +28.9/30.0
- DSCR +10.0/10.0
- Appreciation +10.0/10.0
- 1% rule +7.8/10.0
- ARV discount +7.5/15.0
- Schools +3.6/10.0
- Rent growth +2.5/5.0
- Livability +2.5/5.0
- Condition / age +2.5/5.0
$240,000
🖨 Deal sheet 📄 Offer letter ✓ Due diligence
Multi-family units
County records classify this as Multi-Family (2-4 Unit). Listing-text estimate: 1 unit. estimate disagrees with records
Listing remarks MLS
Take a look at this absolutely beautiful 4 bedroom home tastefully decorated and very well kept. Modern kitchen with island and appliances. Family room with gas fireplace. Enclosed mudroom, 2nd floor laundry area. Privacy fenced in back yard. One car detached garage. Patio Area. Was a two family converted to single family. So much potential with additional rooms on first floor. , Baths: 1 Bath Lev 2,Modern, 2 Half Lev 1, Beds: 2+ Bed 2nd, SqFt Fin - Main: 1411.00, SqFt Fin - 3rd: 0.00, Tax Information: Available, Dining Area: Y, Ultra Modern: Y, SqFt Fin - 2nd: 1060.00
Key facts
- Patio area
- Gas fireplace
- Enclosed mudroom
Tags
Neighborhood map
What this means for you Summary
Snapshot
- This is a 4-bed/1.5-bath multifamily listed at $240k.
Deal economics
- At list price, monthly cash flow is $814 ($10k/yr) — positive.
- The deal already cash-flows at list — no discount required.
- Meets the 1% rule at list price ($3k rent vs $240k).
- Recommended offer: $236k (1.5% below list) — sets the bar for market timing.
Location & tenants
- Location reads: area grade B — affects rentability + tenant quality, not the cash-flow math above.
- Forest City Regional SD (suburban): math 34% / reading 51% proficiency, ranked #308 of 539 in PA (top 57%) — families likely to look elsewhere, expect single-tenant / working-renter base with shorter leases.
- Market conditions: 53 active listings in the ZIP; 177 units permitted in Wayne County in 2024 (0 in 5+ unit buildings).
Forward outlook
- In year one you build about $26k of equity ($2k loan paydown + $24k appreciation (10.0% local appreciation)).
- Wayne County population projected at -17% by 2050 — secular population decline; favor cash flow + early exit over multi-decade hold.
- At projected returns (10.0% appreciation + 3.0% rent growth), your $67k cash investment doubles in ~2 years — after that, you're playing with house money.
- By year 2, paydown + projected appreciation supports a ~$41k cash-out refi (75% LTV) — recoverable capital for the next deal without selling this one.
Negotiation context
- It's been on market 15 days — a 2% lower offer ($236k) is reasonable based on typical stale-listing flexibility.
- Current owner paid $157k; list at $240k implies a 53% gain — meaningful room to come down on a strong offer.
Risks & watch-outs
- Watch-outs: built in 1920 — expect roof / HVAC / electrical / plumbing capex.
Questions for the listing agent
- Built in 1920 — when were the roof, HVAC, electrical panel, plumbing, and water heater last replaced?
- Is there a deadline driving the sale (1031 exchange, divorce, estate, relocation)? That informs how much negotiation room exists.
- What's the average days-on-market for RENTAL listings here right now (not sales)? A rising rental-DOM trend means longer vacancies and softer asking-rent achievability than the comps imply.
- What's the recent tenant-quality profile in this submarket — average credit score on applications, eviction rate, late-payment / NSF rate, and stable-employment percentage? A property-management company in the area should have these aggregated.
- How much new apartment / multifamily construction is in the pipeline within 1–3 miles? Heavy new supply (>2% of stock underway) typically softens rents 12–24 months out; light construction supports rent growth.
Investment metrics
- 1% rule
- 1.28% ✓
- Cap rate
- 10.36%
- Cash-on-cash
- 14.54%
- DSCR
- 1.65
- GRM
- 6.5
CMA / ARV
- ARV (median comp)
- $156,024
- List price
- $240,000
- Delta
- 53.82%
- Verdict
- OVERPRICED
- Comps
- 11 within 1.0 mi
Projected returns pro-forma
10.0% appreciation · 3.0% rent growth · sell at horizon
- IRR
- 35.0%
- Equity multiple
- 3.72×
- Total profit
- $182,589
- Equity at exit
- $216,211
- IRR
- 30.2%
- Equity multiple
- 8.40×
- Total profit
- $496,956
- Equity at exit
- $466,267
Cash invested: $67,200 (down + closing). Projections, not guarantees.
Landlord ↔ Tenant lean methodology
- Overall (STATE)
- 62 Landlord-Friendly
- State Pennsylvania
- 62 Landlord-Friendly · EVEN
- County
- — inherits STATE
- City
- — inherits STATE
ZIP-level market 18421
- Home prices YoY
- 20.9%
- Active inventory
- 53
- Price-to-rent
- 13.0×
Monthly cashflow live
- Estimated rent
- $3,077 medium interval (Pro) →
- Mortgage (P&I)
- −$1,259
- Tax from tax record
- −$258 /mo · $3,096/yr
- Insurance
- −$100
- HOA
- −$0
- Vacancy / Maint / Mgmt
- −$646
- Net cashflow
- $814
Break-even live
2-unit breakdown (identical units grouped — click to expand)
| Units | Beds | Baths | Est. rent |
|---|---|---|---|
| 1× unit | 4 | 2 | $1,539 |
| 1× unit | 4 | 1 | $1,539 |
| Total (2 units) | $3,077 | ||
UW: 25.0% down · 7.5% · 30yr · 1.5% tax · 5.0% vac · 8.0% maint · 8.0% mgmt
Financing live
Cash to close
- Down payment
- $60,000
- Closing costs
- $7,200
- Reserves months
- —
- Total cash needed
- —
Loan-product check · same deal, 3 products live
Conventional
25% down · 7.5% · 30yr
- Down + closing
- —
- Monthly P&I
- —
- Monthly cashflow
- —
- DSCR
- —
- Eligible?
- —
Personal DTI + credit; lowest rate.
DSCR
20% down · 8.5% · 30yr
- Down + closing
- —
- Monthly P&I
- —
- Monthly cashflow
- —
- DSCR
- —
- Eligible?
- —
No personal income docs; deal must DSCR.
Hard money
10% down · 12.0% · 12mo
- Down + closing
- —
- Monthly P&I
- —
- Monthly cashflow
- —
- DSCR
- —
- Eligible?
- —
Short-term bridge; refi at stabilization.
Listing history 5 events
-
2026-05-12$240,000 Active 380-char remark
-
2021-12-01soldstatus $157,000
-
2021-11-29soldstatus $157,000
Show marketing remark (575 chars)
Take a look at this absolutely beautiful 4 bedroom home tastefully decorated and very well kept. Modern kitchen with island and appliances. Family room with gas fireplace. Enclosed mudroom, 2nd floor laundry area. Privacy fenced in back yard. One car detached garage. Patio Area. Was a two family converted to single family. So much potential with additional rooms on first floor. , Baths: 1 Bath Lev 2,Modern, 2 Half Lev 1, Beds: 2+ Bed 2nd, SqFt Fin - Main: 1411.00, SqFt Fin - 3rd: 0.00, Tax Information: Available, Dining Area: Y, Ultra Modern: Y, SqFt Fin - 2nd: 1060.00
-
2019-09-19$149,000
-
1994-08-01soldstatus $27,000
ⓘ Source: listings_history table (triggers on properties + properties_extension) + one-shot
backfill from property_details.listing_events for pre-trigger history.
Tax reassessment forecast PA · Partial reset (capped growth)
- Current annual tax
- $3,096 · $258/mo
- Projected year-2 tax
- $3,444 · $287/mo
- Expected delta
- +$348/yr (+$29/mo · 11.2%)
ⓘ Screening estimate from a state-policy table — verify with the county assessor before closing.
Climate risk First Street
- Flood 1/10 Low FEMA zone X (unshaded) · 0% chance over 30 yrs
- Wildfire 1/10 Low
- Heat 2/10 Low 8 d/yr ≥88°F today · 18 d/yr by 30 yrs out
- Wind 2/10 Low 2% chance of damaging wind over 30 yrs
- Air quality 2/10 Low 1 unhealthy d/yr today · 1 by 30 yrs out
Nearby sold comps map
Loading sold comps map…
Walkable amenities ~0.75 mi
Loading nearby amenities…
Taxation est. · year 1
- Rental income
- $36,924
- − Mortgage interest
- −$13,444
- − Property taxes
- −$3,096
- − Insurance
- −$1,200
- − Repairs & maintenance
- −$2,954
- − Management
- −$2,954
- − Depreciation
- −$6,982
- Taxable income
- $6,294
- Est. tax owed @ 24.0%
- −$1,511
- After-tax cash flow
- $8,260/yr
For passive investors: Depreciation is non-cash, so a rental often shows a tax loss while cash-flowing — sheltering income. Rental losses are passive: they offset passive income freely, and up to $25,000/yr can offset ordinary (W-2) income if you actively participate and your MAGI is under $100k (phasing out to $0 by $150k); unused losses carry forward. On sale, claimed depreciation is recaptured at up to 25%, and gains may owe capital-gains tax (a 1031 exchange can defer both). Figures are a year-1 estimate at your 24.0% rate — not tax advice; consult a CPA.
Schools (NCES district)
- District
- Forest City Regional SD
- NCES district ID
- 4209930
- Math proficiency
- 34% ▼ -17.00%
- Reading proficiency
- 51% ▼ -11.00%
- Median HH income
- $47,744
- Composite
- 36.29/100
- National rank
- #4701
- State rank
- #308 of 539 in PA
Livability — Browndale
No livability data for this city. (Only ~50 U.S. cities are tracked.)
Census & demographics
- Census place
- Browndale, PA
- Population (ZIP)
- 4,475
Population outlook (Wayne County) Hauer SSP2
- Today (2025)
- 47,924 people
- By 2030
- 46,191 · -3.6%
- By 2040
- 42,815 · -10.7%
- By 2050
- 39,873 · -16.8%
- By 2075
- 34,556 · -27.9%
- By 2100
- 28,358 · -40.8%
Race, ethnicity, and origin ACS 2023
- Neighborhood character
- Predominantly White (93%)
- Race & ethnicity
- White 93% Hispanic / Latino 4% Two or more races 3%
- Common ancestry
- Romanian 11% Italian 3% Scotch-Irish 2%
- Foreign-born
- 3% · Canada, Vietnam
- Languages at home
- 97% English-only · Spanish 1% Vietnamese 1% Russian/Polish/Slavic 1%
Political lean MEDSL · Wayne
- 2024 margin
- Solid R (+37.1) · D 31.1% · R 68.2%
- 2008→2024 swing
- -24.8pp toward R · 2008: -12.3pp · 2024: -37.1pp
- All cycles
- 2024: R+37.1 2020: R+33.6 2016: R+39.7 2012: R+20.9 2008: R+12.3
Not yet ingested
- Civics
- —
Market trends
- HPI YoY
- ▲ 48.80%
- Current HPI
- 282.5624
- Rent YoY
- —
- Metro
- —
- State GDP YoY
- ▲ 1.68%
- F500 in state
- 34
Industry mix (Fortune 500 HQ in PA)
| Industry | F500 HQs | Revenue |
|---|---|---|
| Healthcare | 2 | $309B |
|
||
| Insurance | 2 | $27B |
|
||
| Telecommunications / Media | 1 | $124B |
|
||
| Industrial Distribution | 1 | $22B |
|
||
| Financial Services | 1 | $20B |
|
||
| Chemicals / Materials | 1 | $18B |
|
||
Price history
+481.5% since first listed4 events — show timeline
- 2021-12-01 Sold (Public Records) $157,000 Public Records
- 2021-11-29 Sold (MLS) $157,000 GSBR as distributed by MLS GRID
- 2019-09-19 Listed $149,000 GSBR as distributed by MLS GRID
- 1994-08-01 Sold (Public Records) $27,000 Public Records
Property tax history
+5.9%/yrLatest (2026): $3,096 · +3.4% YoY. Source: county tax records.
Cash-flow waterfall
monthlySold comps — $/sqft
last 12 mo · ≤1 miLoading sold comps…