6001 Penway St · Indianapolis city (balance), IN
Flood risk 1/10 · Minimal
- FEMA flood zone
- X (unshaded)
- Chance of flooding over 30 yrs
- 0.0%
- Est. flood insurance / yr
- $507 – $1,088
Fire risk 1/10 · Minimal
- Est. fire insurance / yr
- $717 – $1,331
Heat risk 3/10 · Minor
- Hot days now (above 101°F)
- 7 days/yr
- Hot days in 30 yrs
- 19 days/yr
Wind risk 2/10 · Minimal
- Chance of severe wind over 30 yrs
- —
Air-quality risk 4/10 · Minor
- Unhealthy air days now
- 4 days/yr
- Unhealthy air days in 30 yrs
- 5 days/yr
Risk factors via First Street. Map © Google.
Why this score? — see what drove the D+ grade
The composite is a weighted blend of 9 inputs, each scored 0–100. Each bar is that input's sub-score; the figure is the points it added to the 100-point composite (weight × sub-score).
- Cash flow +16.4/30.0
- ARV discount +13.4/15.0
- DSCR +5.1/10.0
- 1% rule +3.3/10.0
- Rent growth +2.7/5.0
- Livability +2.5/5.0
- Condition / age +2.5/5.0
- Schools +1.4/10.0
- Appreciation +0.0/10.0
$200,000
🖨 Deal sheet (PDF) 📄 Offer letter ✓ Due diligence
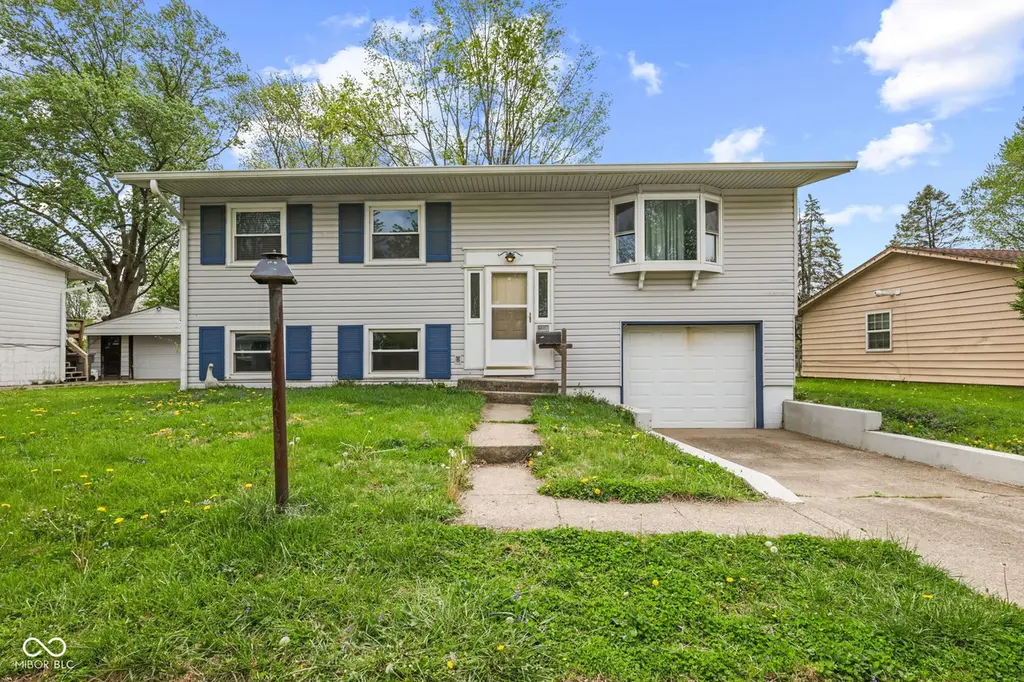
Listing remarks
Charming bi-level home offering 4 bedrooms and 2 updated bathrooms, with comfortable living and dining spaces and a spacious lower-level that can be used as a bedroom or additional family room. Step outside to enjoy a deck installed in 2020, overlooking a large backyard that's fully fenced in and perfect for gatherings, gardening, or play. The laundry room offers extra storage and comes equipped with a washer and new dryer. Recent exterior improvements include a new driveway retaining wall completed in 2024. Conveniently located near schools, shopping, and dining, this home offers a solid combination of space, updates, and functionality with room to make it your own.
Key facts
- Spacious lower-level
- Fully fenced
- Extra storage
Tags
Neighborhood map
What this means for you Summary
Snapshot
- This is a 3-bed/2.0-bath single-family listed at $200k.
Deal economics
- At list price, monthly cash flow is $113 ($1k/yr) — positive.
- The deal already cash-flows at list — no discount required.
- To meet the 1% rule (rent ≥ 1% of price), the offer needs to be $167k (16.7% below list).
- Recommended offer: $167k (16.7% below list) — sets the bar for 1% rule.
- Cap rate 7.0% vs local median 4.4% in Indianapolis city (balance) — top-decile yield for the area; either an underpriced asset or a hidden risk that comps aren't pricing in. Stress-test before assuming the spread holds.
Location & tenants
- Location reads: area grade D — affects rentability + tenant quality, not the cash-flow math above.
- Indianapolis Public Schools (urban): math 14% / reading 20% proficiency, ranked #286 of 301 in IN (top 95%) — low school quality limits family demand, transient renter base, plan for 1-2y turnover; 77% free/reduced lunch — lower-income household profile, screen leases tightly.
- Zoned schools: Meredith Nicholson School 96 (math 8% / reading 12%, grade F, #921 of 994 statewide, top 94%, 358 students, 79% FRL); H L Harshman Middle School (math 3% / reading 16%, grade F, #316 of 330 statewide, top 96%, 549 students, 84% FRL); George Washington High School (math 2% / reading 17%, grade F, #366 of 369 statewide, top 99%, 753 students, 68% FRL) — zoned schools at 77% FRL track the district average.
- Market conditions: Rents flat; 64 active listings in the ZIP; 10 comparable units currently listed for rent nearby; rentals at typical pace (median 16d on market — plan ~3-4 weeks tenant-placement turnaround); 1,906 units permitted in Marion County in 2024 (621 in 5+ unit buildings).
- This rent runs 36% of the median local income ($56k/yr) — at the standard rent-burdened threshold; future hikes will face affordability resistance.
Forward outlook
- Local home prices are declining (-3.0%/yr); year-one equity from $1k of loan paydown is wiped out by about $6k of value loss. Plan a longer hold.
- Marion County population projected at +18% by 2050 — long-run rental-demand tailwind backs the buy-and-hold thesis.
Negotiation context
- Only 3 days on market — expect competitive offers; lowballing is unlikely to land.
Questions for the listing agent
- Built in 1963 — when were the roof, HVAC, electrical panel, plumbing, and water heater last replaced?
- Is there a deadline driving the sale (1031 exchange, divorce, estate, relocation)? That informs how much negotiation room exists.
- The area grade is low — what's the realistic commute time and amenity access for the typical tenant pool here? Any planned neighborhood developments (good or bad) we should know about?
- What's the average days-on-market for RENTAL listings here right now (not sales)? A rising rental-DOM trend means longer vacancies and softer asking-rent achievability than the comps imply.
- What's the recent tenant-quality profile in this submarket — average credit score on applications, eviction rate, late-payment / NSF rate, and stable-employment percentage? A property-management company in the area should have these aggregated.
- How much new for-sale + rental construction is in the pipeline within 1–3 miles? Heavy new supply typically softens prices + rents 12–24 months out; constrained supply supports both.
Investment metrics
- 1% rule
- 0.83% ✗
- Cap rate
- 6.97%
- Cash-on-cash
- 2.42%
- DSCR
- 1.11
- GRM
- 10.0
CMA / ARV
- ARV (on-the-fly)
- $230,136
- Comps found
- 12
Show comp detail 12 sales within ~0.75 mi
| Address | Dist | Beds/Ba | Sqft | Sold | Price | $/sf | Match |
|---|---|---|---|---|---|---|---|
| 6014 Penway Cir | 0.05mi | 4/1.5 (+1) | 1,669 (-6%) | 8mo | $210,000 | $126 | 74 |
| 3991 Bennett Dr | 0.46mi | 3/2.0 | 1,850 (+4%) | 3mo | $147,250 | $80 | 70 |
| 4007 Whitaker Dr | 0.50mi | 4/1.5 (+1) | 1,768 (-1%) | 1mo | $195,000 | $110 | 68 |
| 3514 Clark Rd | 0.20mi | 4/1.5 (+1) | 1,908 (+7%) | 7mo | $185,000 | $97 | 66 |
| 3221 Bluebell Ln | 0.61mi | 3/2.0 | 1,702 (-5%) | 1mo | $220,000 | $129 | 63 |
| 3815 N Lawndale Ave | 0.22mi | 3/2.5 | 1,576 (-12%) | 8mo | $275,000 | $174 | 62 |
| 3811 N Lawndale Ave | 0.22mi | 3/2.5 | 1,576 (-12%) | 8mo | $275,000 | $174 | 61 |
| 3668 Chatsbee Ct | 0.25mi | 4/1.5 (+1) | 2,034 (+14%) | 7mo | $178,000 | $88 | 52 |
| 6117 Ashway Ct | 0.52mi | 4/2.0 (+1) | 1,626 (-9%) | 4mo | $274,900 | $169 | 52 |
| 4025 Sherlock Dr | 0.62mi | 4/3.0 (+1) | 1,733 (-3%) | 7mo | $240,000 | $138 | 52 |
| 3208 Voigt Dr | 0.56mi | 3/1.0 | 1,944 (+9%) | 6mo | $160,000 | $82 | 50 |
| 3231 Thurston Dr | 0.54mi | 4/1.5 (+1) | 1,536 (-14%) | 8mo | $235,000 | $153 | 38 |
Match score weights: distance 35% · size 25% · config 20% · recency 20%. Top-matched comps best support the ARV.
Projected returns pro-forma
-3.0% appreciation · 0.79% rent growth · sell at horizon
- IRR
- -14.7%
- Equity multiple
- 0.48×
- Total profit
- $-28,931
- Equity at exit
- $29,821
- IRR
- -9.7%
- Equity multiple
- 0.46×
- Total profit
- $-30,507
- Equity at exit
- $17,292
Cash invested: $56,000 (down + closing). Projections, not guarantees.
Landlord ↔ Tenant lean methodology
- Overall (STATE)
- 90 Strongly Landlord-Friendly
- State Indiana
- 90 Strongly Landlord-Friendly · R+11
- County
- — inherits STATE
- City
- — inherits STATE
ZIP-level market 46224
- Rents YoY
- 0.8%
- Active inventory
- 64
- Price-to-rent
- 10.0×
Monthly cashflow live
- Estimated rent
- $1,665 high interval (Pro) →
- Mortgage (P&I)
- −$1,049
- Tax from tax record
- −$70 /mo · $846/yr
- Insurance
- −$83
- HOA
- −$0
- Vacancy / Maint / Mgmt
- −$350
- Net cashflow
- $113
Break-even live
Sensitivity live
| Price | -10% $226 | -5% $169 | +0% $113 | +5% $56 | +10% $0 |
|---|---|---|---|---|---|
| Rent | -10% $-19 | -5% $47 | +0% $113 | +5% $179 | +10% $244 |
| Rate | -1.0pp $214 | -0.5pp $164 | base $113 | +0.5pp $61 | +1.0pp $8 |
UW: 25.0% down · 7.5% · 30yr · 1.5% tax · 5.0% vac · 8.0% maint · 8.0% mgmt
Financing live
Cash to close
- Down payment
- $50,000
- Closing costs
- $6,000
- Reserves months
- —
- Total cash needed
- —
Loan-product check · same deal, 3 products live
Conventional
25% down · 7.5% · 30yr
- Down + closing
- —
- Monthly P&I
- —
- Monthly cashflow
- —
- DSCR
- —
- Eligible?
- —
Personal DTI + credit; lowest rate.
DSCR
20% down · 8.5% · 30yr
- Down + closing
- —
- Monthly P&I
- —
- Monthly cashflow
- —
- DSCR
- —
- Eligible?
- —
No personal income docs; deal must DSCR.
Hard money
10% down · 12.0% · 12mo
- Down + closing
- —
- Monthly P&I
- —
- Monthly cashflow
- —
- DSCR
- —
- Eligible?
- —
Short-term bridge; refi at stabilization.
Rent comps 10 comps
| Address | Beds | Baths | Sqft | Rent | $/sqft | DOM | Units | Dist |
|---|---|---|---|---|---|---|---|---|
| 5925 Sunwood Dr Indianapolis, IN | 3.0 | 1.0 | 1479 | $1,600 | $1.08 | 6d | 1 | 0.16mi |
| 5925 Sunwood Dr Indianapolis, IN | 3.0 | 1.0 | 1479 | $1,600 | $1.08 | 22d | 1 | 0.16mi |
| 5801 Sunwood Dr Indianapolis, IN | 4.0 | 2.0 | 1908 | $2,055 | $1.08 | 9d | 1 | 0.25mi |
| 5505 Scarlet Dr Indianapolis, IN | 3.0 | 1.0–1.5 | 883 | $1,669 | $1.89 | 0d | 7 | 0.46mi |
| 3226 Voigt Dr Indianapolis, IN | 3.0 | 1.5 | 1826 | $1,850 | $1.01 | 25d | 1 | 0.52mi |
| 6710 Hollow Run Pl Indianapolis, IN | 1.0–3.0 | 1.0–2.0 | 995 | $2,000 | $2.01 | 9d | 37 | 0.67mi |
| 3338 Tara Ln Indianapolis, IN | 3.0 | 1.5 | 1242 | $1,199 | $0.97 | 45d | 1 | 0.80mi |
| 6340 Commons Dr Indianapolis, IN | 3.0 | 2.5 | 1605 | $1,400 | $0.87 | 45d | 1 | 0.88mi |
| 4366 Fullwood Ct Indianapolis, IN | 3.0 | 2.5 | 1936 | $2,005 | $1.04 | 9d | 1 | 1.06mi |
| 3161 Chrysler St Indianapolis, IN | 4.0 | 1.0 | 1306 | $1,095 | $0.84 | 15d | 1 | 1.34mi |
Listing history 2 events
-
2026-04-20status Pending
-
2026-04-17$200,000 Active
ⓘ Source: listings_history table (triggers on properties + properties_extension) + one-shot
backfill from property_details.listing_events for pre-trigger history.
Tax reassessment forecast IN · Partial reset (capped growth)
- Current annual tax
- $846 · $70/mo
- Projected year-2 tax
- $1,273 · $106/mo
- Expected delta
- +$427/yr (+$36/mo · 50.5%)
ⓘ Screening estimate from a state-policy table — verify with the county assessor before closing.
Climate risk First Street
- Flood 1/10 Low FEMA zone X (unshaded) · 0% chance over 30 yrs
- Wildfire 1/10 Low
- Heat 3/10 Moderate 7 d/yr ≥101°F today · 19 d/yr by 30 yrs out
- Wind 2/10 Low
- Air quality 4/10 Moderate 4 unhealthy d/yr today · 5 by 30 yrs out
Nearby sold comps map
Loading sold comps map…
Walkable amenities ~0.75 mi
Loading nearby amenities…
Taxation est. · year 1
- Rental income
- $19,982
- − Mortgage interest
- −$11,203
- − Property taxes
- −$846
- − Insurance
- −$1,000
- − Repairs & maintenance
- −$1,599
- − Management
- −$1,599
- − Depreciation
- −$5,818
- Taxable loss
- −$2,082
- Est. tax savings @ 24.0%
- +$500
- After-tax cash flow
- $1,854/yr
For passive investors: Depreciation is non-cash, so a rental often shows a tax loss while cash-flowing — sheltering income. Rental losses are passive: they offset passive income freely, and up to $25,000/yr can offset ordinary (W-2) income if you actively participate and your MAGI is under $100k (phasing out to $0 by $150k); unused losses carry forward. On sale, claimed depreciation is recaptured at up to 25%, and gains may owe capital-gains tax (a 1031 exchange can defer both). Figures are a year-1 estimate at your 24.0% rate — not tax advice; consult a CPA.
Schools (NCES district)
- District
- Indianapolis Public Schools
- NCES district ID
- 1804770
- Math proficiency
- 14% ▼ -7.00%
- Reading proficiency
- 20% ▼ -3.00%
- Median HH income
- $32,034
- Composite
- 13.69/100
- National rank
- #9499
- State rank
- #286 of 301 in IN
Livability — Indianapolis city (balance)
No livability data for this city. (Only ~50 U.S. cities are tracked.)
Census & demographics
- Census place
- Indianapolis city (balance), IN
- County
- Marion County · 998,460 people
- City population
- 881,119
- Metro
- Indianapolis-Carmel-Anderson, IN
- Population (ZIP)
- 40,228
- Household income
- $55,986
- Rent vs Own
- Severe rent burden
- 2206.0
Population outlook (Marion County) Hauer SSP2
- Today (2025)
- 1,025,572 people
- By 2030
- 1,065,727 · +3.9%
- By 2040
- 1,141,577 · +11.3%
- By 2050
- 1,208,920 · +17.9%
- By 2075
- 1,367,288 · +33.3%
- By 2100
- 1,438,201 · +40.2%
Race, ethnicity, and origin ACS 2023
- Neighborhood character
- Diverse neighborhood (Simpson 0.69)
- Race & ethnicity
- Black 39% White 33% Hispanic / Latino 23% Two or more races 7% Asian 1%
- Hispanic origin (detail)
- Mexican 14% Dominican 2%
- Common ancestry
- Hispanic 3% Arab 1% Italian 1%
- Foreign-born
- 31% · Canada, Philippines
- Languages at home
- 62% English-only · Spanish 19% French/Haitian/Cajun 5% Arabic 2%
Political lean MEDSL · Marion
- 2024 margin
- Strong D (+27.7) · D 63.0% · R 35.3% · Other 1.7%
- 2008→2024 swing
- -0.7pp no change · 2008: 28.4pp · 2024: 27.7pp
- All cycles
- 2024: D+27.7 2020: D+29.1 2016: D+22.8 2012: D+22.2 2008: D+28.4
Not yet ingested
- Civics
- —
Market trends
- HPI YoY
- ▼ -179.31%
- Current HPI
- 297.7156
- Rent YoY
- ▲ 0.79%
- Metro
- Indianapolis-Carmel-Anderson, IN
- State GDP YoY
- ▲ 2.90%
- F500 in state
- 18
Industry mix (Fortune 500 HQ in IN)
| Industry | F500 HQs | Revenue |
|---|---|---|
| Industrial Machinery | 2 | $37B |
|
||
| Healthcare | 1 | $177B |
|
||
| Pharmaceuticals | 1 | $45B |
|
||
| Metals / Steel | 1 | $18B |
|
||
| Agriculture | 1 | $17B |
|
||
| Packaging | 1 | $12B |
|
||
Price history
2 events — show timeline
- 2026-04-20 Pending — MIBOR as Distributed by MLS Grid
- 2026-04-17 Listed $200,000 MIBOR as Distributed by MLS Grid
Property tax history
+7.6%/yrLatest (2025): $846 · -5.8% YoY. Source: county tax records.
Cash-flow waterfall
monthlySold comps — $/sqft
last 12 mo · ≤1 miLoading sold comps…