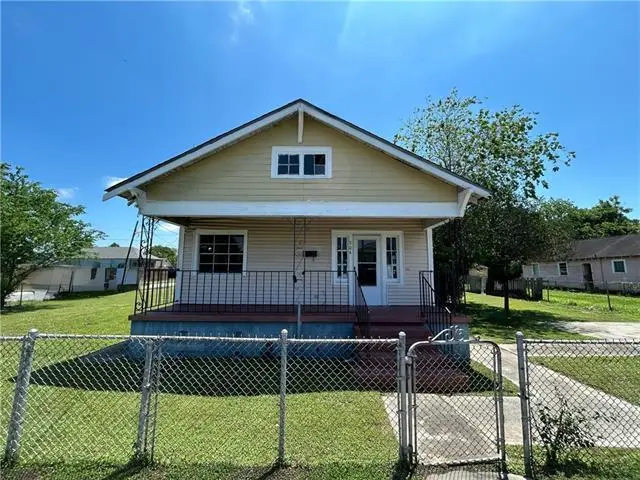
304 Leboeuf St · New Orleans, LA
Flood risk 7/10 · Major
- FEMA flood zone
- X
- Chance of flooding over 30 yrs
- 0.6%
- Est. flood insurance / yr
- $507 – $1,088
Fire risk 1/10 · Minimal
- Est. fire insurance / yr
- $1,269 – $2,357
Heat risk 10/10 · Severe
- Hot days now (above 108°F)
- 7 days/yr
- Hot days in 30 yrs
- 21 days/yr
Wind risk 10/10 · Severe
- Chance of severe wind over 30 yrs
- 99.0%
Air-quality risk 3/10 · Minor
- Unhealthy air days now
- 3 days/yr
- Unhealthy air days in 30 yrs
- 3 days/yr
Risk factors via First Street. Map © Google.
Why this score? — see what drove the C+ grade
The composite is a weighted blend of 9 inputs, each scored 0–100. Each bar is that input's sub-score; the figure is the points it added to the 100-point composite (weight × sub-score).
- Cash flow +23.3/30.0
- ARV discount +15.0/15.0
- DSCR +7.5/10.0
- 1% rule +5.7/10.0
- Livability +4.0/5.0
- Condition / age +2.5/5.0
- Rent growth +2.3/5.0
- Schools +1.6/10.0
- Appreciation +0.0/10.0
$199,900
🖨 Deal sheet 📄 Offer letter ✓ Due diligence
Listing remarks MLS
Opportunity knocking! This spacious raised frame home has a roof that's 2 years old. It also has a covered porch and detached garage and storage. Formal living room and dining connect to the spacious kitchen. Down the hall you'll find the primary bedroom and private full bath plus 2 additional bedrooms and another full bath. There is an roomy indoor laundry and the side hall is big enough for a home office or other space. The best attribute though is the gorgeous 1/4 acre corner lot! You could build 3 of the newer style houses for all the space this lot offers. Located just a couple of blocks from the river and it has several new construction neighbors. You might decide to renovate this well loved home into a more traditional New Orleans style. All possibilities are on the table because this location supports much higher values. There is a wonderfully eclectic restaurant and bar scene just minutes away. Close to Historic Algiers Point, the ferry, the beautiful courthouse and so much history. This could be a beautiful home or a couple of them.
Key facts
- Covered porch
- New construction
- Indoor laundry
Tags
Property features AI
Exterior
- Parking: Detached garage with three or more parking spaces
- Utilities: Public water; Public sewer
- Home design: Single-story home; Shingle roof; Raised foundation; Average condition
- Exterior features: Corner lot; City lot; Rectangular lot; Shed(s)
Interior
- Bathrooms: 2 full bathrooms
- Heating & cooling: Central heating; Central air conditioning
- Interior features: Accessibility features
Neighborhood map
What this means for you Summary
Snapshot
- This is a 3-bed/1.0-bath single-family listed at $200k.
Deal economics
- At list price, monthly cash flow is $298 ($4k/yr) — positive.
- The deal already cash-flows at list — no discount required.
- Meets the 1% rule at list price ($2k rent vs $200k).
- Cap rate 8.5% vs local median 4.4% in New Orleans — top-decile yield for the area; either an underpriced asset or a hidden risk that comps aren't pricing in. Stress-test before assuming the spread holds.
Location & tenants
- Location reads 81/100 on livability (#3 in LA, #1,383 nationally) — a professional / high-income tenant draw. Strengths: amenities A+, commute A+, health & safety A+; Watch: crime C-, employment D.
- Orleans Parish (urban): math 11% / reading 27% proficiency, ranked #69 of 98 in LA (top 70%) — low school quality limits family demand, transient renter base, plan for 1-2y turnover; 68% free/reduced lunch — lower-income household profile, screen leases tightly.
- Market conditions: Rents soft (-0.7%/yr); 265 active listings in the ZIP; 40 comparable units currently listed for rent nearby; rentals at typical pace (median 24d on market — plan ~3-4 weeks tenant-placement turnaround); lower-income renter base — watch delinquency; 710 units permitted in Orleans Parish in 2024 (244 in 5+ unit buildings).
- At $2,144/mo this rent would consume 59% of the median local household income ($43k/yr) (locally 2240% of renters already pay >50% of income on rent) — very limited rent-growth headroom before tenants either downsize or default.
Forward outlook
- Local home prices are declining (-3.0%/yr); year-one equity from $1k of loan paydown is wiped out by about $6k of value loss. Plan a longer hold.
- Orleans County population projected at +61% by 2050 — long-run rental-demand tailwind backs the buy-and-hold thesis.
Negotiation context
- Only 14 days on market — expect competitive offers; lowballing is unlikely to land.
- 4 sale attempts since 23y ago with the ask held roughly flat each time — persistent listings suggest the price (not the market) is what's stuck; bring a comps-based counter.
- Current owner paid $24k; list at $200k implies a 733% gain — meaningful room to come down on a strong offer.
Risks & watch-outs
- Watch-outs: flood insurance adds $66/mo; built in 1950 — expect roof / HVAC / electrical / plumbing capex.
- Climate carrying-cost: major flood risk; severe wind risk, 99% chance of damaging wind over 30y; extreme-heat days projected 7→21/yr by 2055 (HVAC capex compounding) — expect insurance premiums to compound above CPI over the hold.
Questions for the listing agent
- Built in 1950 — when were the roof, HVAC, electrical panel, plumbing, and water heater last replaced?
- What's the actual annual flood-insurance premium (NFIP or private), and is the property in a SFHA with mandatory coverage?
- Is there a deadline driving the sale (1031 exchange, divorce, estate, relocation)? That informs how much negotiation room exists.
- What's the average days-on-market for RENTAL listings here right now (not sales)? A rising rental-DOM trend means longer vacancies and softer asking-rent achievability than the comps imply.
- What's the recent tenant-quality profile in this submarket — average credit score on applications, eviction rate, late-payment / NSF rate, and stable-employment percentage? A property-management company in the area should have these aggregated.
- How much new for-sale + rental construction is in the pipeline within 1–3 miles? Heavy new supply typically softens prices + rents 12–24 months out; constrained supply supports both.
Investment metrics
- 1% rule
- 1.07% ✓
- Cap rate
- 8.48%
- Cash-on-cash
- 7.82%
- DSCR
- 1.35
- GRM
- 7.8
CMA / ARV
- ARV (on-the-fly)
- $374,640
- Comps found
- 12
Show comp detail 12 sales within ~0.75 mi
| Address | Dist | Beds/Ba | Sqft | Sold | Price | $/sf | Match |
|---|---|---|---|---|---|---|---|
| 415 Vallette St | 0.48mi | 3/2.0 | 1,700 (+1%) | 2mo | $379,000 | $223 | 70 |
| 519 Leboeuf St | 0.18mi | 3/2.0 | 1,871 (+11%) | 7mo | $59,000 | $32 | 63 |
| 724 Gallier St | 0.71mi | 3/2.0 | 1,688 (+0%) | 2mo | $280,000 | $166 | 61 |
| 629 Lesseps St | 0.71mi | 3/2.0 | 1,676 (-0%) | 7mo | $227,000 | $135 | 56 |
| 626 Independence St | 0.63mi | 2/2.0 (-1) | 1,696 (+1%) | 10mo | $477,000 | $281 | 52 |
| 422 Red Allen Way | 0.70mi | 3/2.0 | 1,800 (+7%) | 1mo | $440,000 | $244 | 51 |
| 935 Belleville St | 0.65mi | 3/2.0 | 1,847 (+10%) | 2mo | $370,000 | $200 | 48 |
| 820 Eliza St | 0.38mi | 3/3.0 | 1,900 (+13%) | 9mo | $359,000 | $189 | 45 |
| 714 Bartholomew St | 0.69mi | 2/2.0 (-1) | 1,494 (-11%) | 5mo | $425,000 | $284 | 36 |
| 431 Red Allen Way | 0.71mi | 3/2.0 | 1,466 (-13%) | 9mo | $349,900 | $239 | 34 |
| 926 Verret St | 0.69mi | 3/2.0 | 1,431 (-15%) | 6mo | $230,000 | $161 | 34 |
| 717 Nunez St | 0.68mi | 2/2.0 (-1) | 1,453 (-14%) | 6mo | $350,000 | $241 | 32 |
Match score weights: distance 35% · size 25% · config 20% · recency 20%. Top-matched comps best support the ARV.
Projected returns pro-forma
-3.0% appreciation · 0.0% rent growth · sell at horizon
- IRR
- -9.9%
- Equity multiple
- 0.65×
- Total profit
- $-19,623
- Equity at exit
- $29,806
- IRR
- -5.3%
- Equity multiple
- 0.70×
- Total profit
- $-16,720
- Equity at exit
- $17,284
Cash invested: $55,972 (down + closing). Projections, not guarantees.
Landlord ↔ Tenant lean methodology
- Overall (STATE)
- 90 Strongly Landlord-Friendly
- State Louisiana
- 90 Strongly Landlord-Friendly · R+12
- County
- — inherits STATE
- City
- — inherits STATE
ZIP-level market 70114
- Rents YoY
- -0.7%
- Active inventory
- 265
- Price-to-rent
- 7.8×
Monthly cashflow live
- Estimated rent
- $2,144 high interval (Pro) →
- Mortgage (P&I)
- −$1,048
- Tax from tax record
- −$197 /mo · $2,363/yr
- Insurance
- −$83
- Flood insurance flood zone
- −$66 /mo · $798/yr
- HOA
- −$0
- Vacancy / Maint / Mgmt
- −$450
- Net cashflow
- $298
Break-even live
UW: 25.0% down · 7.5% · 30yr · 1.5% tax · 5.0% vac · 8.0% maint · 8.0% mgmt
Financing live
Cash to close
- Down payment
- $49,975
- Closing costs
- $5,997
- Reserves months
- —
- Total cash needed
- —
Loan-product check · same deal, 3 products live
Conventional
25% down · 7.5% · 30yr
- Down + closing
- —
- Monthly P&I
- —
- Monthly cashflow
- —
- DSCR
- —
- Eligible?
- —
Personal DTI + credit; lowest rate.
DSCR
20% down · 8.5% · 30yr
- Down + closing
- —
- Monthly P&I
- —
- Monthly cashflow
- —
- DSCR
- —
- Eligible?
- —
No personal income docs; deal must DSCR.
Hard money
10% down · 12.0% · 12mo
- Down + closing
- —
- Monthly P&I
- —
- Monthly cashflow
- —
- DSCR
- —
- Eligible?
- —
Short-term bridge; refi at stabilization.
Rent comps 40 comps
| Address | Beds | Baths | Sqft | Rent | $/sqft | DOM | Units | Dist |
|---|---|---|---|---|---|---|---|---|
| 335 Whitney Ave New Orleans, LA | 2.0 | 1.0 | 1100 | $1,575 | $1.43 | 24d | 1 | 0.07mi |
| 527 Atlantic Ave New Orleans, LA | 3.0 | 2.0 | 1800 | $2,050 | $1.14 | 24d | 1 | 0.33mi |
| 543 Atlantic Ave New Orleans, LA | 2.0 | 2.5 | 1430 | $2,200 | $1.54 | 24d | 1 | 0.33mi |
| 336 Elmira Ave New Orleans, LA | 3.0 | 1.0 | 1250 | $1,825 | $1.46 | 24d | 1 | 0.34mi |
| 325 Elmira Ave Unit 325 New Orleans, LA | 3.0 | 1.5 | 1050 | $1,525 | $1.45 | 24d | 1 | 0.37mi |
| 807 Whitney Ave Unit 1 New Orleans, LA | 3.0 | 2.0 | 1262 | $1,500 | $1.19 | 3d | 1 | 0.41mi |
| 701 Behrman Ave New Orleans, LA | 3.0 | 2.0 | 1368 | $2,300 | $1.68 | 3d | 1 | 0.42mi |
| 249 Vallette St New Orleans, LA | 4.0 | 2.0 | 1734 | $2,500 | $1.44 | 16d | 1 | 0.49mi |
| 119 Vallette St New Orleans, LA | 3.0 | 2.5 | 1500 | $2,100 | $1.40 | 24d | 1 | 0.50mi |
| 729 Elmira Ave New Orleans, LA | 4.0 | 2.0 | 2000 | $2,000 | $1.00 | 16d | 1 | 0.52mi |
| 3431 Chartres St #6 New Orleans, LA | 2.0 | 2.5 | 1262 | $2,750 | $2.18 | 15d | 1 | 0.61mi |
| 3900 Royal St Unit 2A New Orleans, LA | 2.0 | 2.0 | 1300 | $3,000 | $2.31 | 3d | 1 | 0.63mi |
| 3903 Royal St Unit 3903 New Orleans, LA | 2.0 | 1.0 | 1205 | $1,300 | $1.08 | 15d | 1 | 0.64mi |
| 1108 Sumner St New Orleans, LA | 3.0 | 1.5 | 1197 | $1,500 | $1.25 | 12d | 1 | 0.68mi |
| 625 Louisa St New Orleans, LA | 2.0 | 1.0 | 1162 | $2,400 | $2.07 | 24d | 1 | 0.68mi |
| 311 Delaronde St New Orleans, LA | 2.0 | 1.0 | 1120 | $1,740 | $1.55 | 24d | 1 | 0.70mi |
| 740 Mazant St New Orleans, LA | 2.0 | 2.0 | 1750 | $2,200 | $1.26 | 24d | 1 | 0.71mi |
| 323 Morgan St Unit G New Orleans, LA | 2.0 | 2.5 | 1700 | $2,500 | $1.47 | 44d | 1 | 0.73mi |
| 323 Morgan St Apt E New Orleans, LA | 2.0 | 2.5 | 2000 | $3,600 | $1.80 | 44d | 1 | 0.73mi |
| 323 Morgan St Unit C New Orleans, LA | 2.0 | 2.0 | 2000 | $3,200 | $1.60 | 44d | 1 | 0.73mi |
| 323 Morgan St New Orleans, LA | 2.0 | 2.5 | 2000 | $3,600 | $1.80 | 17d | 1 | 0.73mi |
| 433 Homer St Unit 1 New Orleans, LA | 4.0 | 2.0 | 1570 | $1,850 | $1.18 | 24d | 1 | 0.77mi |
| 522 Montegut St New Orleans, LA | 1.0–2.0 | 1.0–2.0 | 1256 | $3,500 | $2.79 | 2d | 12 | 0.77mi |
| 507 Newton St New Orleans, LA | 2.0 | 2.0 | 1150 | $1,400 | $1.22 | 24d | 1 | 0.79mi |
| 3421 Burgundy St New Orleans, LA | 2.0 | 2.0 | 1120 | $3,000 | $2.68 | 24d | 1 | 0.80mi |
| 606 Drum St New Orleans, LA | 3.0 | 2.0 | 1131 | $2,350 | $2.08 | 24d | 1 | 0.81mi |
| 500 Powder St Unit B New Orleans, LA | 2.0 | 1.0 | 1085 | $1,600 | $1.47 | 24d | 1 | 0.82mi |
| 3134 Burgundy St New Orleans, LA | 3.0 | 2.0 | 1887 | $2,900 | $1.54 | 24d | 1 | 0.85mi |
| 1414 Sumner St New Orleans, LA | 3.0 | 2.0 | 1800 | $1,450 | $0.81 | 16d | 1 | 0.89mi |
| 1402 Behrman Ave New Orleans, LA | 2.0 | 1.0 | 1673 | $1,500 | $0.90 | 24d | 1 | 0.89mi |
| 718 Majestic Pl New Orleans, LA | 3.0 | 2.0 | 1164 | $1,785 | $1.53 | 21d | 1 | 0.90mi |
| 924 Kentucky St New Orleans, LA | 2.0 | 1.0 | 1102 | $1,700 | $1.54 | 3d | 1 | 0.90mi |
| 1140 Teche St Apt B New Orleans, LA | 3.0 | 1.0 | 1100 | $1,850 | $1.68 | 24d | 1 | 0.92mi |
| 882 Montegut St New Orleans, LA | 1.0–3.0 | 1.0–2.0 | 826 | $2,575 | $3.12 | 44d | 7 | 0.94mi |
| 2617 Chartres St New Orleans, LA | 2.0 | 1.5 | 1059 | $2,100 | $1.98 | 24d | 1 | 0.97mi |
| 1119 Bartholomew St Unit 1119 New Orleans, LA | 2.0 | 2.0 | 1410 | $2,500 | $1.77 | 44d | 1 | 0.97mi |
| 3221 Saint Claude Ave New Orleans, LA | 3.0 | 1.0 | 1900 | $1,650 | $0.87 | 24d | 1 | 1.00mi |
| 1034 Montegut St Unit 1034 New Orleans, LA | 2.0 | 2.0 | 1415 | $3,400 | $2.40 | 44d | 1 | 1.06mi |
| 1038 Montegut St New Orleans, LA | 3.0 | 2.5 | 2250 | $4,200 | $1.87 | 24d | 1 | 1.06mi |
| 1038 Montegut St New Orleans, LA | 3.0 | 2.5 | 2250 | $4,200 | $1.87 | 44d | 1 | 1.06mi |
Listing history 11 events
-
2026-06-18days on market $199,900 Active 14 DOM
-
2026-06-17days on market $199,900 Active 13 DOM
-
2026-06-16days on market $199,900 Active 12 DOM
-
2026-06-15days on market $199,900 Active 11 DOM
-
2026-06-13days on market $199,900 Active 9 DOM
-
2026-06-10days on market $199,900 Active 6 DOM
-
2026-06-09days on market $199,900 Active 5 DOM
-
2026-06-08days on market $199,900 Active 4 DOM
-
2026-06-07days on market $199,900 Active 3 DOM
-
2026-06-05remarks 699-char remark
-
2026-06-05$199,900 Active 1 DOM
ⓘ Source: listings_history table (triggers on properties + properties_extension) + one-shot
backfill from property_details.listing_events for pre-trigger history.
Tax reassessment forecast LA · Resets to sale price
- Current annual tax
- $2,363 · $197/mo
- Projected year-2 tax
- $2,363 · $197/mo
- Expected delta
- $0/yr ($0/mo · 0.0%)
ⓘ Screening estimate from a state-policy table — verify with the county assessor before closing.
Climate risk First Street
- Flood 7/10 Severe FEMA zone X · 60% chance over 30 yrs
- Wildfire 1/10 Low
- Heat 10/10 Extreme 7 d/yr ≥108°F today · 21 d/yr by 30 yrs out
- Wind 10/10 Extreme 99% chance of damaging wind over 30 yrs
- Air quality 3/10 Moderate 3 unhealthy d/yr today · 3 by 30 yrs out
Nearby sold comps map
Loading sold comps map…
Walkable amenities ~0.75 mi
Loading nearby amenities…
Taxation est. · year 1
- Rental income
- $25,723
- − Mortgage interest
- −$11,198
- − Property taxes
- −$2,363
- − Insurance
- −$1,797
- − Repairs & maintenance
- −$2,058
- − Management
- −$2,058
- − Depreciation
- −$5,815
- Taxable income
- $435
- Est. tax owed @ 24.0%
- −$104
- After-tax cash flow
- $3,478/yr
For passive investors: Depreciation is non-cash, so a rental often shows a tax loss while cash-flowing — sheltering income. Rental losses are passive: they offset passive income freely, and up to $25,000/yr can offset ordinary (W-2) income if you actively participate and your MAGI is under $100k (phasing out to $0 by $150k); unused losses carry forward. On sale, claimed depreciation is recaptured at up to 25%, and gains may owe capital-gains tax (a 1031 exchange can defer both). Figures are a year-1 estimate at your 24.0% rate — not tax advice; consult a CPA.
Schools (NCES district)
- District
- Orleans Parish
- NCES district ID
- 2201170
- Math proficiency
- 11% ▼ -52.00%
- Reading proficiency
- 27% ▼ -46.00%
- Median HH income
- $37,011
- Composite
- 15.78/100
- National rank
- #9271
- State rank
- #69 of 98 in LA
Livability — New Orleans
- Score
- 81/100
- State rank
- #3
- US rank
- #1383
Category grades
Schools grade is shown separately in the Schools card above.
Census & demographics
- Census place
- New Orleans, LA
- County
- Orleans Parish · 338,817 people
- City population
- 338,817
- Metro
- New Orleans-Metairie, LA
- Population (ZIP)
- 22,659
- Household income
- $43,493
- Rent vs Own
- Severe rent burden
- 2240.0
Population outlook (Orleans County) Hauer SSP2
- Today (2025)
- 513,025 people
- By 2030
- 575,781 · +12.2%
- By 2040
- 700,174 · +36.5%
- By 2050
- 826,541 · +61.1%
- By 2075
- 1,123,374 · +119.0%
- By 2100
- 1,355,609 · +164.2%
Race, ethnicity, and origin ACS 2023
- Neighborhood character
- Predominantly Black (72%)
- Race & ethnicity
- Black 72% White 16% Hispanic / Latino 8% Two or more races 5%
- Hispanic origin (detail)
- Mexican 2% Puerto Rican 1%
- Common ancestry
- Lithuanian 3% Slovak 1% Italian 1%
- Foreign-born
- 5% · Canada
- Languages at home
- 91% English-only · Spanish 6% French/Haitian/Cajun 2% Other Indo-European 1%
Political lean MEDSL · Orleans
- 2024 margin
- Solid D (+67.0) · D 82.2% · R 15.2% · Other 2.7%
- 2008→2024 swing
- +6.7pp toward D · 2008: 60.3pp · 2024: 67.0pp
- All cycles
- 2024: D+67.0 2020: D+68.2 2016: D+66.2 2012: D+62.5 2008: D+60.3
Not yet ingested
- Civics
- —
Market trends
- HPI YoY
- ▼ -98.56%
- Current HPI
- 149.0172
- Rent YoY
- ▼ -0.72%
- Metro
- New Orleans-Metairie, LA
- State GDP YoY
- ▲ 3.29%
- F500 in state
- 10
Industry mix (Fortune 500 HQ in LA)
| Industry | F500 HQs | Revenue |
|---|---|---|
| Telecommunications | 2 | $23B |
|
||
| Utilities | 1 | $12B |
|
||
| Wholesale / Distribution | 1 | $5B |
|
||
| Advertising | 1 | $2B |
|
||
Price history
+328.4% since first listed6 events — show timeline
- 2026-06-04 Listed $199,900 AcadianaMLS
- 2026-06-04 Listed $199,900 GSREIN
- 2003-02-14 Sold (MLS) $24,000 GSREIN
- 2003-01-17 Listed $24,900 AcadianaMLS
- 2003-01-17 Listed $24,900 GSREIN
- 1987-10-02 Sold (Public Records) $46,659 Public Records
Property tax history
+4.6%/yrLatest (2026): $2,363 · +0.0% YoY. Source: county tax records.
Cash-flow waterfall
monthlySold comps — $/sqft
last 12 mo · ≤1 miLoading sold comps…