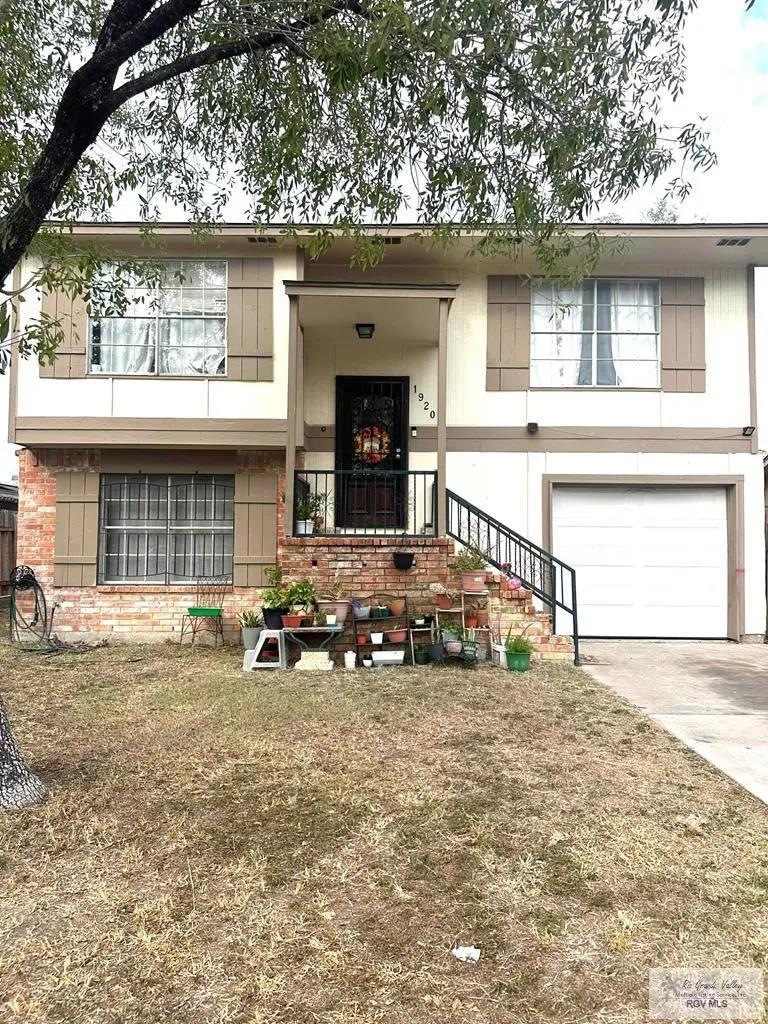
1920 Jay Ave · McAllen, TX
Flood risk 1/10 · Minimal
- FEMA flood zone
- X (shaded)
- Chance of flooding over 30 yrs
- 0.0%
- Est. flood insurance / yr
- $507 – $1,088
Fire risk 1/10 · Minimal
- Est. fire insurance / yr
- $1,222 – $2,270
Heat risk 9/10 · Severe
- Hot days now (above 111°F)
- 7 days/yr
- Hot days in 30 yrs
- 22 days/yr
Wind risk 8/10 · Major
- Chance of severe wind over 30 yrs
- 99.0%
Air-quality risk 2/10 · Minimal
- Unhealthy air days now
- 0 days/yr
- Unhealthy air days in 30 yrs
- 1 days/yr
Risk factors via First Street. Map © Google.
Why this score? — see what drove the D+ grade
The composite is a weighted blend of 9 inputs, each scored 0–100. Each bar is that input's sub-score; the figure is the points it added to the 100-point composite (weight × sub-score).
- Cash flow +16.7/30.0
- ARV discount +10.2/15.0
- DSCR +5.2/10.0
- 1% rule +4.9/10.0
- Livability +3.8/5.0
- Schools +3.3/10.0
- Rent growth +3.1/5.0
- Condition / age +2.5/5.0
- Appreciation +0.0/10.0
$182,000
🖨 Deal sheet (PDF) 📄 Offer letter ✓ Due diligence
Listing remarks MLS
Charming 2 story home features 3 bedrooms 2 baths, in a quiet neighborhood, with lots of amenities close by. Nice open floor plan between livingroom and kitchen for all your holiday family gatherings, home does offer split floor plan with 2 bedrooms 1 bath upstairs and primary bedroom with extra room that can be used as an office downstairs, huge backyard for your with family BBQs, perfect for a growing family or anyone craving space and serenity, with lots of comfort, convenience for everyday living!--don't miss your chance to tour and make this home your own!
Key facts
- Open floor plan
- Split floor plan
- Huge backyard
Tags
Neighborhood map
What this means for you Summary
Snapshot
- This is a 4-bed/2.0-bath single-family listed at $182k.
Deal economics
- At list price, monthly cash flow is $115 ($1k/yr) — positive.
- The deal already cash-flows at list — no discount required.
- To meet the 1% rule (rent ≥ 1% of price), the offer needs to be $180k (1.3% below list).
- Recommended offer: $160k (12.0% below list) — sets the bar for market timing.
- Cap rate 7.0% vs local median 3.7% in McAllen — top-decile yield for the area; either an underpriced asset or a hidden risk that comps aren't pricing in. Stress-test before assuming the spread holds.
Location & tenants
- Location reads 76/100 on livability (#119 in TX, #3,771 nationally) — a middle-class / working-renter tenant base. Strengths: cost of living A+, housing A+, health & safety A+; Watch: employment D, amenities F, commute F.
- Mcallen ISD (urban): math 34% / reading 45% proficiency, ranked #440 of 826 in TX (top 53%) — families likely to look elsewhere, expect single-tenant / working-renter base with shorter leases.
- Zoned schools: Rayburn El (math 47% / reading 47%, grade D-, #1,006 of 4,322 statewide, top 25%, 492 students, 68% FRL); Morris Middle (math 59% / reading 61%, grade B, #158 of 1,662 statewide, top 10%, 1,016 students, 52% FRL); Mcallen H S (math 30% / reading 57%, grade F, #704 of 1,632 statewide, top 43%, 2,133 students, 63% FRL).
- Market conditions: Rents rising (+2.6%/yr); 898 active listings in the ZIP; 32 comparable units currently listed for rent nearby; rentals lingering (median 46d on market — plan ~5-8 weeks vacancy on turnover, expect pricing pressure); 72% of comp listings sitting > 30 days — soft ceiling on asking rent; solid renter incomes; 7,378 units permitted in Hidalgo County in 2024 (641 in 5+ unit buildings).
Forward outlook
- Local home prices are declining (-3.0%/yr); year-one equity from $1k of loan paydown is wiped out by about $5k of value loss. Plan a longer hold.
- Hidalgo County population projected at +28% by 2050 — long-run rental-demand tailwind backs the buy-and-hold thesis.
Negotiation context
- It's been on market 200 days — a 12% lower offer ($160k) is reasonable based on typical stale-listing flexibility.
- 2 sale attempts since 2y ago with the ask held roughly flat each time — persistent listings suggest the price (not the market) is what's stuck; bring a comps-based counter.
- Current owner paid $42k; list at $182k implies a 333% gain — meaningful room to come down on a strong offer.
Risks & watch-outs
- Climate carrying-cost: severe wind risk, 99% chance of damaging wind over 30y; extreme-heat days projected 7→22/yr by 2055 (HVAC capex compounding) — expect insurance premiums to compound above CPI over the hold.
Questions for the listing agent
- It's been on market 200 days. Have you received any prior offers? Is the seller open to a 12% concession, seller financing, or rate buy-down credit?
- Why hasn't it sold? Are there any deal-killer items the seller is aware of (foundation, flood, title, zoning, code violations)?
- Is there a deadline driving the sale (1031 exchange, divorce, estate, relocation)? That informs how much negotiation room exists.
- Schools are B-rated — typically a magnet for longer-tenancy family renters. What's the average tenant stay here, and is there a school-zone premium baked into asking?
- The area grade is low — what's the realistic commute time and amenity access for the typical tenant pool here? Any planned neighborhood developments (good or bad) we should know about?
- What's the average days-on-market for RENTAL listings here right now (not sales)? A rising rental-DOM trend means longer vacancies and softer asking-rent achievability than the comps imply.
- What's the recent tenant-quality profile in this submarket — average credit score on applications, eviction rate, late-payment / NSF rate, and stable-employment percentage? A property-management company in the area should have these aggregated.
- How much new for-sale + rental construction is in the pipeline within 1–3 miles? Heavy new supply typically softens prices + rents 12–24 months out; constrained supply supports both.
Investment metrics
- 1% rule
- 0.99% ✗
- Cap rate
- 7.05%
- Cash-on-cash
- 2.70%
- DSCR
- 1.12
- GRM
- 8.4
CMA / ARV
- ARV (median comp)
- $193,485
- List price
- $182,000
- Delta
- -5.94%
- Verdict
- FAIR
- Comps
- 20 within 1.0 mi
Show comp detail 12 sales within ~0.75 mi
| Address | Dist | Beds/Ba | Sqft | Sold | Price | $/sf | Match |
|---|---|---|---|---|---|---|---|
| 2128 Mynah Ave | 0.30mi | 3/2.0 (-1) | 1,260 (-4%) | 2mo | $222,500 | $177 | 71 |
| 2113 Goldcrest Ave | 0.26mi | 3/2.0 (-1) | 1,361 (+3%) | 8mo | $160,000 | $118 | 70 |
| 6304 N 21st St | 0.10mi | 3/2.5 (-1) | 1,486 (+13%) | 6mo | $189,900 | $128 | 62 |
| 5800 N 26th St | 0.70mi | 4/2.0 | 1,302 (-1%) | 8mo | $199,000 | $153 | 59 |
| 2525 Flamingo Cir | 0.61mi | 3/2.5 (-1) | 1,330 (+1%) | 6mo | $140,000 | $105 | 58 |
| 1404 Nightingale Ave | 0.45mi | 3/2.0 (-1) | 1,457 (+10%) | 3mo | $250,000 | $172 | 54 |
| 4206 N 48th Ln | 0.74mi | 3/2.0 (-1) | 1,337 (+1%) | 9mo | $247,990 | $185 | 51 |
| 2137 Mynah Ave | 0.30mi | 3/2.0 (-1) | 1,499 (+14%) | 10mo | $239,000 | $159 | 50 |
| 5901 N 23rd Ln | 0.43mi | 3/2.0 (-1) | 1,478 (+12%) | 8mo | $160,000 | $108 | 49 |
| 5310 N 24th Ln | 0.62mi | 3/2.0 (-1) | 1,502 (+14%) | 2mo | $200,000 | $133 | 42 |
| 2601 Falcon Ave | 0.73mi | 3/2.5 (-1) | 1,178 (-11%) | 1mo | $199,000 | $169 | 40 |
| 2625 Mynah Ave | 0.71mi | 3/2.0 (-1) | 1,506 (+14%) | 8mo | $195,000 | $129 | 31 |
Match score weights: distance 35% · size 25% · config 20% · recency 20%. Top-matched comps best support the ARV.
Projected returns pro-forma
-3.0% appreciation · 2.57% rent growth · sell at horizon
- IRR
- -12.5%
- Equity multiple
- 0.55×
- Total profit
- $-22,910
- Equity at exit
- $27,137
- IRR
- -4.1%
- Equity multiple
- 0.74×
- Total profit
- $-13,470
- Equity at exit
- $15,736
Cash invested: $50,960 (down + closing). Projections, not guarantees.
Landlord ↔ Tenant lean methodology
- Overall (STATE)
- 87 Strongly Landlord-Friendly
- State Texas
- 87 Strongly Landlord-Friendly · R+5
- County
- — inherits STATE
- City
- — inherits STATE
ZIP-level market 78504
- Home prices YoY
- -29.4%
- Rents YoY
- 2.6%
- Active inventory
- 898
- Price-to-rent
- 8.4×
Monthly cashflow live
- Estimated rent
- $1,796 high interval (Pro) →
- Mortgage (P&I)
- −$954
- Tax from tax record
- −$274 /mo · $3,286/yr
- Insurance
- −$76
- HOA
- −$0
- Vacancy / Maint / Mgmt
- −$377
- Net cashflow
- $115
Break-even live
Sensitivity live
| Price | -10% $218 | -5% $166 | +0% $115 | +5% $63 | +10% $12 |
|---|---|---|---|---|---|
| Rent | -10% $-27 | -5% $44 | +0% $115 | +5% $186 | +10% $256 |
| Rate | -1.0pp $206 | -0.5pp $161 | base $115 | +0.5pp $67 | +1.0pp $19 |
UW: 25.0% down · 7.5% · 30yr · 1.5% tax · 5.0% vac · 8.0% maint · 8.0% mgmt
Financing live
Cash to close
- Down payment
- $45,500
- Closing costs
- $5,460
- Reserves months
- —
- Total cash needed
- —
Loan-product check · same deal, 3 products live
Conventional
25% down · 7.5% · 30yr
- Down + closing
- —
- Monthly P&I
- —
- Monthly cashflow
- —
- DSCR
- —
- Eligible?
- —
Personal DTI + credit; lowest rate.
DSCR
20% down · 8.5% · 30yr
- Down + closing
- —
- Monthly P&I
- —
- Monthly cashflow
- —
- DSCR
- —
- Eligible?
- —
No personal income docs; deal must DSCR.
Hard money
10% down · 12.0% · 12mo
- Down + closing
- —
- Monthly P&I
- —
- Monthly cashflow
- —
- DSCR
- —
- Eligible?
- —
Short-term bridge; refi at stabilization.
Rent comps 32 comps
| Address | Beds | Baths | Sqft | Rent | $/sqft | DOM | Units | Dist |
|---|---|---|---|---|---|---|---|---|
| 6313 N 20th St McAllen, TX | 3.0 | 2.0 | 1326 | $1,550 | $1.17 | 16d | 1 | 0.08mi |
| 5901 N 22nd St McAllen, TX | 3.0 | 1.5 | 1075 | $1,250 | $1.16 | 45d | 1 | 0.29mi |
| 1612 Cardinal Ave McAllen, TX | 3.0 | 2.0 | 1793 | $1,750 | $0.98 | 45d | 1 | 0.47mi |
| 1216 Quail Ave McAllen, TX | 3.0 | 2.0 | 1842 | $1,700 | $0.92 | 45d | 1 | 0.61mi |
| 2625 Mynah Ave McAllen, TX | 3.0 | 2.0 | 1506 | $2,150 | $1.43 | 45d | 1 | 0.71mi |
| 5904 N 28th St McAllen, TX | 3.0 | 2.0 | 1247 | $1,600 | $1.28 | 45d | 1 | 0.77mi |
| 2627 Falcon Ave McAllen, TX | 3.0 | 2.0 | 1604 | $1,800 | $1.12 | 45d | 1 | 0.80mi |
| 7504 N 21st St McAllen, TX | 3.0 | 2.0 | 1746 | $1,800 | $1.03 | 16d | 1 | 0.89mi |
| 3021 Hummingbird Ave McAllen, TX | 3.0 | 2.0 | 1374 | $1,500 | $1.09 | 25d | 1 | 0.95mi |
| 6613 N 5th St McAllen, TX | 3.0 | 2.0 | 1227 | $1,650 | $1.34 | 25d | 1 | 0.98mi |
| 6617 N 5th St McAllen, TX | 3.0 | 2.0 | 1478 | $1,650 | $1.12 | 45d | 1 | 0.98mi |
| 701 Sandpiper Ave Unit 1 McAllen, TX | 3.0 | 2.0 | 1162 | $1,175 | $1.01 | 25d | 1 | 1.00mi |
| 6821 N 5th St McAllen, TX | 3.0 | 3.0 | 1572 | $2,000 | $1.27 | 45d | 1 | 1.01mi |
| 3100 Falcon Ave McAllen, TX | 3.0 | 2.0 | 1381 | $1,600 | $1.16 | 45d | 1 | 1.01mi |
| 2717 Umbrellabird Ave McAllen, TX | 3.0 | 2.0 | 1521 | $1,695 | $1.11 | 45d | 1 | 1.01mi |
| 6820 N 5th St McAllen, TX | 3.0 | 2.0 | 1316 | $1,650 | $1.25 | 45d | 1 | 1.03mi |
| 2629 Warbler Ave McAllen, TX | 3.0 | 2.5 | 1420 | $2,100 | $1.48 | 45d | 1 | 1.04mi |
| 3212 Oriole Ave McAllen, TX | 3.0 | 2.0 | 1543 | $1,850 | $1.20 | 21d | 1 | 1.06mi |
| 5700 N 3rd St Unit 3 McAllen, TX | 3.0 | 2.0 | 1026 | $1,200 | $1.17 | 46d | 1 | 1.21mi |
| 5408 N 35th St McAllen, TX | 3.0 | 2.0 | 1520 | $1,550 | $1.02 | 45d | 1 | 1.24mi |
| 3509 Robin Ave McAllen, TX | 3.0 | 2.0 | 1827 | $1,795 | $0.98 | 16d | 1 | 1.25mi |
| 4405 N 27th St McAllen, TX | 3.0 | 2.0 | 1382 | $1,695 | $1.23 | 46d | 1 | 1.27mi |
| 8101 N 23rd St Unit 29 McAllen, TX | 3.0 | 2.5 | 1600 | $1,900 | $1.19 | 45d | 1 | 1.27mi |
| 8101 N 23rd St Unit 27 McAllen, TX | 3.0 | 2.5 | 1600 | $1,900 | $1.19 | 25d | 1 | 1.27mi |
| 5705 N 36th St Unit 2 McAllen, TX | 3.0 | 2.0 | 1040 | $1,250 | $1.20 | 45d | 1 | 1.28mi |
| 3413 Yucca Ave McAllen, TX | 3.0 | 2.0 | 1236 | $1,500 | $1.21 | 45d | 1 | 1.30mi |
| 204 Canary Ave McAllen, TX | 3.0 | 2.5 | 1705 | $2,800 | $1.64 | 45d | 1 | 1.32mi |
| 5511 N 36th Ln McAllen, TX | 3.0 | 2.0 | 1713 | $2,000 | $1.17 | 45d | 1 | 1.35mi |
| 5407 N 36th Ln McAllen, TX | 3.0 | 2.5 | 1310 | $2,000 | $1.53 | 45d | 1 | 1.37mi |
| 3601 Warbler Ave McAllen, TX | 3.0 | 2.0 | 1568 | $1,500 | $0.96 | 25d | 1 | 1.44mi |
| 5716 N 38th St McAllen, TX | 3.0 | 2.0 | 1026 | $1,400 | $1.36 | 45d | 1 | 1.44mi |
| 2613 Fairmont Ave McAllen, TX | 3.0 | 2.0 | 1735 | $2,000 | $1.15 | 45d | 1 | 1.49mi |
Listing history 20 events
-
2026-06-21days on market $182,000 Active 200 DOM
-
2026-06-18days on market $182,000 Active 197 DOM
-
2026-06-17days on market $182,000 Active 196 DOM
-
2026-06-16days on market $182,000 Active 195 DOM
-
2026-06-15days on market $182,000 Active 194 DOM
-
2026-06-14days on market $182,000 Active 192 DOM
-
2026-06-10days on market $182,000 Active 189 DOM
-
2026-06-09days on market $182,000 Active 188 DOM
-
2026-06-08days on market $182,000 Active 187 DOM
-
2026-06-07days on market $182,000 Active 186 DOM
-
2026-06-05days on market $182,000 Active 183 DOM
-
2026-06-03days on market $182,000 Active 182 DOM
-
2026-06-02days on market $182,000 Active 181 DOM
-
2026-06-01days on market $182,000 Active 180 DOM
-
2026-05-31days on market $182,000 Active 179 DOM
-
2026-05-31days on market $182,000 Active 178 DOM
-
2026-01-06price $182,000 569-char remark
Show marketing remark (569 chars)
Charming 2 story home features 3 bedrooms 2 baths, in a quiet neighborhood, with lots of amenities close by. Nice open floor plan between livingroom and kitchen for all your holiday family gatherings, home does offer split floor plan with 2 bedrooms 1 bath upstairs and primary bedroom with extra room that can be used as an office downstairs, huge backyard for your with family BBQs, perfect for a growing family or anyone craving space and serenity, with lots of comfort, convenience for everyday living!--don't miss your chance to tour and make this home your own!
-
2025-12-03$187,000 Active 569-char remark
Show marketing remark (569 chars)
Charming 2 story home features 3 bedrooms 2 baths, in a quiet neighborhood, with lots of amenities close by. Nice open floor plan between livingroom and kitchen for all your holiday family gatherings, home does offer split floor plan with 2 bedrooms 1 bath upstairs and primary bedroom with extra room that can be used as an office downstairs, huge backyard for your with family BBQs, perfect for a growing family or anyone craving space and serenity, with lots of comfort, convenience for everyday living!--don't miss your chance to tour and make this home your own!
-
2024-07-16$210,000 Active
-
1996-11-02soldstatus $42,000
ⓘ Source: listings_history table (triggers on properties + properties_extension) + one-shot
backfill from property_details.listing_events for pre-trigger history.
Tax reassessment forecast TX · Resets to sale price
- Current annual tax
- $3,286 · $274/mo
- Projected year-2 tax
- $3,331 · $278/mo
- Expected delta
- +$44/yr (+$4/mo · 1.3%)
ⓘ Screening estimate from a state-policy table — verify with the county assessor before closing.
Climate risk First Street
- Flood 1/10 Low FEMA zone X (shaded) · 0% chance over 30 yrs
- Wildfire 1/10 Low
- Heat 9/10 Extreme 7 d/yr ≥111°F today · 22 d/yr by 30 yrs out
- Wind 8/10 Severe 99% chance of damaging wind over 30 yrs
- Air quality 2/10 Low 0 unhealthy d/yr today · 1 by 30 yrs out
Nearby sold comps map
Loading sold comps map…
Walkable amenities ~0.75 mi
Loading nearby amenities…
Taxation est. · year 1
- Rental income
- $21,551
- − Mortgage interest
- −$10,195
- − Property taxes
- −$3,286
- − Insurance
- −$910
- − Repairs & maintenance
- −$1,724
- − Management
- −$1,724
- − Depreciation
- −$5,295
- Taxable loss
- −$1,583
- Est. tax savings @ 24.0%
- +$380
- After-tax cash flow
- $1,755/yr
For passive investors: Depreciation is non-cash, so a rental often shows a tax loss while cash-flowing — sheltering income. Rental losses are passive: they offset passive income freely, and up to $25,000/yr can offset ordinary (W-2) income if you actively participate and your MAGI is under $100k (phasing out to $0 by $150k); unused losses carry forward. On sale, claimed depreciation is recaptured at up to 25%, and gains may owe capital-gains tax (a 1031 exchange can defer both). Figures are a year-1 estimate at your 24.0% rate — not tax advice; consult a CPA.
Schools (NCES district)
- District
- Mcallen ISD
- NCES district ID
- 4829670
- Math proficiency
- 34% ▼ -22.00%
- Reading proficiency
- 45% ▼ -5.00%
- Median HH income
- $40,805
- Composite
- 33.16/100
- National rank
- #5551
- State rank
- #440 of 826 in TX
Livability — McAllen
- Score
- 76/100
- State rank
- #119
- US rank
- #3771
Category grades
Schools grade is shown separately in the Schools card above.
Census & demographics
- Census place
- McAllen, TX
- County
- Hidalgo County · 623,128 people
- City population
- 144,650
- Metro
- McAllen-Edinburg-Mission, TX
- Population (ZIP)
- 63,094
- Household income
- $81,905
- Rent vs Own
- Severe rent burden
- 1468.0
Population outlook (Hidalgo County) Hauer SSP2
- Today (2025)
- 955,232 people
- By 2030
- 1,009,774 · +5.7%
- By 2040
- 1,120,332 · +17.3%
- By 2050
- 1,225,036 · +28.2%
- By 2075
- 1,439,189 · +50.7%
- By 2100
- 1,533,429 · +60.5%
Race, ethnicity, and origin ACS 2023
- Neighborhood character
- Predominantly Hispanic (82%)
- Race & ethnicity
- Hispanic / Latino 82% Two or more races 39% White 11% Asian 5%
- Hispanic origin (detail)
- Mexican 75%
- Common ancestry
- Lithuanian 1% Italian 1%
- Foreign-born
- 24% · Canada, South Korea, Vietnam
- Languages at home
- 34% English-only · Spanish 62% Other Asian/Pacific 1% Tagalog/Filipino 1%
Political lean MEDSL · Hidalgo
- 2024 margin
- Toss-up / Even · D 48.1% · R 51.0%
- 2008→2024 swing
- -41.6pp toward R · 2008: 38.7pp · 2024: -2.9pp
- All cycles
- 2024: R+2.9 2020: D+17.1 2016: D+40.5 2012: D+41.8 2008: D+38.7
Not yet ingested
- Civics
- —
Market trends
- HPI YoY
- ▼ -80.87%
- Current HPI
- 194.1764
- Rent YoY
- ▲ 2.57%
- Metro
- McAllen-Edinburg-Mission, TX
- State GDP YoY
- ▲ 3.95%
- F500 in state
- 110
Industry mix (Fortune 500 HQ in TX)
| Industry | F500 HQs | Revenue |
|---|---|---|
| Energy | 16 | $1,198B |
|
||
| Technology | 5 | $198B |
|
||
| Engineering / Construction | 4 | $72B |
|
||
| Energy Services | 3 | $60B |
|
||
| Utilities | 3 | $41B |
|
||
| Healthcare | 2 | $330B |
|
||
Price history
+333.3% since first listed4 events — show timeline
- 2026-01-06 Price Changed $182,000 RGVMLS
- 2025-12-03 Listed $187,000 RGVMLS
- 2024-07-16 Listed $210,000 MCALLENMLS
- 1996-11-02 Sold (Public Records) $42,000 Public Records
Property tax history
+8.0%/yrLatest (2025): $3,286 · +6.7% YoY. Source: county tax records.
Cash-flow waterfall
monthlySold comps — $/sqft
last 12 mo · ≤1 miLoading sold comps…