8832 E Freeman Ct · Floral City, FL
Flood risk 1/10 · Minimal
- FEMA flood zone
- X (unshaded)
- Chance of flooding over 30 yrs
- 0.0%
- Est. flood insurance / yr
- $507 – $1,088
Fire risk 3/10 · Minor
- Est. fire insurance / yr
- $947 – $1,759
Heat risk 9/10 · Severe
- Hot days now (above 108°F)
- 7 days/yr
- Hot days in 30 yrs
- 23 days/yr
Wind risk 9/10 · Severe
- Chance of severe wind over 30 yrs
- 99.0%
Air-quality risk 1/10 · Minimal
- Unhealthy air days now
- 0 days/yr
- Unhealthy air days in 30 yrs
- 0 days/yr
Risk factors via First Street. Map © Google.
Why this score? — see what drove the B- grade
The composite is a weighted blend of 9 inputs, each scored 0–100. Each bar is that input's sub-score; the figure is the points it added to the 100-point composite (weight × sub-score).
- Cash flow +30.0/30.0
- 1% rule +10.0/10.0
- DSCR +10.0/10.0
- ARV discount +7.5/15.0
- Schools +4.1/10.0
- Livability +3.4/5.0
- Rent growth +2.5/5.0
- Condition / age +2.5/5.0
- Appreciation +0.0/10.0
$59,000
🖨 Deal sheet 📄 Offer letter ✓ Due diligence
Listing remarks MLS
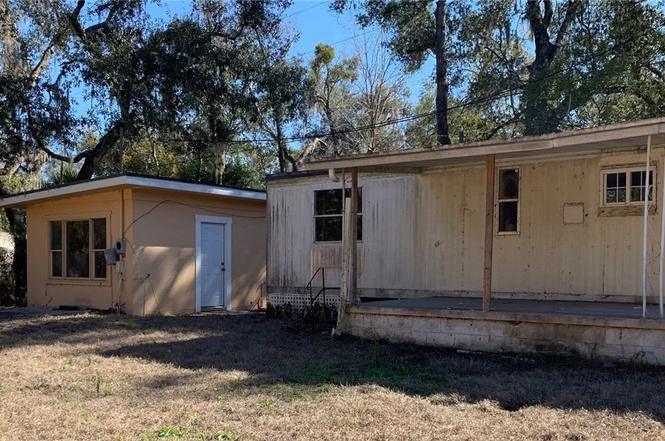
Unlock the potential of this unique property! This affordable opportunity features not just one, but two homes with endless possibilities. The main home, a 2-bedroom, 1.5-bath gem, is a blank canvas just waiting for your creative vision. But that’s not all—there’s also a 1-bedroom, 1-bath block home on the property, offering fantastic income-producing potential or extra space for guests or family. Both homes have public water access, making them as practical as they are promising. Grab your tool belt and imagination—this is your chance to breathe new life into these homes and create something truly special!
Key facts
- Dual-home property
- 5,500 sq ft lot
- Built 1974
Tags
Property features AI
Finance
- Other: Zoning: CLRMH; Lot size approximately 0.13 acres
Exterior
- Parking: Gravel driveway
- Utilities: Public water; Septic tank sewer
- Home design: Manufactured home (single wide); Residential property
- Construction: Metal roof
- Exterior features: Level, rectangular lot; Unimproved road frontage and surface
Interior
- Flooring: Concrete; Wood
- Bathrooms: 1 full bathroom
- Heating & cooling: Central air conditioning
- Interior features: Concrete and wood flooring; No built-in appliances listed
Neighborhood map
What this means for you Summary
Snapshot
- This is a 2-bed/1.5-bath manufactured listed at $59k.
Deal economics
- At list price, monthly cash flow is $530 ($6k/yr) — positive.
- The deal already cash-flows at list — no discount required.
- Meets the 1% rule at list price ($1k rent vs $59k).
- Recommended offer: $52k (12.0% below list) — sets the bar for market timing.
- Cap rate 17.1% vs local median 3.6% in Floral City — top-decile yield for the area; either an underpriced asset or a hidden risk that comps aren't pricing in. Stress-test before assuming the spread holds.
Location & tenants
- Location reads 67/100 on livability (#573 in FL) — a middle-class / working-renter tenant base. Strengths: cost of living A+, housing A+, crime B+; Watch: health & safety C-, amenities F, commute F.
- Citrus (rural): math 49% / reading 50% proficiency, ranked #44 of 73 in FL (top 60%) — families likely to look elsewhere, expect single-tenant / working-renter base with shorter leases.
- Zoned schools: Floral City Elementary School (math 47% / reading 52%, grade D, #1,088 of 2,144 statewide, top 53%, 389 students, 71% FRL); Inverness Middle School (math 52% / reading 48%, grade C, #254 of 571 statewide, top 45%, 1,017 students, 60% FRL); Citrus High School (math 34% / reading 51%, grade F, #264 of 667 statewide, top 41%, 1,503 students, 54% FRL) — zoned schools at 62% FRL track the district average.
- Market conditions: 144 active listings in the ZIP; 2,443 units permitted in Citrus County in 2024 (0 in 5+ unit buildings).
Forward outlook
- Local home prices are declining (-3.0%/yr); year-one equity from $408 of loan paydown is wiped out by about $2k of value loss. Plan a longer hold.
- Citrus County population projected to shrink 10% by 2050 — rents likely to lag national; underwrite the cash flow, not the appreciation.
- At projected returns (-3.0% appreciation + 3.0% rent growth), your $17k cash investment doubles in ~4 years — after that, you're playing with house money.
Negotiation context
- It's been on market 141 days — a 12% lower offer ($52k) is reasonable based on typical stale-listing flexibility.
- 2 sale attempts since 2y ago with the ask held roughly flat each time — persistent listings suggest the price (not the market) is what's stuck; bring a comps-based counter.
- Current owner paid $44k; 36% above their basis — modest negotiation headroom, anchor on the comps not their cost.
Risks & watch-outs
- Climate carrying-cost: severe wind risk, 99% chance of damaging wind over 30y; extreme-heat days projected 7→23/yr by 2055 (HVAC capex compounding) — expect insurance premiums to compound above CPI over the hold.
Questions for the listing agent
- It's been on market 141 days. Have you received any prior offers? Is the seller open to a 12% concession, seller financing, or rate buy-down credit?
- Built in 1974 — when were the roof, HVAC, electrical panel, plumbing, and water heater last replaced?
- Why hasn't it sold? Are there any deal-killer items the seller is aware of (foundation, flood, title, zoning, code violations)?
- Is there a deadline driving the sale (1031 exchange, divorce, estate, relocation)? That informs how much negotiation room exists.
- Schools are D-rated, which usually means shorter tenancies and higher turnover. Who's the typical renter profile here, and what's been the actual vacancy rate?
- What's the average days-on-market for RENTAL listings here right now (not sales)? A rising rental-DOM trend means longer vacancies and softer asking-rent achievability than the comps imply.
- What's the recent tenant-quality profile in this submarket — average credit score on applications, eviction rate, late-payment / NSF rate, and stable-employment percentage? A property-management company in the area should have these aggregated.
- How much new for-sale + rental construction is in the pipeline within 1–3 miles? Heavy new supply typically softens prices + rents 12–24 months out; constrained supply supports both.
Investment metrics
- 1% rule
- 1.97% ✓
- Cap rate
- 17.07%
- Cash-on-cash
- 38.48%
- DSCR
- 2.71
- GRM
- 4.2
CMA / ARV
No comps found within radius.
Projected returns pro-forma
-3.0% appreciation · 3.0% rent growth · sell at horizon
- IRR
- 34.6%
- Equity multiple
- 2.46×
- Total profit
- $24,187
- Equity at exit
- $8,797
- IRR
- 41.4%
- Equity multiple
- 4.91×
- Total profit
- $64,533
- Equity at exit
- $5,101
Cash invested: $16,520 (down + closing). Projections, not guarantees.
Landlord ↔ Tenant lean methodology
- Overall (STATE)
- 87 Strongly Landlord-Friendly
- State Florida
- 87 Strongly Landlord-Friendly · R+3
- County
- — inherits STATE
- City
- — inherits STATE
ZIP-level market 34436
- Home prices YoY
- -3.1%
- Active inventory
- 144
- Price-to-rent
- 4.2×
Monthly cashflow live
- Estimated rent
- $1,163 medium interval (Pro) →
- Mortgage (P&I)
- −$309
- Tax from tax record
- −$55 /mo · $656/yr
- Insurance
- −$25
- HOA
- −$0
- Vacancy / Maint / Mgmt
- −$244
- Net cashflow
- $530
Break-even live
UW: 25.0% down · 7.5% · 30yr · 1.5% tax · 5.0% vac · 8.0% maint · 8.0% mgmt
Financing live
Cash to close
- Down payment
- $14,750
- Closing costs
- $1,770
- Reserves months
- —
- Total cash needed
- —
Loan-product check · same deal, 3 products live
Conventional
25% down · 7.5% · 30yr
- Down + closing
- —
- Monthly P&I
- —
- Monthly cashflow
- —
- DSCR
- —
- Eligible?
- —
Personal DTI + credit; lowest rate.
DSCR
20% down · 8.5% · 30yr
- Down + closing
- —
- Monthly P&I
- —
- Monthly cashflow
- —
- DSCR
- —
- Eligible?
- —
No personal income docs; deal must DSCR.
Hard money
10% down · 12.0% · 12mo
- Down + closing
- —
- Monthly P&I
- —
- Monthly cashflow
- —
- DSCR
- —
- Eligible?
- —
Short-term bridge; refi at stabilization.
Listing history 21 events
-
2026-06-19days on market $59,000 Active 141 DOM
-
2026-06-18days on market $59,000 Active 140 DOM
-
2026-06-17days on market $59,000 Active 139 DOM
-
2026-06-16days on market $59,000 Active 138 DOM
-
2026-06-15days on market $59,000 Active 137 DOM
-
2026-06-14days on market $59,000 Active 135 DOM
-
2026-06-13days on market $59,000 Active 134 DOM
-
2026-06-09days on market $59,000 Active 131 DOM
-
2026-06-08days on market $59,000 Active 130 DOM
-
2026-06-03days on market $59,000 Active 125 DOM
-
2026-06-02days on market $59,000 Active 124 DOM
-
2026-06-01days on market $59,000 Active 123 DOM
-
2026-05-31days on market $59,000 Active 122 DOM
-
2026-05-30days on market $59,000 Active 121 DOM
-
2026-01-29$59,000 Active
-
2025-01-03soldstatus $43,500 Closed 638-char remark
Show marketing remark (638 chars)
Unlock the potential of this unique property! This affordable opportunity features not just one, but two homes with endless possibilities. The main home, a 2-bedroom, 1.5-bath gem, is a blank canvas just waiting for your creative vision. But that’s not all—there’s also a 1-bedroom, 1-bath block home on the property, offering fantastic income-producing potential or extra space for guests or family. Both homes have public water access, making them as practical as they are promising. Grab your tool belt and imagination—this is your chance to breathe new life into these homes and create something truly special!
-
2024-12-08status Pending 638-char remark
Show marketing remark (638 chars)
Unlock the potential of this unique property! This affordable opportunity features not just one, but two homes with endless possibilities. The main home, a 2-bedroom, 1.5-bath gem, is a blank canvas just waiting for your creative vision. But that’s not all—there’s also a 1-bedroom, 1-bath block home on the property, offering fantastic income-producing potential or extra space for guests or family. Both homes have public water access, making them as practical as they are promising. Grab your tool belt and imagination—this is your chance to breathe new life into these homes and create something truly special!
-
2024-12-07$50,000 Active 638-char remark
Show marketing remark (638 chars)
Unlock the potential of this unique property! This affordable opportunity features not just one, but two homes with endless possibilities. The main home, a 2-bedroom, 1.5-bath gem, is a blank canvas just waiting for your creative vision. But that’s not all—there’s also a 1-bedroom, 1-bath block home on the property, offering fantastic income-producing potential or extra space for guests or family. Both homes have public water access, making them as practical as they are promising. Grab your tool belt and imagination—this is your chance to breathe new life into these homes and create something truly special!
-
2002-06-12soldstatus $32,500
-
2002-02-01soldstatus $32,500
-
1987-12-01soldstatus $18,000
ⓘ Source: listings_history table (triggers on properties + properties_extension) + one-shot
backfill from property_details.listing_events for pre-trigger history.
Tax reassessment forecast FL · Resets to sale price
- Current annual tax
- $656 · $55/mo
- Projected year-2 tax
- $656 · $55/mo
- Expected delta
- $0/yr ($0/mo · 0.0%)
ⓘ Screening estimate from a state-policy table — verify with the county assessor before closing.
Climate risk First Street
- Flood 1/10 Low FEMA zone X (unshaded) · 0% chance over 30 yrs
- Wildfire 3/10 Moderate
- Heat 9/10 Extreme 7 d/yr ≥108°F today · 23 d/yr by 30 yrs out
- Wind 9/10 Extreme 99% chance of damaging wind over 30 yrs
- Air quality 1/10 Low 0 unhealthy d/yr today · 0 by 30 yrs out
Nearby sold comps map
Loading sold comps map…
Walkable amenities ~0.75 mi
Loading nearby amenities…
Taxation est. · year 1
- Rental income
- $13,951
- − Mortgage interest
- −$3,305
- − Property taxes
- −$656
- − Insurance
- −$295
- − Repairs & maintenance
- −$1,116
- − Management
- −$1,116
- − Depreciation
- −$1,716
- Taxable income
- $5,746
- Est. tax owed @ 24.0%
- −$1,379
- After-tax cash flow
- $4,978/yr
For passive investors: Depreciation is non-cash, so a rental often shows a tax loss while cash-flowing — sheltering income. Rental losses are passive: they offset passive income freely, and up to $25,000/yr can offset ordinary (W-2) income if you actively participate and your MAGI is under $100k (phasing out to $0 by $150k); unused losses carry forward. On sale, claimed depreciation is recaptured at up to 25%, and gains may owe capital-gains tax (a 1031 exchange can defer both). Figures are a year-1 estimate at your 24.0% rate — not tax advice; consult a CPA.
Schools (NCES district)
- District
- Citrus
- NCES district ID
- 1200270
- Math proficiency
- 49% ▼ -10.00%
- Reading proficiency
- 50% ▼ -6.00%
- Median HH income
- $38,618
- Composite
- 41.28/100
- National rank
- #3519
- State rank
- #44 of 73 in FL
Livability — Floral City
- Score
- 67/100
- State rank
- #573
- US rank
- #10898
Category grades
Schools grade is shown separately in the Schools card above.
Census & demographics
- Census place
- Floral City, FL
- City population
- 8,170
- Population (ZIP)
- 8,170
Population outlook (Citrus County) Hauer SSP2
- Today (2025)
- 138,622 people
- By 2030
- 136,886 · -1.3%
- By 2040
- 132,009 · -4.8%
- By 2050
- 125,196 · -9.7%
- By 2075
- 108,570 · -21.7%
- By 2100
- 84,454 · -39.1%
Race, ethnicity, and origin ACS 2023
- Neighborhood character
- Predominantly White (86%)
- Race & ethnicity
- White 86% Two or more races 5% Hispanic / Latino 4% Black 4% Native American 2%
- Common ancestry
- Lithuanian 4% Italian 4% Iranian 1%
- Foreign-born
- 5% · Canada
- Languages at home
- 93% English-only · Spanish 5% French/Haitian/Cajun 1%
Political lean MEDSL · Citrus
- 2024 margin
- Solid R (+45.9) · D 26.8% · R 72.6%
- 2008→2024 swing
- -29.8pp toward R · 2008: -16.1pp · 2024: -45.9pp
- All cycles
- 2024: R+45.9 2020: R+41.0 2016: R+39.7 2012: R+21.9 2008: R+16.1
Not yet ingested
- Civics
- —
Market trends
- HPI YoY
- ▼ -12.20%
- Current HPI
- 374.4353
- Rent YoY
- —
- Metro
- —
- State GDP YoY
- ▲ 3.28%
- F500 in state
- 36
Industry mix (Fortune 500 HQ in FL)
| Industry | F500 HQs | Revenue |
|---|---|---|
| Industrial Technology | 2 | $29B |
|
||
| Insurance | 2 | $17B |
|
||
| Retail | 1 | $60B |
|
||
| Technology Distribution | 1 | $58B |
|
||
| Homebuilding | 1 | $35B |
|
||
| Technology Manufacturing | 1 | $35B |
|
||
Price history
+227.8% since first listed7 events — show timeline
- 2026-01-29 Listed $59,000 RACC
- 2025-01-03 Sold (MLS) $43,500 RACC
- 2024-12-08 Pending — RACC
- 2024-12-07 Listed $50,000 RACC
- 2002-06-12 Sold (Public Records) $32,500 Public Records
- 2002-02-01 Sold (Public Records) $32,500 Public Records
- 1987-12-01 Sold (Public Records) $18,000 Public Records
Property tax history
+2.6%/yrLatest (2025): $656 · -53.1% YoY. Source: county tax records.
Cash-flow waterfall
monthlySold comps — $/sqft
last 12 mo · ≤1 miLoading sold comps…