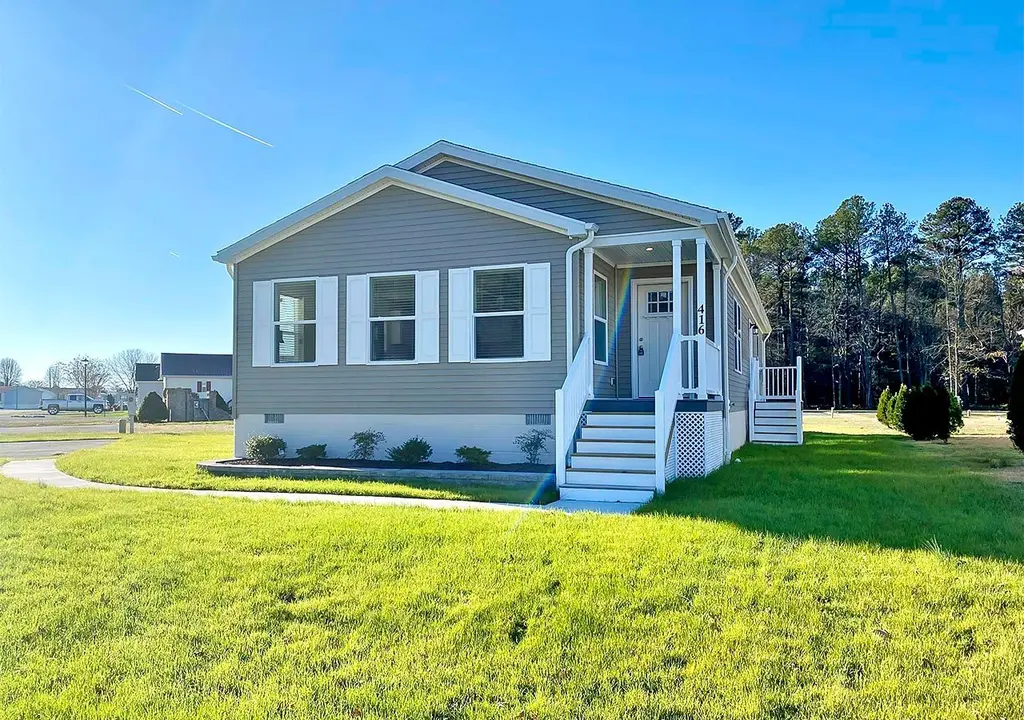
416 Long Branch Rd. Plan · Seaford, DE
Flood risk 1/10 · Minimal
- FEMA flood zone
- X (unshaded)
- Chance of flooding over 30 yrs
- 0.0%
- Est. flood insurance / yr
- $473 – $860
Fire risk 3/10 · Minor
- Est. fire insurance / yr
- $476 – $884
Heat risk 8/10 · Major
- Hot days now (above 105°F)
- 7 days/yr
- Hot days in 30 yrs
- 16 days/yr
Wind risk 6/10 · Moderate
- Chance of severe wind over 30 yrs
- 71.0%
Air-quality risk 3/10 · Minor
- Unhealthy air days now
- 2 days/yr
- Unhealthy air days in 30 yrs
- 2 days/yr
Risk factors via First Street. Map © Google.
Why this score? — see what drove the C grade
The composite is a weighted blend of 9 inputs, each scored 0–100. Each bar is that input's sub-score; the figure is the points it added to the 100-point composite (weight × sub-score).
- Cash flow +18.9/30.0
- ARV discount +14.1/15.0
- DSCR +6.0/10.0
- 1% rule +5.1/10.0
- Condition / age +4.8/5.0
- Livability +3.2/5.0
- Schools +2.8/10.0
- Rent growth +2.5/5.0
- Appreciation +0.0/10.0
$174,995
🖨 Deal sheet 📄 Offer letter ✓ Due diligence
Listing remarks MLS
Just marked down from $199,900 to $174,950! Bright open floor plan with three roomy bedrooms and two full baths. The spacious living room flows into the dining room and gourmet kitchen. Extra countertop space and storage, island with seating space, a breakfast nook, and open floorplan provide a perfect space for hosting friends and family for parties and dinner. Call for more information on this home.
Key facts
- Listed 952 days
Neighborhood map
What this means for you Summary
Snapshot
- This is a 3-bed/2.0-bath manufactured listed at $175k. Condition is rated excellent.
Deal economics
- At list price, monthly cash flow is $181 ($2k/yr) — positive.
- The deal already cash-flows at list — no discount required.
- Meets the 1% rule at list price ($2k rent vs $175k).
- Recommended offer: $154k (12.0% below list) — sets the bar for market timing.
- Cap rate 7.5% vs local median 4.4% in Seaford — top-decile yield for the area; either an underpriced asset or a hidden risk that comps aren't pricing in. Stress-test before assuming the spread holds.
Location & tenants
- Location reads 64/100 on livability (#54 in DE) — a middle-class / working-renter tenant base. Strengths: cost of living A+, housing A+, health & safety A+; Watch: schools C-, employment D, crime F.
- Seaford School District (suburban): math 25% / reading 40% proficiency, ranked #15 of 26 in DE (top 58%) — families likely to look elsewhere, expect single-tenant / working-renter base with shorter leases; 65% free/reduced lunch — lower-income household profile, screen leases tightly.
- Market conditions: 215 active listings in the ZIP; 4,354 units permitted in Sussex County in 2024 (344 in 5+ unit buildings).
Forward outlook
- Local home prices are declining (-3.0%/yr); year-one equity from $1k of loan paydown is wiped out by about $5k of value loss. Plan a longer hold.
- Sussex County population projected at +25% by 2050 — long-run rental-demand tailwind backs the buy-and-hold thesis.
Negotiation context
- It's been on market 953 days — a 12% lower offer ($154k) is reasonable based on typical stale-listing flexibility.
Risks & watch-outs
- Climate carrying-cost: major wind risk, 71% chance of damaging wind over 30y; extreme-heat days projected 7→16/yr by 2055 (HVAC capex compounding) — expect insurance premiums to compound above CPI over the hold.
Questions for the listing agent
- It's been on market 953 days. Have you received any prior offers? Is the seller open to a 12% concession, seller financing, or rate buy-down credit?
- Why hasn't it sold? Are there any deal-killer items the seller is aware of (foundation, flood, title, zoning, code violations)?
- Is there a deadline driving the sale (1031 exchange, divorce, estate, relocation)? That informs how much negotiation room exists.
- Crime grade is F in this area — have there been break-ins, vandalism, or insurance claims at this property in the last 3 years? What carrier currently insures it and at what premium?
- What's the average days-on-market for RENTAL listings here right now (not sales)? A rising rental-DOM trend means longer vacancies and softer asking-rent achievability than the comps imply.
- What's the recent tenant-quality profile in this submarket — average credit score on applications, eviction rate, late-payment / NSF rate, and stable-employment percentage? A property-management company in the area should have these aggregated.
- How much new for-sale + rental construction is in the pipeline within 1–3 miles? Heavy new supply typically softens prices + rents 12–24 months out; constrained supply supports both.
Investment metrics
- 1% rule
- 1.01% ✓
- Cap rate
- 7.53%
- Cash-on-cash
- 4.43%
- DSCR
- 1.20
- GRM
- 8.3
CMA / ARV
- ARV (median comp)
- $205,051
- List price
- $174,995
- Delta
- -14.66%
- Verdict
- UNDERPRICED
- Comps
- 1 within 2.0 mi
Projected returns pro-forma
-3.0% appreciation · 3.0% rent growth · sell at horizon
- IRR
- -9.4%
- Equity multiple
- 0.66×
- Total profit
- $-16,817
- Equity at exit
- $26,092
- IRR
- 0.1%
- Equity multiple
- 1.01×
- Total profit
- $289
- Equity at exit
- $15,130
Cash invested: $48,999 (down + closing). Projections, not guarantees.
Landlord ↔ Tenant lean methodology
- Overall (STATE)
- 70 Landlord-Friendly
- State Delaware
- 70 Landlord-Friendly · D+7
- County
- — inherits STATE
- City
- — inherits STATE
ZIP-level market 19973
- Home prices YoY
- -17.8%
- Active inventory
- 215
- Price-to-rent
- 8.3×
Monthly cashflow live
- Estimated rent
- $1,760 medium interval (Pro) →
- Mortgage (P&I)
- −$918
- Tax est. 1.5%
- −$219 /mo · $2,625/yr
- Insurance
- −$73
- HOA
- −$0
- Vacancy / Maint / Mgmt
- −$370
- Net cashflow
- $181
Break-even live
UW: 25.0% down · 7.5% · 30yr · 1.5% tax · 5.0% vac · 8.0% maint · 8.0% mgmt
Financing live
Cash to close
- Down payment
- $43,749
- Closing costs
- $5,250
- Reserves months
- —
- Total cash needed
- —
Loan-product check · same deal, 3 products live
Conventional
25% down · 7.5% · 30yr
- Down + closing
- —
- Monthly P&I
- —
- Monthly cashflow
- —
- DSCR
- —
- Eligible?
- —
Personal DTI + credit; lowest rate.
DSCR
20% down · 8.5% · 30yr
- Down + closing
- —
- Monthly P&I
- —
- Monthly cashflow
- —
- DSCR
- —
- Eligible?
- —
No personal income docs; deal must DSCR.
Hard money
10% down · 12.0% · 12mo
- Down + closing
- —
- Monthly P&I
- —
- Monthly cashflow
- —
- DSCR
- —
- Eligible?
- —
Short-term bridge; refi at stabilization.
Listing history 16 events
-
2026-06-18days on market $174,995 Active 953 DOM
-
2026-06-17days on market $174,995 Active 952 DOM
-
2026-06-16days on market $174,995 Active 951 DOM
-
2026-06-15days on market $174,995 Active 950 DOM
-
2026-06-13days on market $174,995 Active 948 DOM
-
2026-06-12days on market $174,995 Active 947 DOM
-
2026-06-09days on market $174,995 Active 944 DOM
-
2026-06-08days on market $174,995 Active 943 DOM
-
2026-06-07days on market $174,995 Active 942 DOM
-
2026-06-04days on market $174,995 Active 938 DOM
-
2026-06-02days on market $174,995 Active 937 DOM
-
2026-06-01days on market $174,995 Active 936 DOM
-
2026-05-31days on market $174,995 Active 935 DOM
-
2026-05-31days on market $174,995 Active 934 DOM
-
2024-03-22price $174,995 405-char remark
Show marketing remark (405 chars)
Just marked down from $199,900 to $174,950! Bright open floor plan with three roomy bedrooms and two full baths. The spacious living room flows into the dining room and gourmet kitchen. Extra countertop space and storage, island with seating space, a breakfast nook, and open floorplan provide a perfect space for hosting friends and family for parties and dinner. Call for more information on this home.
-
2023-11-08$199,900 Active 405-char remark
Show marketing remark (405 chars)
Just marked down from $199,900 to $174,950! Bright open floor plan with three roomy bedrooms and two full baths. The spacious living room flows into the dining room and gourmet kitchen. Extra countertop space and storage, island with seating space, a breakfast nook, and open floorplan provide a perfect space for hosting friends and family for parties and dinner. Call for more information on this home.
ⓘ Source: listings_history table (triggers on properties + properties_extension) + one-shot
backfill from property_details.listing_events for pre-trigger history.
Climate risk First Street
- Flood 1/10 Low FEMA zone X (unshaded) · 0% chance over 30 yrs
- Wildfire 3/10 Moderate
- Heat 8/10 Severe 7 d/yr ≥105°F today · 16 d/yr by 30 yrs out
- Wind 6/10 Major 71% chance of damaging wind over 30 yrs
- Air quality 3/10 Moderate 2 unhealthy d/yr today · 2 by 30 yrs out
Nearby sold comps map
Loading sold comps map…
Walkable amenities ~0.75 mi
Loading nearby amenities…
Taxation est. · year 1
- Rental income
- $21,116
- − Mortgage interest
- −$9,802
- − Property taxes
- −$2,625
- − Insurance
- −$875
- − Repairs & maintenance
- −$1,689
- − Management
- −$1,689
- − Depreciation
- −$5,091
- Taxable loss
- −$656
- Est. tax savings @ 24.0%
- +$157
- After-tax cash flow
- $2,327/yr
For passive investors: Depreciation is non-cash, so a rental often shows a tax loss while cash-flowing — sheltering income. Rental losses are passive: they offset passive income freely, and up to $25,000/yr can offset ordinary (W-2) income if you actively participate and your MAGI is under $100k (phasing out to $0 by $150k); unused losses carry forward. On sale, claimed depreciation is recaptured at up to 25%, and gains may owe capital-gains tax (a 1031 exchange can defer both). Figures are a year-1 estimate at your 24.0% rate — not tax advice; consult a CPA.
Condition & rehab AI · 12 photos
This manufactured home is in excellent condition with a modern kitchen, two bathrooms, and hardwood floors. It is move-in ready and has a good curb appeal.
Value-add opportunities
- Resale Painting the exterior siding — Fresh paint can enhance curb appeal and home value
- Resale Landscaping improvements — Enhanced landscaping can attract more buyers
- Both Adding smart home features — Smart home features can increase both resale and rental value
Renovation cost estimate screening
Value-add ROI direction
- Resale Painting the exterior siding — Fresh paint can enhance curb appeal and home value ↑
- Resale Landscaping improvements — Enhanced landscaping can attract more buyers ↑
- Both Adding smart home features — Smart home features can increase both resale and rental value ↑
ⓘ Cost ranges are severity-bucket heuristics (US national rule-of-thumb). Get contractor quotes + a written scope before underwriting a rehab budget.
Schools (NCES district)
- District
- Seaford School District
- NCES district ID
- 1001530
- Math proficiency
- 25% ▼ -18.00%
- Reading proficiency
- 40% ▼ -12.00%
- Median HH income
- $48,427
- Composite
- 28.07/100
- National rank
- #6835
- State rank
- #15 of 26 in DE
Livability — Seaford
- Score
- 64/100
- State rank
- #54
- US rank
- #14448
Category grades
Schools grade is shown separately in the Schools card above.
Census & demographics
- Population (ZIP)
- 25,786
Population outlook (Sussex County) Hauer SSP2
- Today (2025)
- 248,853 people
- By 2030
- 264,464 · +6.3%
- By 2040
- 290,980 · +16.9%
- By 2050
- 311,259 · +25.1%
- By 2075
- 352,488 · +41.6%
- By 2100
- 367,406 · +47.6%
Race, ethnicity, and origin ACS 2023
- Neighborhood character
- Diverse neighborhood (Simpson 0.61)
- Race & ethnicity
- White 58% Black 20% Two or more races 13% Hispanic / Latino 11%
- Hispanic origin (detail)
- Mexican 5% Puerto Rican 1% Dominican 2%
- Common ancestry
- Hispanic 4% Romanian 3% Italian 2%
- Foreign-born
- 9% · Canada, Vietnam
- Languages at home
- 85% English-only · Spanish 8% French/Haitian/Cajun 5% Vietnamese 1%
Political lean MEDSL · Sussex
- 2024 margin
- R (+11.0) · D 43.9% · R 54.9% · Other 1.2%
- 2008→2024 swing
- -2.4pp toward R · 2008: -8.6pp · 2024: -11.0pp
- All cycles
- 2024: R+11.0 2020: R+11.2 2016: R+22.0 2012: R+13.0 2008: R+8.6
Not yet ingested
- Civics
- —
Market trends
- HPI YoY
- ▼ -62.40%
- Current HPI
- 288.5652
- Rent YoY
- —
- Metro
- —
- State GDP YoY
- —
- F500 in state
- 0
Price history
-12.5% since first listed2 events — show timeline
- 2024-03-22 Price Changed $174,995 Zillow
- 2023-11-08 Listed $199,900 Zillow
Cash-flow waterfall
monthlySold comps — $/sqft
last 12 mo · ≤1 miLoading sold comps…