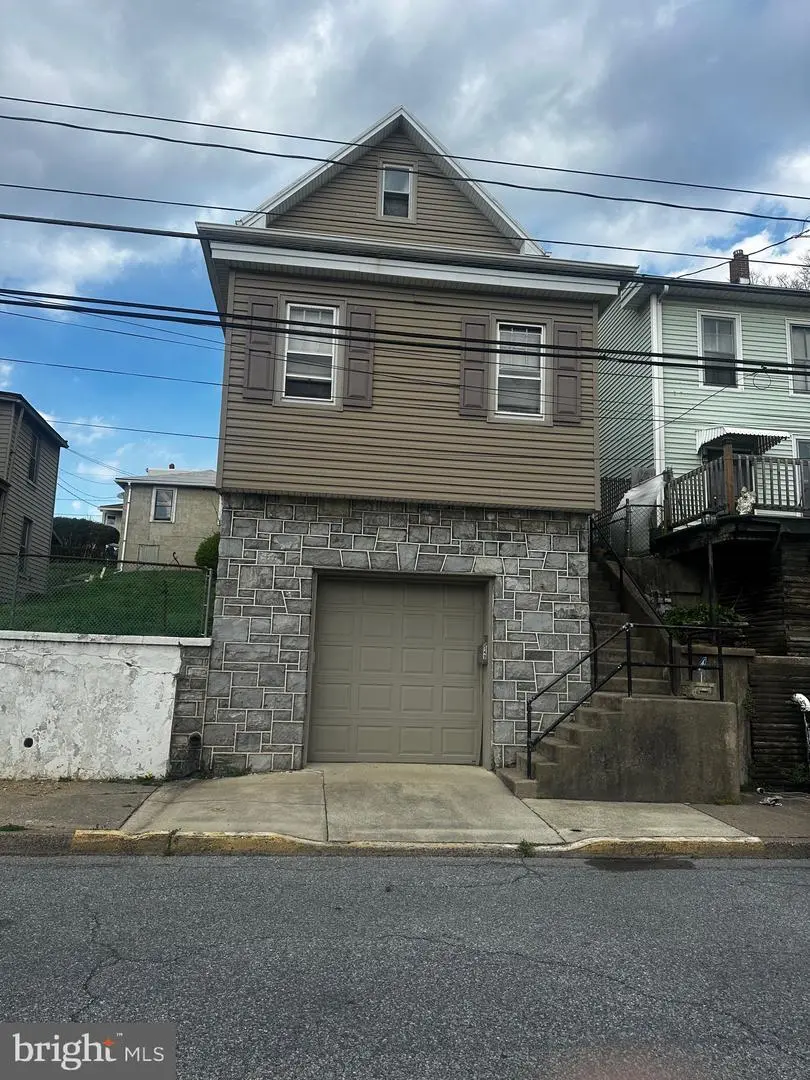
549 N 2nd St · Steelton, PA
Flood risk 6/10 · Moderate
- FEMA flood zone
- X (unshaded)
- Chance of flooding over 30 yrs
- 0.66%
- Est. flood insurance / yr
- $473 – $860
Fire risk 1/10 · Minimal
- Est. fire insurance / yr
- $511 – $949
Heat risk 6/10 · Moderate
- Hot days now (above 100°F)
- 7 days/yr
- Hot days in 30 yrs
- 15 days/yr
Wind risk 3/10 · Minor
- Chance of severe wind over 30 yrs
- 5.0%
Air-quality risk 3/10 · Minor
- Unhealthy air days now
- 3 days/yr
- Unhealthy air days in 30 yrs
- 5 days/yr
Risk factors via First Street. Map © Google.
Why this score? — see what drove the C grade
The composite is a weighted blend of 9 inputs, each scored 0–100. Each bar is that input's sub-score; the figure is the points it added to the 100-point composite (weight × sub-score).
- Cash flow +21.3/30.0
- ARV discount +15.0/15.0
- DSCR +6.8/10.0
- 1% rule +6.3/10.0
- Livability +3.4/5.0
- Rent growth +2.5/5.0
- Condition / age +2.5/5.0
- Schools +0.5/10.0
- Appreciation +0.0/10.0
$139,900
🖨 Deal sheet 📄 Offer letter ✓ Due diligence
Listing remarks
Many updates include siding, roof and some windows. Kitchen and half bath were updated in 2017. Pipes in basement have all been wrapped. Worth a look at this single home with high ceilings and over 2000 sq ft of living space. Bring your ideas and finishing touches but we have both a garage and one of the few homes with off street parking in the rear which accomodates 2-3 vehicles.
Key facts
- Half bath
- Roof
- Kitchen
Tags
Neighborhood map
What this means for you Summary
Snapshot
- This is a 4-bed/1.5-bath single-family listed at $140k.
Deal economics
- At list price, monthly cash flow is $205 ($2k/yr) — positive.
- The deal already cash-flows at list — no discount required.
- Meets the 1% rule at list price ($2k rent vs $140k).
Location & tenants
- Location reads 67/100 on livability (#971 in PA) — a middle-class / working-renter tenant base. Strengths: cost of living A+, housing A+, health & safety A+; Watch: employment C-, crime F, amenities F.
- Steelton-Highspire SD (suburban): math 2% / reading 9% proficiency, ranked #538 of 539 in PA (top 100%) — low school quality limits family demand, transient renter base, plan for 1-2y turnover; 68% free/reduced lunch — lower-income household profile, screen leases tightly.
- Zoned schools: Steelton-Highspire El Sch (math 2% / reading 12%, grade F, #1,491 of 1,518 statewide, top 98%, 738 students, 100% FRL); Steelton-Highspire Hs (math 2% / reading 6%, grade F, #434 of 437 statewide, top 99%, 599 students, 100% FRL) — zoned schools average 100% FRL vs 68% district-wide (32 pts higher); higher-poverty schools than district average — tighter screening recommended.
- Market conditions: 68 active listings in the ZIP; 9 comparable units currently listed for rent nearby; rentals at typical pace (median 14d on market — plan ~3-4 weeks tenant-placement turnaround); 540 units permitted in Dauphin County in 2024 (194 in 5+ unit buildings).
Forward outlook
- Local home prices are declining (-3.0%/yr); year-one equity from $967 of loan paydown is wiped out by about $4k of value loss. Plan a longer hold.
Negotiation context
- Only 6 days on market — expect competitive offers; lowballing is unlikely to land.
- Current owner paid $47k; list at $140k implies a 198% gain — meaningful room to come down on a strong offer.
Risks & watch-outs
- Watch-outs: built in 1900 — expect roof / HVAC / electrical / plumbing capex.
- Climate carrying-cost: major flood risk; extreme-heat days projected 7→15/yr by 2055 (HVAC capex compounding) — expect insurance premiums to compound above CPI over the hold.
Questions for the listing agent
- Built in 1900 — when were the roof, HVAC, electrical panel, plumbing, and water heater last replaced?
- Is there a deadline driving the sale (1031 exchange, divorce, estate, relocation)? That informs how much negotiation room exists.
- Schools are F-rated, which usually means shorter tenancies and higher turnover. Who's the typical renter profile here, and what's been the actual vacancy rate?
- Crime grade is F in this area — have there been break-ins, vandalism, or insurance claims at this property in the last 3 years? What carrier currently insures it and at what premium?
- What's the average days-on-market for RENTAL listings here right now (not sales)? A rising rental-DOM trend means longer vacancies and softer asking-rent achievability than the comps imply.
- What's the recent tenant-quality profile in this submarket — average credit score on applications, eviction rate, late-payment / NSF rate, and stable-employment percentage? A property-management company in the area should have these aggregated.
- How much new for-sale + rental construction is in the pipeline within 1–3 miles? Heavy new supply typically softens prices + rents 12–24 months out; constrained supply supports both.
Investment metrics
- 1% rule
- 1.13% ✓
- Cap rate
- 8.05%
- Cash-on-cash
- 6.28%
- DSCR
- 1.28
- GRM
- 7.4
CMA / ARV
- ARV (on-the-fly)
- $237,000
- Comps found
- 12
Show comp detail 12 sales within ~0.75 mi
| Address | Dist | Beds/Ba | Sqft | Sold | Price | $/sf | Match |
|---|---|---|---|---|---|---|---|
| 549 N 2nd St | 0.00mi | 4/1.5 | 2,064 (+9%) | 1mo | $120,000 | $58 | 85 |
| 643 N Front St | 0.09mi | 5/1.5 (+1) | 2,021 (+7%) | 22mo | $123,700 | $61 | 62 |
| 204 Reading St | 0.48mi | 3/2.5 (-1) | 1,789 (-6%) | 8mo | $295,900 | $165 | 53 |
| 711 Pine St | 0.71mi | 3/1.0 (-1) | 1,867 (-2%) | 6mo | $225,000 | $121 | 52 |
| 629 Pine St | 0.65mi | 4/1.5 | 1,798 (-5%) | 12mo | $224,000 | $125 | 51 |
| 210 Reading St | 0.46mi | 4/2.0 | 1,690 (-11%) | 12mo | $236,000 | $140 | 48 |
| 580 Bessemer St | 0.52mi | 3/2.0 (-1) | 1,808 (-5%) | 17mo | $220,000 | $122 | 46 |
| 218 Elm St | 0.66mi | 5/3.0 (+1) | 1,971 (+4%) | 6mo | $285,000 | $145 | 46 |
| 359 Locust St | 0.53mi | 5/1.0 (+1) | 2,176 (+15%) | 9mo | $115,000 | $53 | 36 |
| 704 Pine St | 0.74mi | 3/1.0 (-1) | 1,756 (-7%) | 17mo | $213,000 | $121 | 32 |
| 508 Orchard Dr | 0.72mi | 3/1.0 (-1) | 1,640 (-14%) | 15mo | $275,000 | $168 | 24 |
| 500 Walnut Rd | 0.67mi | 3/2.0 (-1) | 2,130 (+12%) | 22mo | $290,000 | $136 | 23 |
Match score weights: distance 35% · size 25% · config 20% · recency 20%. Top-matched comps best support the ARV.
Projected returns pro-forma
-3.0% appreciation · 3.0% rent growth · sell at horizon
- IRR
- -6.6%
- Equity multiple
- 0.76×
- Total profit
- $-9,544
- Equity at exit
- $20,860
- IRR
- 3.1%
- Equity multiple
- 1.22×
- Total profit
- $8,793
- Equity at exit
- $12,096
Cash invested: $39,172 (down + closing). Projections, not guarantees.
Landlord ↔ Tenant lean methodology
- Overall (STATE)
- 62 Landlord-Friendly
- State Pennsylvania
- 62 Landlord-Friendly · EVEN
- County
- — inherits STATE
- City
- — inherits STATE
ZIP-level market 17113
- Home prices YoY
- -16.3%
- Active inventory
- 68
- Price-to-rent
- 7.4×
Monthly cashflow live
- Estimated rent
- $1,584 high interval (Pro) →
- Mortgage (P&I)
- −$734
- Tax from tax record
- −$255 /mo · $3,058/yr
- Insurance
- −$58
- HOA
- −$0
- Vacancy / Maint / Mgmt
- −$333
- Net cashflow
- $205
Break-even live
UW: 25.0% down · 7.5% · 30yr · 1.5% tax · 5.0% vac · 8.0% maint · 8.0% mgmt
Financing live
Cash to close
- Down payment
- $34,975
- Closing costs
- $4,197
- Reserves months
- —
- Total cash needed
- —
Loan-product check · same deal, 3 products live
Conventional
25% down · 7.5% · 30yr
- Down + closing
- —
- Monthly P&I
- —
- Monthly cashflow
- —
- DSCR
- —
- Eligible?
- —
Personal DTI + credit; lowest rate.
DSCR
20% down · 8.5% · 30yr
- Down + closing
- —
- Monthly P&I
- —
- Monthly cashflow
- —
- DSCR
- —
- Eligible?
- —
No personal income docs; deal must DSCR.
Hard money
10% down · 12.0% · 12mo
- Down + closing
- —
- Monthly P&I
- —
- Monthly cashflow
- —
- DSCR
- —
- Eligible?
- —
Short-term bridge; refi at stabilization.
Rent comps 9 comps
| Address | Beds | Baths | Sqft | Rent | $/sqft | DOM | Units | Dist |
|---|---|---|---|---|---|---|---|---|
| 508 N 2nd St Steelton, PA | 3.0 | 1.5 | 1360 | $1,450 | $1.07 | 14d | 1 | 0.08mi |
| 316 N 2nd St Steelton, PA | 3.0 | 1.5 | 1524 | $1,600 | $1.05 | 14d | 1 | 0.21mi |
| 314 Lincoln St Steelton, PA | 3.0 | 1.0 | 1264 | $1,595 | $1.26 | 14d | 1 | 0.37mi |
| 465 Sunday Dr Harrisburg, PA | 3.0 | 2.5 | 1540 | $1,895 | $1.23 | 14d | 1 | 1.01mi |
| 1728 Paxton St Harrisburg, PA | 3.0 | 1.5 | 1320 | $1,295 | $0.98 | 14d | 1 | 1.24mi |
| 640 S 2nd St Steelton, PA | 3.0 | 1.5 | 1290 | $1,400 | $1.09 | 23d | 1 | 1.30mi |
| 420 7th St New Cumberland, PA | 3.0 | 1.5 | 1800 | $1,495 | $0.83 | 23d | 1 | 1.43mi |
| 649 S 23rd St Harrisburg, PA | 3.0 | 1.0 | 1450 | $1,465 | $1.01 | 21d | 1 | 1.49mi |
| 649 S 23rd St Unit 1 Harrisburg, PA | 3.0 | 1.0 | 1450 | $1,465 | $1.01 | 43d | 1 | 1.49mi |
Listing history 3 events
-
2026-04-13status Pending
-
2026-04-06$139,900 Active
-
1984-10-24soldstatus $47,000
ⓘ Source: listings_history table (triggers on properties + properties_extension) + one-shot
backfill from property_details.listing_events for pre-trigger history.
Tax reassessment forecast PA · Partial reset (capped growth)
- Current annual tax
- $3,058 · $255/mo
- Projected year-2 tax
- $3,058 · $255/mo
- Expected delta
- $0/yr ($0/mo · 0.0%)
ⓘ Screening estimate from a state-policy table — verify with the county assessor before closing.
Climate risk First Street
- Flood 6/10 Major FEMA zone X (unshaded) · 66% chance over 30 yrs
- Wildfire 1/10 Low
- Heat 6/10 Major 7 d/yr ≥100°F today · 15 d/yr by 30 yrs out
- Wind 3/10 Moderate 5% chance of damaging wind over 30 yrs
- Air quality 3/10 Moderate 3 unhealthy d/yr today · 5 by 30 yrs out
Nearby sold comps map
Loading sold comps map…
Walkable amenities ~0.75 mi
Loading nearby amenities…
Taxation est. · year 1
- Rental income
- $19,013
- − Mortgage interest
- −$7,837
- − Property taxes
- −$3,058
- − Insurance
- −$700
- − Repairs & maintenance
- −$1,521
- − Management
- −$1,521
- − Depreciation
- −$4,070
- Taxable income
- $307
- Est. tax owed @ 24.0%
- −$74
- After-tax cash flow
- $2,385/yr
For passive investors: Depreciation is non-cash, so a rental often shows a tax loss while cash-flowing — sheltering income. Rental losses are passive: they offset passive income freely, and up to $25,000/yr can offset ordinary (W-2) income if you actively participate and your MAGI is under $100k (phasing out to $0 by $150k); unused losses carry forward. On sale, claimed depreciation is recaptured at up to 25%, and gains may owe capital-gains tax (a 1031 exchange can defer both). Figures are a year-1 estimate at your 24.0% rate — not tax advice; consult a CPA.
Schools (NCES district)
- District
- Steelton-Highspire SD
- NCES district ID
- 4222800
- Math proficiency
- 2% ▼ -4.00%
- Reading proficiency
- 9% ▼ -12.00%
- Median HH income
- $40,685
- Composite
- 4.98/100
- National rank
- #10040
- State rank
- #538 of 539 in PA
Livability — Steelton
- Score
- 67/100
- State rank
- #971
- US rank
- #10606
Category grades
Schools grade is shown separately in the Schools card above.
Census & demographics
- Census place
- Steelton, PA
- County
- Dauphin County · 247,857 people
- City population
- 19,401
- Metro
- Harrisburg-Carlisle, PA
- Population (ZIP)
- 11,724
- Household income
- $68,244
- Rent vs Own
- Severe rent burden
- 338.0
Population outlook (Dauphin County) Hauer SSP2
- Today (2025)
- 281,628 people
- By 2030
- 283,549 · +0.7%
- By 2040
- 285,385 · +1.3%
- By 2050
- 286,188 · +1.6%
- By 2075
- 291,053 · +3.3%
- By 2100
- 282,374 · +0.3%
Race, ethnicity, and origin ACS 2023
- Neighborhood character
- Diverse neighborhood (Simpson 0.67)
- Race & ethnicity
- White 48% Hispanic / Latino 24% Black 22% Two or more races 19% Native American 2% Asian 2%
- Hispanic origin (detail)
- Mexican 7% Puerto Rican 11% Cuban 2%
- Common ancestry
- Romanian 1% Lithuanian 1% Iranian 1%
- Foreign-born
- 7% · Canada, India
- Languages at home
- 80% English-only · Spanish 17% Other Indo-European 1% Russian/Polish/Slavic 1%
Political lean MEDSL · Dauphin
- 2024 margin
- Lean D (+5.9) · D 52.4% · R 46.5% · Other 1.1%
- 2008→2024 swing
- -3.1pp toward R · 2008: 9.1pp · 2024: 5.9pp
- All cycles
- 2024: D+5.9 2020: D+8.5 2016: D+2.8 2012: D+6.0 2008: D+9.1
Not yet ingested
- Civics
- —
Market trends
- HPI YoY
- ▼ -54.73%
- Current HPI
- 281.6906
- Rent YoY
- —
- Metro
- Harrisburg-Carlisle, PA
- State GDP YoY
- ▲ 1.68%
- F500 in state
- 34
Industry mix (Fortune 500 HQ in PA)
| Industry | F500 HQs | Revenue |
|---|---|---|
| Healthcare | 2 | $309B |
|
||
| Insurance | 2 | $27B |
|
||
| Telecommunications / Media | 1 | $124B |
|
||
| Industrial Distribution | 1 | $22B |
|
||
| Financial Services | 1 | $20B |
|
||
| Chemicals / Materials | 1 | $18B |
|
||
Price history
+197.7% since first listed3 events — show timeline
- 2026-04-13 Pending — BRIGHT MLS
- 2026-04-06 Listed $139,900 BRIGHT MLS
- 1984-10-24 Sold (Public Records) $47,000 Public Records
Property tax history
+1.2%/yrLatest (2026): $3,058 · +7.2% YoY. Source: county tax records.
Cash-flow waterfall
monthlySold comps — $/sqft
last 12 mo · ≤1 miLoading sold comps…