155 County Rd · Burnside, KY
Flood risk 1/10 · Minimal
- FEMA flood zone
- X (unshaded)
- Chance of flooding over 30 yrs
- 0.0%
- Est. flood insurance / yr
- $507 – $1,088
Fire risk 5/10 · Moderate
- Est. fire insurance / yr
- $839 – $1,559
Heat risk 4/10 · Minor
- Hot days now (above 102°F)
- 7 days/yr
- Hot days in 30 yrs
- 20 days/yr
Wind risk 2/10 · Minimal
- Chance of severe wind over 30 yrs
- 4.0%
Air-quality risk 1/10 · Minimal
- Unhealthy air days now
- 0 days/yr
- Unhealthy air days in 30 yrs
- 0 days/yr
Risk factors via First Street. Map © Google.
Why this score? — see what drove the C grade
The composite is a weighted blend of 9 inputs, each scored 0–100. Each bar is that input's sub-score; the figure is the points it added to the 100-point composite (weight × sub-score).
- Cash flow +19.9/30.0
- Appreciation +7.6/10.0
- ARV discount +7.5/15.0
- DSCR +6.3/10.0
- 1% rule +5.3/10.0
- Schools +4.0/10.0
- Livability +3.6/5.0
- Rent growth +2.5/5.0
- Condition / age +2.5/5.0
$129,900
🖨 Deal sheet 📄 Offer letter ✓ Due diligence
Listing remarks
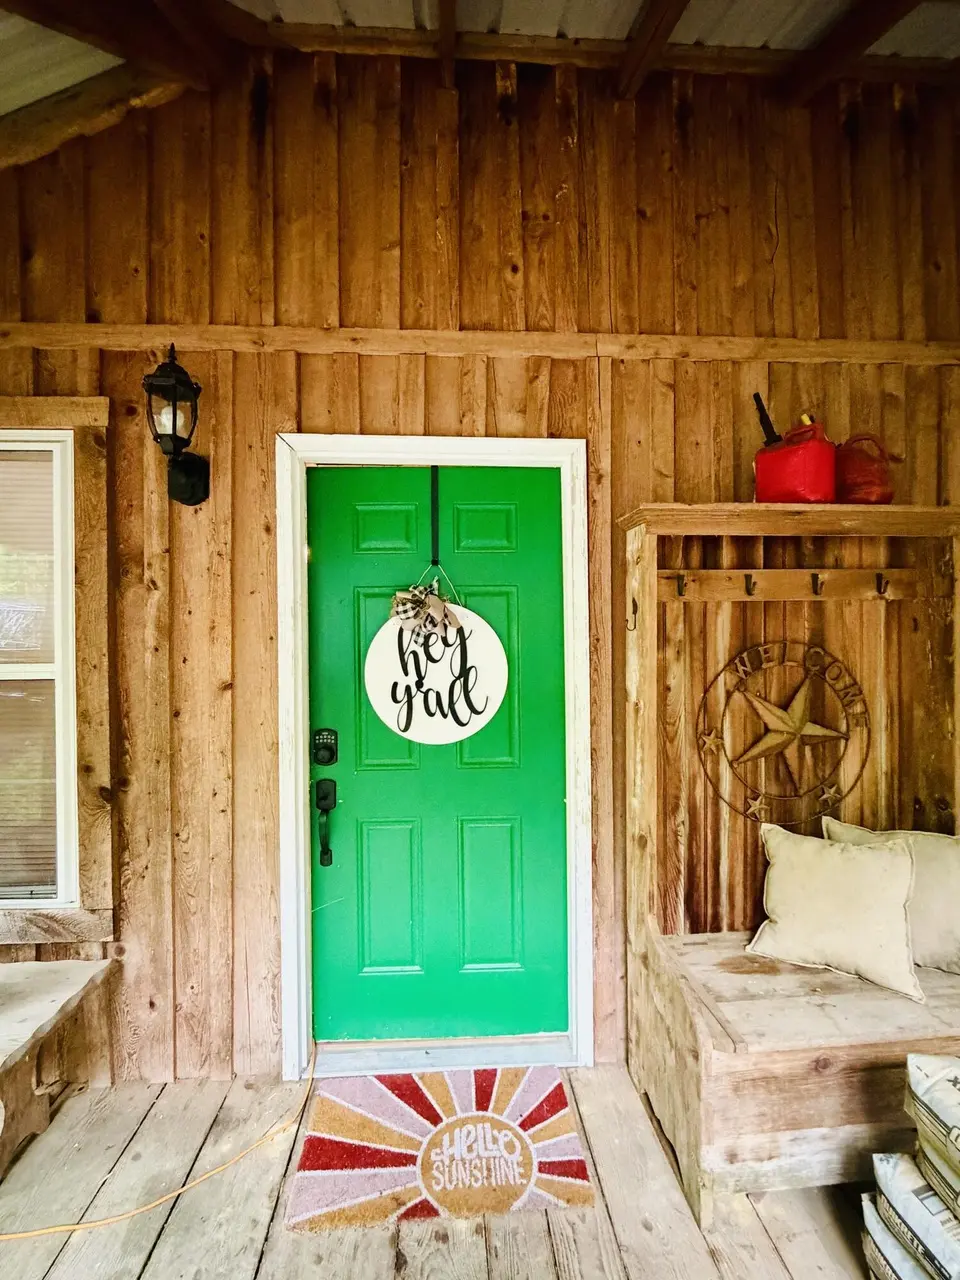
Wanting to feel like your at the Smokie Mountains?! Look no further, this lake retreat where comfort meets timeless Kentucky charm. Surrounded by the wooded countryside beauty up in the mountains. This adorable home while you're escaping private & peaceful yet remaining just minutes from the gorgeous Lake Cumberland, and the boat ramp. From the inviting atmosphere to the generous outdoor space, every detail creates the ideal setting for relaxing weekend get aways, entertaining guest, or everyday living, Whether enjoying quiet mornings sipping on your coffee, or evenings watching under the star views. This cozy house captures all of the refined lake living! Move in ready & can co
Key facts
- Refined lake living
- 1 acre lot
- 2 garage spots
Tags
Property features AI
Finance
- Other: Lot about 0.245 acres
Exterior
- Parking: Detached carport; Garage on property
- Utilities: Public water; Septic tank sewer
- Home design: Cabin-style property; One level
- Construction: Wood siding construction; Metal roof
- Exterior features: Metal roof; Wood siding; Other foundation
Interior
- Kitchen: Microwave; Refrigerator; Range
- Bedrooms: 2 total rooms
- Flooring: Carpet; Tile
- Bathrooms: 1 full bathroom
- Heating & cooling: Has heating (other); Window unit(s) for cooling
- Interior features: Eat-in kitchen; Ceiling fan(s)
Neighborhood map
What this means for you Summary
Snapshot
- This is a 2-bed/1.0-bath single-family listed at $130k.
Deal economics
- At list price, monthly cash flow is $156 ($2k/yr) — positive.
- The deal already cash-flows at list — no discount required.
- Meets the 1% rule at list price ($1k rent vs $130k).
- Recommended offer: $128k (1.5% below list) — sets the bar for market timing.
- Cap rate 7.7% vs local median 3.0% in Burnside — top-decile yield for the area; either an underpriced asset or a hidden risk that comps aren't pricing in. Stress-test before assuming the spread holds.
Location & tenants
- Location reads 71/100 on livability (#141 in KY) — a middle-class / working-renter tenant base. Strengths: crime A+, cost of living A+, health & safety A+; Watch: amenities F, commute F.
- Pulaski County (town): math 43% / reading 53% proficiency, ranked #17 of 165 in KY (top 10%) — families likely to look elsewhere, expect single-tenant / working-renter base with shorter leases.
- Zoned schools: Burnside Elementary School (math 32% / reading 42%, grade F, #255 of 676 statewide, top 42%, 432 students, 84% FRL); Southern Middle School (math 41% / reading 50%, grade D+, #32 of 217 statewide, top 15%, 941 students, 68% FRL); Southwestern High School (math 33% / reading 43%, grade F, #55 of 254 statewide, top 22%, 1,265 students, 64% FRL) — zoned schools average 72% FRL vs 56% district-wide (16 pts higher); higher-poverty schools than district average — tighter screening recommended.
- Market conditions: 84 active listings in the ZIP; 117 units permitted in Pulaski County in 2024 (50 in 5+ unit buildings).
Forward outlook
- In year one you build about $8k of equity ($898 loan paydown + $7k appreciation (5.2% local appreciation)).
- At projected returns (5.2% appreciation + 3.0% rent growth), your $36k cash investment doubles in ~4 years — after that, you're playing with house money.
- By year 5, paydown + projected appreciation supports a ~$33k cash-out refi (75% LTV) — recoverable capital for the next deal without selling this one.
Negotiation context
- It's been on market 22 days — a 2% lower offer ($128k) is reasonable based on typical stale-listing flexibility.
- Current owner paid $15k; list at $130k implies a 766% gain — meaningful room to come down on a strong offer.
Risks & watch-outs
- Climate carrying-cost: moderate wildfire risk — expect insurance premiums to compound above CPI over the hold.
Questions for the listing agent
- Is there a deadline driving the sale (1031 exchange, divorce, estate, relocation)? That informs how much negotiation room exists.
- Schools are D-rated, which usually means shorter tenancies and higher turnover. Who's the typical renter profile here, and what's been the actual vacancy rate?
- What's the average days-on-market for RENTAL listings here right now (not sales)? A rising rental-DOM trend means longer vacancies and softer asking-rent achievability than the comps imply.
- What's the recent tenant-quality profile in this submarket — average credit score on applications, eviction rate, late-payment / NSF rate, and stable-employment percentage? A property-management company in the area should have these aggregated.
- How much new for-sale + rental construction is in the pipeline within 1–3 miles? Heavy new supply typically softens prices + rents 12–24 months out; constrained supply supports both.
Investment metrics
- 1% rule
- 1.03% ✓
- Cap rate
- 7.74%
- Cash-on-cash
- 5.15%
- DSCR
- 1.23
- GRM
- 8.1
CMA / ARV
- ARV (on-the-fly)
- $76,608
- Comps found
- 1
Show comp detail 1 sale within ~0.75 mi
| Address | Dist | Beds/Ba | Sqft | Sold | Price | $/sf | Match |
|---|---|---|---|---|---|---|---|
| 11 Chainey Cir | 0.11mi | 1/1.0 (-1) | 656 (-2%) | 7mo | $75,000 | $114 | 80 |
Match score weights: distance 35% · size 25% · config 20% · recency 20%. Top-matched comps best support the ARV.
Projected returns pro-forma
5.19% appreciation · 3.0% rent growth · sell at horizon
- IRR
- 17.7%
- Equity multiple
- 2.14×
- Total profit
- $41,341
- Equity at exit
- $75,141
- IRR
- 17.8%
- Equity multiple
- 4.18×
- Total profit
- $115,784
- Equity at exit
- $130,965
Cash invested: $36,372 (down + closing). Projections, not guarantees.
Landlord ↔ Tenant lean methodology
- Overall (STATE)
- 83 Strongly Landlord-Friendly
- State Kentucky
- 83 Strongly Landlord-Friendly · R+16
- County
- — inherits STATE
- City
- — inherits STATE
ZIP-level market 42519
- Home prices YoY
- 1.5%
- Active inventory
- 84
- Price-to-rent
- 8.1×
Monthly cashflow live
- Estimated rent
- $1,334 medium interval (Pro) →
- Mortgage (P&I)
- −$681
- Tax est. 1.5%
- −$162 /mo · $1,948/yr
- Insurance
- −$54
- HOA
- −$0
- Vacancy / Maint / Mgmt
- −$280
- Net cashflow
- $156
Break-even live
UW: 25.0% down · 7.5% · 30yr · 1.5% tax · 5.0% vac · 8.0% maint · 8.0% mgmt
Financing live
Cash to close
- Down payment
- $32,475
- Closing costs
- $3,897
- Reserves months
- —
- Total cash needed
- —
Loan-product check · same deal, 3 products live
Conventional
25% down · 7.5% · 30yr
- Down + closing
- —
- Monthly P&I
- —
- Monthly cashflow
- —
- DSCR
- —
- Eligible?
- —
Personal DTI + credit; lowest rate.
DSCR
20% down · 8.5% · 30yr
- Down + closing
- —
- Monthly P&I
- —
- Monthly cashflow
- —
- DSCR
- —
- Eligible?
- —
No personal income docs; deal must DSCR.
Hard money
10% down · 12.0% · 12mo
- Down + closing
- —
- Monthly P&I
- —
- Monthly cashflow
- —
- DSCR
- —
- Eligible?
- —
Short-term bridge; refi at stabilization.
Listing history 18 events
-
2026-06-18days on market $129,900 Active 22 DOM
-
2026-06-17days on market $129,900 Active 21 DOM
-
2026-06-16days on market $129,900 Active 20 DOM
-
2026-06-15days on market $129,900 Active 19 DOM
-
2026-06-13days on market $129,900 Active 17 DOM
-
2026-06-12days on market $129,900 Active 16 DOM
-
2026-06-09days on market $129,900 Active 13 DOM
-
2026-06-08days on market $129,900 Active 12 DOM
-
2026-06-07days on market $129,900 Active 11 DOM
-
2026-06-07days on market $129,900 Active 10 DOM
-
2026-06-04days on market $129,900 Active 7 DOM
-
2026-06-02days on market $129,900 Active 6 DOM
-
2026-06-01days on market $129,900 Active 5 DOM
-
2026-05-31days on market $129,900 Active 4 DOM
-
2026-05-31days on market $129,900 Active 3 DOM
-
2026-05-27$129,900 Active
-
2016-09-01soldstatus $15,000
-
2006-09-08soldstatus $10,000
ⓘ Source: listings_history table (triggers on properties + properties_extension) + one-shot
backfill from property_details.listing_events for pre-trigger history.
Climate risk First Street
- Flood 1/10 Low FEMA zone X (unshaded) · 0% chance over 30 yrs
- Wildfire 5/10 Major
- Heat 4/10 Moderate 7 d/yr ≥102°F today · 20 d/yr by 30 yrs out
- Wind 2/10 Low 4% chance of damaging wind over 30 yrs
- Air quality 1/10 Low 0 unhealthy d/yr today · 0 by 30 yrs out
Nearby sold comps map
Loading sold comps map…
Walkable amenities ~0.75 mi
Loading nearby amenities…
Taxation est. · year 1
- Rental income
- $16,008
- − Mortgage interest
- −$7,276
- − Property taxes
- −$1,948
- − Insurance
- −$650
- − Repairs & maintenance
- −$1,281
- − Management
- −$1,281
- − Depreciation
- −$3,779
- Taxable loss
- −$207
- Est. tax savings @ 24.0%
- +$50
- After-tax cash flow
- $1,923/yr
For passive investors: Depreciation is non-cash, so a rental often shows a tax loss while cash-flowing — sheltering income. Rental losses are passive: they offset passive income freely, and up to $25,000/yr can offset ordinary (W-2) income if you actively participate and your MAGI is under $100k (phasing out to $0 by $150k); unused losses carry forward. On sale, claimed depreciation is recaptured at up to 25%, and gains may owe capital-gains tax (a 1031 exchange can defer both). Figures are a year-1 estimate at your 24.0% rate — not tax advice; consult a CPA.
Schools (NCES district)
- District
- Pulaski County
- NCES district ID
- 2104950
- Math proficiency
- 43% ▼ -18.00%
- Reading proficiency
- 53% ▼ -13.00%
- Median HH income
- $35,366
- Composite
- 39.69/100
- National rank
- #3906
- State rank
- #17 of 165 in KY
Livability — Burnside
- Score
- 71/100
- State rank
- #141
- US rank
- #6774
Category grades
Schools grade is shown separately in the Schools card above.
Census & demographics
- Population (ZIP)
- 2,800
Population outlook (Pulaski County) Hauer SSP2
- Today (2025)
- 65,414 people
- By 2030
- 65,828 · +0.6%
- By 2040
- 65,972 · +0.9%
- By 2050
- 65,108 · -0.5%
- By 2075
- 61,647 · -5.8%
- By 2100
- 53,613 · -18.0%
Race, ethnicity, and origin ACS 2023
- Neighborhood character
- Predominantly White (88%)
- Race & ethnicity
- White 88% Two or more races 10% Hispanic / Latino 3% Native American 1%
- Common ancestry
- Italian 2% Serbian 1% Lithuanian 1%
- Foreign-born
- 1% · Canada
Political lean MEDSL · Pulaski
- 2024 margin
- Solid R (+65.2) · D 16.9% · R 82.1% · Other 1.0%
- 2008→2024 swing
- -9.9pp toward R · 2008: -55.4pp · 2024: -65.2pp
- All cycles
- 2024: R+65.2 2020: R+62.7 2016: R+66.7 2012: R+60.5 2008: R+55.4
Not yet ingested
- Civics
- —
Market trends
- HPI YoY
- ▲ 5.19%
- Current HPI
- 358.2137
- Rent YoY
- —
- Metro
- —
- State GDP YoY
- ▲ 1.81%
- F500 in state
- 4
Industry mix (Fortune 500 HQ in KY)
| Industry | F500 HQs | Revenue |
|---|---|---|
| Healthcare | 1 | $118B |
|
||
| Food / Beverage | 1 | $7B |
|
||
Price history
+1199.0% since first listed3 events — show timeline
- 2026-05-27 Listed $129,900 ImagineMLS
- 2016-09-01 Sold (Public Records) $15,000 Public Records
- 2006-09-08 Sold (Public Records) $10,000 Public Records
Property tax history
-9.6%/yrLatest (2025): $108 · -2.3% YoY. Source: county tax records.
Cash-flow waterfall
monthlySold comps — $/sqft
last 12 mo · ≤1 miLoading sold comps…