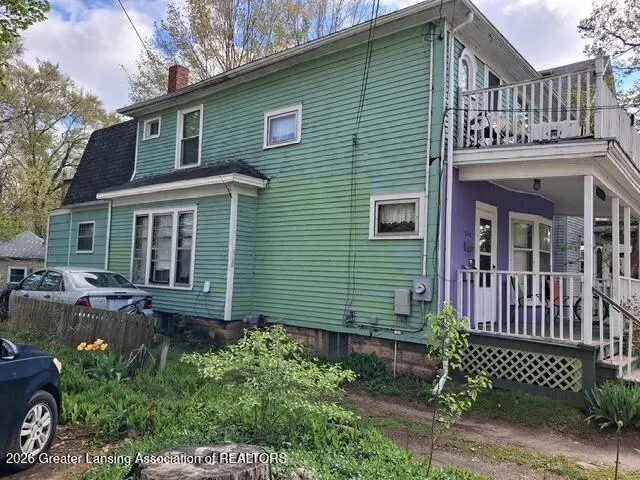
216 Reo Ave Unit 1,2,3 · Lansing, MI
Flood risk 1/10 · Minimal
- FEMA flood zone
- X (unshaded)
- Chance of flooding over 30 yrs
- 0.0%
- Est. flood insurance / yr
- $473 – $860
Fire risk 1/10 · Minimal
- Est. fire insurance / yr
- $784 – $1,456
Heat risk 3/10 · Minor
- Hot days now (above 96°F)
- 7 days/yr
- Hot days in 30 yrs
- 16 days/yr
Wind risk 2/10 · Minimal
- Chance of severe wind over 30 yrs
- —
Air-quality risk 2/10 · Minimal
- Unhealthy air days now
- 1 days/yr
- Unhealthy air days in 30 yrs
- 2 days/yr
Risk factors via First Street. Map © Google.
Why this score? — see what drove the C grade
The composite is a weighted blend of 9 inputs, each scored 0–100. Each bar is that input's sub-score; the figure is the points it added to the 100-point composite (weight × sub-score).
- Cash flow +27.2/30.0
- DSCR +9.5/10.0
- 1% rule +7.4/10.0
- Livability +4.0/5.0
- Rent growth +3.7/5.0
- Condition / age +2.2/5.0
- Schools +1.9/10.0
- ARV discount +0.0/15.0
- Appreciation +0.0/10.0
$95,000
🖨 Deal sheet 📄 Offer letter ✓ Due diligence
Listing remarks MLS
Rare opporunity to own a triplex in the thriving REO town community. The building is split into an efficiency, 1 bed/1 bath and 2 bed/1 bath with common entrance. Currently fully occupied. Shared utilities.
Key facts
- 2,178 sq ft lot
- 3 parking spots
- Built 1910
Property features AI
Exterior
- Parking: 3 parking spaces; No garage
- Utilities: 100 amp electric service; Public sewer
- Home design: Two-story building; Built in 1910; Located in the REO Park subdivision
- Construction: Wood siding construction
- Exterior features: Covered front porch; Shingle roof
Interior
- Bedrooms: Property contains 3 dwelling units
- Heating & cooling: Forced air heating; Natural gas heating
- Interior features: Full basement; No central cooling
- Laundry & utility: No laundry features listed
Neighborhood map
What this means for you Summary
Snapshot
- This is a ?-bed/1.0-bath condo listed at $95k. Condition is rated fair.
Deal economics
- At list price, monthly cash flow is $272 ($3k/yr) — positive.
- The deal already cash-flows at list — no discount required.
- Meets the 1% rule at list price ($1k rent vs $95k).
- Cap rate 9.7% vs local median 6.0% in Lansing — top-decile yield for the area; either an underpriced asset or a hidden risk that comps aren't pricing in. Stress-test before assuming the spread holds.
Location & tenants
- Location reads 79/100 on livability (#94 in MI, #2,182 nationally) — a middle-class / working-renter tenant base. Strengths: amenities A+, commute A+, cost of living A+; Watch: employment D, schools F, crime F.
- Lansing Public School District (urban): math 14% / reading 23% proficiency, ranked #650 of 760 in MI (top 86%) — low school quality limits family demand, transient renter base, plan for 1-2y turnover; 68% free/reduced lunch — lower-income household profile, screen leases tightly.
- Market conditions: Rents rising fast (+4.7%/yr); 177 active listings in the ZIP; 40 comparable units currently listed for rent nearby; rentals lingering (median 44d on market — plan ~5-8 weeks vacancy on turnover, expect pricing pressure); 60% of comp listings sitting > 30 days — soft ceiling on asking rent; 350 units permitted in Ingham County in 2024 (186 in 5+ unit buildings).
Forward outlook
- Local home prices are declining (-3.0%/yr); year-one equity from $657 of loan paydown is wiped out by about $3k of value loss. Plan a longer hold.
- Ingham County population projected at +11% by 2050 — modest demand growth; plan on rents tracking national, not racing it.
- At projected returns (-3.0% appreciation + 4.7% rent growth), your $27k cash investment doubles in ~8 years — after that, you're playing with house money.
Negotiation context
- Only 6 days on market — expect competitive offers; lowballing is unlikely to land.
- 3 sale attempts with the ask held roughly flat each time — persistent listings suggest the price (not the market) is what's stuck; bring a comps-based counter.
Risks & watch-outs
- Watch-outs: built in 1910 — expect roof / HVAC / electrical / plumbing capex.
Questions for the listing agent
- Have any recent inspections been done? Can we get a copy of the seller's disclosures and any deferred-maintenance estimates?
- Built in 1910 — when were the roof, HVAC, electrical panel, plumbing, and water heater last replaced?
- Any open or pending special assessments — roof, HVAC, plumbing, elevator, façade? What's the per-unit balance and payoff schedule, and is the seller paying it off at close or rolling it to the buyer?
- Is there a deadline driving the sale (1031 exchange, divorce, estate, relocation)? That informs how much negotiation room exists.
- Schools are F-rated, which usually means shorter tenancies and higher turnover. Who's the typical renter profile here, and what's been the actual vacancy rate?
- Crime grade is F in this area — have there been break-ins, vandalism, or insurance claims at this property in the last 3 years? What carrier currently insures it and at what premium?
- What's the average days-on-market for RENTAL listings here right now (not sales)? A rising rental-DOM trend means longer vacancies and softer asking-rent achievability than the comps imply.
- What's the recent tenant-quality profile in this submarket — average credit score on applications, eviction rate, late-payment / NSF rate, and stable-employment percentage? A property-management company in the area should have these aggregated.
- How much new apartment / multifamily construction is in the pipeline within 1–3 miles? Heavy new supply (>2% of stock underway) typically softens rents 12–24 months out; light construction supports rent growth.
Investment metrics
- 1% rule
- 1.24% ✓
- Cap rate
- 9.73%
- Cash-on-cash
- 12.28%
- DSCR
- 1.55
- GRM
- 6.7
CMA / ARV
- ARV (median comp)
- $73,114
- List price
- $95,000
- Delta
- 77.67%
- Verdict
- OVERPRICED
- Comps
- 3 within 1.0 mi
Show comp detail 1 sale within ~0.75 mi
| Address | Dist | Beds/Ba | Sqft | Sold | Price | $/sf | Match |
|---|---|---|---|---|---|---|---|
| 118 Garden St #2 | 0.21mi | 4/2.0 | 1,728 | 21mo | $105 | — | 56 |
Match score weights: distance 35% · size 25% · config 20% · recency 20%. Top-matched comps best support the ARV.
Projected returns pro-forma
-3.0% appreciation · 4.71% rent growth · sell at horizon
- IRR
- 3.8%
- Equity multiple
- 1.15×
- Total profit
- $4,019
- Equity at exit
- $14,165
- IRR
- 14.9%
- Equity multiple
- 2.30×
- Total profit
- $34,639
- Equity at exit
- $8,214
Cash invested: $26,600 (down + closing). Projections, not guarantees.
Landlord ↔ Tenant lean methodology
- Overall (STATE)
- 62 Landlord-Friendly
- State Michigan
- 62 Landlord-Friendly · EVEN
- County
- — inherits STATE
- City
- — inherits STATE
ZIP-level market 48910
- Rents YoY
- 4.7%
- Active inventory
- 177
- Price-to-rent
- 6.7×
Monthly cashflow live
- Estimated rent
- $1,176 high interval (Pro) →
- Mortgage (P&I)
- −$498
- Tax est. 1.5%
- −$119 /mo · $1,425/yr
- Insurance
- −$40
- HOA
- −$0
- Vacancy / Maint / Mgmt
- −$247
- Net cashflow
- $272
Break-even live
UW: 25.0% down · 7.5% · 30yr · 1.5% tax · 5.0% vac · 8.0% maint · 8.0% mgmt
Financing live
Cash to close
- Down payment
- $23,750
- Closing costs
- $2,850
- Reserves months
- —
- Total cash needed
- —
Loan-product check · same deal, 3 products live
Conventional
25% down · 7.5% · 30yr
- Down + closing
- —
- Monthly P&I
- —
- Monthly cashflow
- —
- DSCR
- —
- Eligible?
- —
Personal DTI + credit; lowest rate.
DSCR
20% down · 8.5% · 30yr
- Down + closing
- —
- Monthly P&I
- —
- Monthly cashflow
- —
- DSCR
- —
- Eligible?
- —
No personal income docs; deal must DSCR.
Hard money
10% down · 12.0% · 12mo
- Down + closing
- —
- Monthly P&I
- —
- Monthly cashflow
- —
- DSCR
- —
- Eligible?
- —
Short-term bridge; refi at stabilization.
Rent comps 40 comps
| Address | Beds | Baths | Sqft | Rent | $/sqft | DOM | Units | Dist |
|---|---|---|---|---|---|---|---|---|
| 1828 Davis Ave Lansing, MI | 2.0 | 1.0 | 700 | $1,150 | $1.64 | 43d | 1 | 0.39mi |
| 920 S Washington Ave Lansing, MI | 1.0–2.0 | 1.0–2.0 | 900 | $1,250 | $1.39 | 13d | 1 | 0.39mi |
| 855 S Washington Ave Lansing, MI | 1.0 | 1.0 | 576 | $1,245 | $2.16 | 21d | 3 | 0.49mi |
| 855 S Washington Ave Lansing, MI | 1.0 | 1.0 | 576 | $1,245 | $2.16 | 43d | 9 | 0.49mi |
| 825 S Washington Ave Apt 103 Lansing, MI | 1.0 | 1.0 | 520 | $1,095 | $2.11 | 43d | 1 | 0.51mi |
| 313 E Saint Joseph St Lansing, MI | 2.0 | 1.0 | 475 | $1,150 | $2.42 | 13d | 7 | 0.65mi |
| 532 Townsend St Lansing, MI | 1.0 | 1.0 | — | $750 | — | 43d | 1 | 0.67mi |
| 335 E Saint Joseph St Unit 6 Lansing, MI | 2.0 | 1.0 | 700 | $949 | $1.36 | 43d | 1 | 0.67mi |
| 334 E Hillsdale St Lansing, MI | 2.0 | 1.0 | — | $1,100 | — | 43d | 1 | 0.71mi |
| 707 E Mount Hope Ave Unit 3 Lansing, MI | 2.0 | 1.0 | — | $950 | — | 43d | 1 | 0.71mi |
| 1913 Stirling Ave Unit 1 Lansing, MI | 2.0 | 2.0 | 1100 | $1,200 | $1.09 | 43d | 1 | 0.72mi |
| 515 S Chestnut St Lansing, MI | 1.0 | 1.0 | 646 | $942 | $1.46 | 13d | 8 | 0.73mi |
| 509 Cherry St Unit 2 Lansing, MI | 1.0 | 1.0 | 550 | $975 | $1.77 | 21d | 1 | 0.75mi |
| 1424 S Pennsylvania Ave Lansing, MI | 1.0 | 1.0 | 700 | $915 | $1.31 | 43d | 1 | 0.79mi |
| 420 S Walnut St Lansing, MI | 1.0 | 1.0 | 525 | $875 | $1.67 | 43d | 1 | 0.80mi |
| 1420 S Pennsylvania Ave Lansing, MI | 1.0 | 1.0 | 700 | $750 | $1.07 | 21d | 3 | 0.80mi |
| 401 S Washington Sq Unit 205 Lansing, MI | 2.0 | 1.0 | 968 | $1,355 | $1.40 | 43d | 1 | 0.81mi |
| 401 S Washington Sq Unit 201 Lansing, MI | 3.0 | 1.0 | 1254 | $1,560 | $1.24 | 43d | 1 | 0.81mi |
| 401 S Washington Sq Unit 212 Lansing, MI | 1.0 | 1.0 | 827 | $1,330 | $1.61 | 43d | 1 | 0.81mi |
| 805 Bement St Unit Hosmer 507 Lansing, MI | 2.0 | 1.0 | 1120 | $1,075 | $0.96 | 43d | 1 | 0.98mi |
| 1317 Lenore Ave Lansing, MI | 2.0 | 1.5 | 1442 | $850 | $0.59 | 43d | 1 | 0.98mi |
| 507 S Hosmer St Lansing, MI | 2.0 | 1.0 | 1120 | $1,075 | $0.96 | 43d | 1 | 0.99mi |
| 1027 Climax St Lansing, MI | 3.0 | 1.5 | 1298 | $1,550 | $1.19 | 13d | 1 | 0.99mi |
| 110 E Allegan St Lansing, MI | 2.0 | 1.0 | — | $1,300 | — | 43d | 1 | 1.00mi |
| 401 E Willard Ave Unit 19 Lansing, MI | 2.0 | 1.0 | 775 | $1,000 | $1.29 | 43d | 1 | 1.00mi |
| 111 E Allegan St Lansing, MI | 1.0 | 1.0 | — | $1,050 | — | 21d | 1 | 1.02mi |
| 1100 Malcolm X St Unit B Lansing, MI | 2.0 | 1.0 | 979 | $1,050 | $1.07 | 13d | 1 | 1.04mi |
| 430 Dunlap St Lansing, MI | 2.0 | 1.0 | 940 | $1,450 | $1.54 | 21d | 1 | 1.10mi |
| 1030 S Holmes St Lansing, MI | 1.0 | 1.0–1.5 | 812 | $1,595 | $1.96 | 13d | 11 | 1.11mi |
| 1330 W Hillsdale St Lansing, MI | 3.0 | 1.0 | 1008 | $1,550 | $1.54 | 43d | 1 | 1.13mi |
| 1223 Bensch St Lansing, MI | 3.0 | 1.0 | 850 | $1,200 | $1.41 | 21d | 1 | 1.15mi |
| 1109 W Washtenaw St Unit 5 Lansing, MI | 2.0 | 1.0 | 755 | $795 | $1.05 | 43d | 1 | 1.15mi |
| 3031 S Washington Ave Lansing, MI | 1.0–2.0 | 1.0 | 725 | $1,100 | $1.52 | 43d | 1 | 1.19mi |
| 129 S Hosmer St Unit 1 Lansing, MI | 1.0 | 1.0 | 500 | $795 | $1.59 | 21d | 1 | 1.21mi |
| 1815 Potomac Cir Lansing, MI | 2.0 | 1.0 | 1002 | $1,200 | $1.20 | 13d | 1 | 1.22mi |
| 113 Pere Marquette Dr Lansing, MI | 1.0–2.0 | 1.0–2.0 | 1065 | $2,250 | $2.11 | 13d | 9 | 1.23mi |
| 1016 E Greenlawn Ave Unit 3 Lansing, MI | 2.0 | 1.0 | 750 | $925 | $1.23 | 13d | 1 | 1.24mi |
| 1020 Prospect St Lansing, MI | 2.0 | 1.0 | — | $1,075 | — | 43d | 1 | 1.24mi |
| 910 Dakin St Lansing, MI | 3.0 | 1.0 | 908 | $1,295 | $1.43 | 43d | 1 | 1.27mi |
| 307 N Walnut St Unit 307 Lansing, MI | 1.0 | 1.0 | 550 | $1,100 | $2.00 | 43d | 1 | 1.28mi |
HOA detail condo
- Monthly dues
- $0 · $0/yr
- Assessments
- None detected in remarks — confirm with the listing agent.
Listing history 11 events
-
2026-06-18days on market $95,000 Active 6 DOM
-
2026-06-17days on market $95,000 Active 5 DOM
-
2026-06-16days on market $95,000 Active 4 DOM
-
2026-06-15days on market $95,000 Active 3 DOM
-
2026-06-13pricedays on market $95,000 Active 1 DOM
-
2026-06-02days on market $129,900 Active 33 DOM
-
2026-06-01days on market $129,900 Active 32 DOM
-
2026-05-31days on market $129,900 Active 31 DOM
-
2026-05-30days on market $129,900 Active 30 DOM
-
2026-04-30$129,900 Active 287-char remark
-
2026-04-30$129,900 Active 283-char remark
ⓘ Source: listings_history table (triggers on properties + properties_extension) + one-shot
backfill from property_details.listing_events for pre-trigger history.
Climate risk First Street
- Flood 1/10 Low FEMA zone X (unshaded) · 0% chance over 30 yrs
- Wildfire 1/10 Low
- Heat 3/10 Moderate 7 d/yr ≥96°F today · 16 d/yr by 30 yrs out
- Wind 2/10 Low
- Air quality 2/10 Low 1 unhealthy d/yr today · 2 by 30 yrs out
Nearby sold comps map
Loading sold comps map…
Walkable amenities ~0.75 mi
Loading nearby amenities…
Taxation est. · year 1
- Rental income
- $14,108
- − Mortgage interest
- −$5,321
- − Property taxes
- −$1,425
- − Insurance
- −$475
- − Repairs & maintenance
- −$1,129
- − Management
- −$1,129
- − Depreciation
- −$2,764
- Taxable income
- $1,865
- Est. tax owed @ 24.0%
- −$448
- After-tax cash flow
- $2,819/yr
For passive investors: Depreciation is non-cash, so a rental often shows a tax loss while cash-flowing — sheltering income. Rental losses are passive: they offset passive income freely, and up to $25,000/yr can offset ordinary (W-2) income if you actively participate and your MAGI is under $100k (phasing out to $0 by $150k); unused losses carry forward. On sale, claimed depreciation is recaptured at up to 25%, and gains may owe capital-gains tax (a 1031 exchange can defer both). Figures are a year-1 estimate at your 24.0% rate — not tax advice; consult a CPA.
Condition & rehab AI · 12 photos
This multi-family property requires moderate renovations to improve its condition and increase its value. The exterior and interior need significant work, and updating the kitchen and bathrooms will have the highest impact on both resale and rental value.
Repairs flagged
- Major exterior siding — Peeling paint and visible damage
- Major interior walls — Needs fresh paint
- Major kitchen cabinets — Outdated and in poor condition
- Major bathrooms — Needs updating
- Major flooring — Worn-out carpet
Value-add opportunities
- Both Painting and updating the interior — Fresh paint and updated interior will attract more tenants and buyers
- Both Upgrading the kitchen and bathrooms — Modernizing these spaces will increase the home's value
- Both Landscaping and curb appeal — A well-maintained exterior will make the home more appealing to potential buyers and tenants
Renovation cost estimate screening
| Repair item | Severity | Est. cost |
|---|---|---|
| exterior siding · Peeling paint and visible damage | Major | $15,000–50,000 |
| interior walls · Needs fresh paint | Major | $15,000–50,000 |
| kitchen cabinets · Outdated and in poor condition | Major | $15,000–50,000 |
| bathrooms · Needs updating | Major | $15,000–50,000 |
| flooring · Worn-out carpet | Major | $15,000–50,000 |
| Total estimated repair cost · 5 items | $75,000–250,000 |
Value-add ROI direction
- Both Painting and updating the interior — Fresh paint and updated interior will attract more tenants and buyers ↑
- Both Upgrading the kitchen and bathrooms — Modernizing these spaces will increase the home's value ↑
- Both Landscaping and curb appeal — A well-maintained exterior will make the home more appealing to potential buyers and tenants ↑
ⓘ Cost ranges are severity-bucket heuristics (US national rule-of-thumb). Get contractor quotes + a written scope before underwriting a rehab budget.
Schools (NCES district)
- District
- Lansing Public School District
- NCES district ID
- 2621150
- Math proficiency
- 14% ▲ 1.00%
- Reading proficiency
- 23% ▲ 3.00%
- Median HH income
- $37,453
- Composite
- 18.76/100
- National rank
- #14002
- State rank
- #650 of 760 in MI
Livability — Lansing
- Score
- 79/100
- State rank
- #94
- US rank
- #2182
Category grades
Schools grade is shown separately in the Schools card above.
Census & demographics
- Census place
- Lansing, MI
- County
- Ingham County · 237,052 people
- City population
- 161,269
- Metro
- Lansing-East Lansing, MI
- Population (ZIP)
- 32,800
- Household income
- $54,712
- Rent vs Own
- Severe rent burden
- 1305.0
Population outlook (Ingham County) Hauer SSP2
- Today (2025)
- 300,362 people
- By 2030
- 307,808 · +2.5%
- By 2040
- 320,492 · +6.7%
- By 2050
- 333,223 · +10.9%
- By 2075
- 373,693 · +24.4%
- By 2100
- 392,021 · +30.5%
Race, ethnicity, and origin ACS 2023
- Neighborhood character
- Diverse neighborhood (Simpson 0.62)
- Race & ethnicity
- White 58% Black 16% Hispanic / Latino 12% Two or more races 12% Asian 4% Native American 1%
- Hispanic origin (detail)
- Mexican 9% Cuban 2%
- Common ancestry
- Romanian 5% Lithuanian 3% Slovak 2%
- Foreign-born
- 9% · Canada, China, Vietnam
- Languages at home
- 87% English-only · Spanish 6% Chinese 1% Other Indo-European 1%
Political lean MEDSL · Ingham
- 2024 margin
- Strong D (+29.7) · D 63.9% · R 34.2% · Other 2.0%
- 2008→2024 swing
- -3.6pp toward R · 2008: 33.3pp · 2024: 29.7pp
- All cycles
- 2024: D+29.7 2020: D+32.2 2016: D+27.6 2012: D+27.9 2008: D+33.3
Not yet ingested
- Civics
- —
Market trends
- HPI YoY
- ▼ -211.82%
- Current HPI
- 196.8087
- Rent YoY
- ▲ 4.71%
- Metro
- Lansing-East Lansing, MI
- State GDP YoY
- ▲ 1.37%
- F500 in state
- 28
Industry mix (Fortune 500 HQ in MI)
| Industry | F500 HQs | Revenue |
|---|---|---|
| Automotive Parts | 3 | $48B |
|
||
| Automotive | 2 | $372B |
|
||
| Chemicals | 1 | $45B |
|
||
| Automotive Retail | 1 | $29B |
|
||
| Healthcare / Medical Devices | 1 | $23B |
|
||
| Automotive Technology | 1 | $20B |
|
||
Price history
-26.9% since first listed4 events — show timeline
- 2026-06-12 Listed $95,000 REALCOMP
- 2026-06-12 Listed $95,000 Greater Lansing AoR
- 2026-06-03 Listing Removed — REALCOMP
- 2026-04-30 Listed $129,900 REALCOMP
Cash-flow waterfall
monthlySold comps — $/sqft
last 12 mo · ≤1 miLoading sold comps…