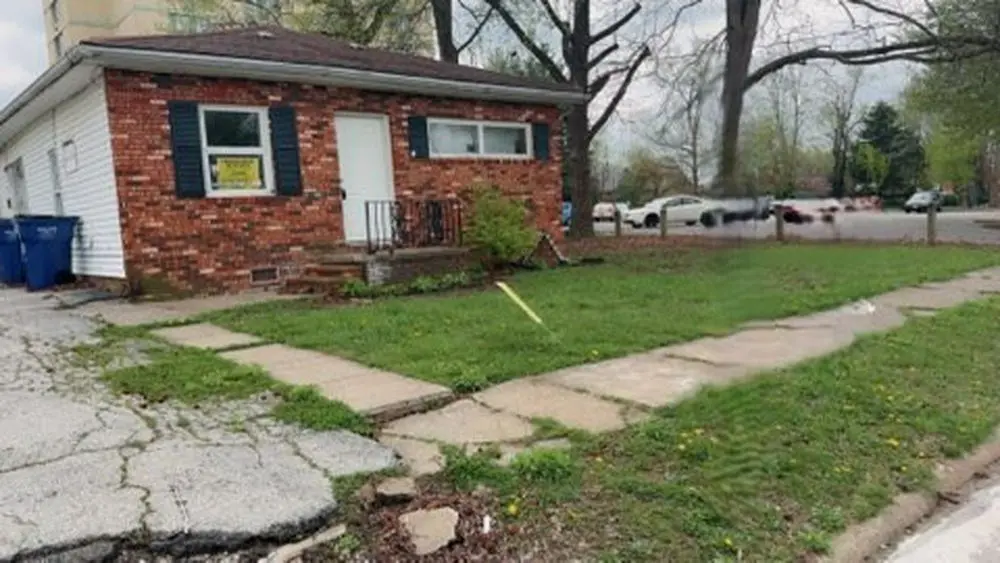
1410 E Poplar St · West Frankfort, IL
Flood risk 1/10 · Minimal
- FEMA flood zone
- X (unshaded)
- Chance of flooding over 30 yrs
- 0.0%
- Est. flood insurance / yr
- $473 – $860
Fire risk 1/10 · Minimal
- Est. fire insurance / yr
- $804 – $1,492
Heat risk 5/10 · Moderate
- Hot days now (above 107°F)
- 7 days/yr
- Hot days in 30 yrs
- 20 days/yr
Wind risk 2/10 · Minimal
- Chance of severe wind over 30 yrs
- 2.0%
Air-quality risk 2/10 · Minimal
- Unhealthy air days now
- 0 days/yr
- Unhealthy air days in 30 yrs
- 1 days/yr
Risk factors via First Street. Map © Google.
Why this score? — see what drove the B- grade
The composite is a weighted blend of 9 inputs, each scored 0–100. Each bar is that input's sub-score; the figure is the points it added to the 100-point composite (weight × sub-score).
- Cash flow +30.0/30.0
- 1% rule +10.0/10.0
- DSCR +10.0/10.0
- ARV discount +7.5/15.0
- Livability +2.8/5.0
- Rent growth +2.5/5.0
- Condition / age +2.5/5.0
- Schools +0.9/10.0
- Appreciation +0.0/10.0
$25,000
🖨 Deal sheet 📄 Offer letter ✓ Due diligence
Listing remarks MLS
Investment Opportunity Alert! Check out this fantastic property at 1410 E Poplar St West Frankfort IL 62896! This 2 bed, 1 bath home offers an 1250 sqft and is just waiting for your personal touch. While it needs some TLC, its priced to sell fast, making it a perfect candidate for a fix and flip or a project home! Dont Miss Out! With plenty of potential, this home is ready for your creative vision! Location: West Frankfort IL Opportunity: Unlimited! For more details or to schedule a viewing, contact: Joan Olson: 727-263-3034 | [email protected] Cash buyers only $500 EMD 7 day inspection 30 day close!
Key facts
- 8,276 sq ft lot
- Built 1930
- Listed 230 days
Neighborhood map
What this means for you Summary
Snapshot
- This is a 2-bed/1.0-bath other listed at $25k.
Deal economics
- At list price, monthly cash flow is $426 ($5k/yr) — positive.
- The deal already cash-flows at list — no discount required.
- Meets the 1% rule at list price ($828 rent vs $25k).
- Recommended offer: $22k (12.0% below list) — sets the bar for market timing.
- Cap rate 26.7% vs local median 5.8% in West Frankfort — top-decile yield for the area; either an underpriced asset or a hidden risk that comps aren't pricing in. Stress-test before assuming the spread holds.
Location & tenants
- Location reads 56/100 on livability (#1,210 in IL) — a working-class tenant base; expect higher turnover. Strengths: cost of living A+, housing A+; Watch: crime D, schools F, amenities F.
- Frankfort CUSD 168 (town): math 6% / reading 16% proficiency, ranked #577 of 620 in IL (top 93%) — low school quality limits family demand, transient renter base, plan for 1-2y turnover.
- Market conditions: 90 active listings in the ZIP; 2 comparable units currently listed for rent nearby; 17 units permitted in Franklin County in 2024 (0 in 5+ unit buildings).
Forward outlook
- Local home prices are declining (-3.0%/yr); year-one equity from $173 of loan paydown is wiped out by about $750 of value loss. Plan a longer hold.
- Franklin County population projected at -16% by 2050 — secular population decline; favor cash flow + early exit over multi-decade hold.
- At projected returns (-3.0% appreciation + 3.0% rent growth), your $7k cash investment doubles in ~2 years — after that, you're playing with house money.
Negotiation context
- It's been on market 230 days — a 12% lower offer ($22k) is reasonable based on typical stale-listing flexibility.
- 8 sale attempts since 26y ago with the ask held roughly flat each time — persistent listings suggest the price (not the market) is what's stuck; bring a comps-based counter.
- Current owner paid $20k; 25% above their basis — modest negotiation headroom, anchor on the comps not their cost.
Risks & watch-outs
- Watch-outs: property tax is 4.2% of price; built in 1930 — expect roof / HVAC / electrical / plumbing capex.
- Climate carrying-cost: extreme-heat days projected 7→20/yr by 2055 (HVAC capex compounding) — expect insurance premiums to compound above CPI over the hold.
Questions for the listing agent
- It's been on market 230 days. Have you received any prior offers? Is the seller open to a 12% concession, seller financing, or rate buy-down credit?
- Built in 1930 — when were the roof, HVAC, electrical panel, plumbing, and water heater last replaced?
- Property tax is high relative to price — has the assessment been appealed recently, and will the sale trigger a re-assessment?
- Why hasn't it sold? Are there any deal-killer items the seller is aware of (foundation, flood, title, zoning, code violations)?
- Is there a deadline driving the sale (1031 exchange, divorce, estate, relocation)? That informs how much negotiation room exists.
- Schools are F-rated, which usually means shorter tenancies and higher turnover. Who's the typical renter profile here, and what's been the actual vacancy rate?
- Crime grade is D in this area — have there been break-ins, vandalism, or insurance claims at this property in the last 3 years? What carrier currently insures it and at what premium?
- What's the average days-on-market for RENTAL listings here right now (not sales)? A rising rental-DOM trend means longer vacancies and softer asking-rent achievability than the comps imply.
- What's the recent tenant-quality profile in this submarket — average credit score on applications, eviction rate, late-payment / NSF rate, and stable-employment percentage? A property-management company in the area should have these aggregated.
- How much new for-sale + rental construction is in the pipeline within 1–3 miles? Heavy new supply typically softens prices + rents 12–24 months out; constrained supply supports both.
Investment metrics
- 1% rule
- 3.31% ✓
- Cap rate
- 26.74%
- Cash-on-cash
- 73.04%
- DSCR
- 4.25
- GRM
- 2.5
CMA / ARV
No comps found within radius.
Projected returns pro-forma
-3.0% appreciation · 3.0% rent growth · sell at horizon
- IRR
- 72.8%
- Equity multiple
- 4.30×
- Total profit
- $23,130
- Equity at exit
- $3,728
- IRR
- 76.7%
- Equity multiple
- 8.90×
- Total profit
- $55,271
- Equity at exit
- $2,162
Cash invested: $7,000 (down + closing). Projections, not guarantees.
Landlord ↔ Tenant lean methodology
- Overall (STATE)
- 43 Moderately Tenant-Leaning
- State Illinois
- 43 Moderately Tenant-Leaning · D+7
- County
- — inherits STATE
- City
- — inherits STATE
ZIP-level market 62896
- Active inventory
- 90
- Price-to-rent
- 2.5×
Monthly cashflow live
- Estimated rent
- $828 medium interval (Pro) →
- Mortgage (P&I)
- −$131
- Tax from tax record
- −$87 /mo · $1,043/yr
- Insurance
- −$10
- HOA
- −$0
- Vacancy / Maint / Mgmt
- −$174
- Net cashflow
- $426
Break-even live
UW: 25.0% down · 7.5% · 30yr · 1.5% tax · 5.0% vac · 8.0% maint · 8.0% mgmt
Financing live
Cash to close
- Down payment
- $6,250
- Closing costs
- $750
- Reserves months
- —
- Total cash needed
- —
Loan-product check · same deal, 3 products live
Conventional
25% down · 7.5% · 30yr
- Down + closing
- —
- Monthly P&I
- —
- Monthly cashflow
- —
- DSCR
- —
- Eligible?
- —
Personal DTI + credit; lowest rate.
DSCR
20% down · 8.5% · 30yr
- Down + closing
- —
- Monthly P&I
- —
- Monthly cashflow
- —
- DSCR
- —
- Eligible?
- —
No personal income docs; deal must DSCR.
Hard money
10% down · 12.0% · 12mo
- Down + closing
- —
- Monthly P&I
- —
- Monthly cashflow
- —
- DSCR
- —
- Eligible?
- —
Short-term bridge; refi at stabilization.
Rent comps 2 comps
| Address | Beds | Baths | Sqft | Rent | $/sqft | DOM | Units | Dist |
|---|---|---|---|---|---|---|---|---|
| 411 N Cochran St West Frankfort, IL | 2.0 | 1.0 | 960 | $795 | $0.83 | 44d | 1 | 0.27mi |
| 403 E Poplar St West Frankfort, IL | 3.0 | 1.0 | 1200 | $900 | $0.75 | 44d | 1 | 0.73mi |
Listing history 25 events
-
2026-06-04days on market $25,000 Active 230 DOM
-
2026-06-02days on market $25,000 Active 229 DOM
-
2026-06-01days on market $25,000 Active 228 DOM
-
2026-05-31days on market $25,000 Active 227 DOM
-
2026-05-31days on market $25,000 Active 226 DOM
-
2025-10-16$25,000 Active 625-char remark
Show marketing remark (625 chars)
Investment Opportunity Alert! Check out this fantastic property at 1410 E Poplar St West Frankfort IL 62896! This 2 bed, 1 bath home offers an 1250 sqft and is just waiting for your personal touch. While it needs some TLC, its priced to sell fast, making it a perfect candidate for a fix and flip or a project home! Dont Miss Out! With plenty of potential, this home is ready for your creative vision! Location: West Frankfort IL Opportunity: Unlimited! For more details or to schedule a viewing, contact: Joan Olson: 727-263-3034 | [email protected] Cash buyers only $500 EMD 7 day inspection 30 day close!
-
2025-05-31historical $770
-
2025-05-01$770
-
2023-10-06historical $584
-
2023-09-28historical $584
-
2023-09-15$584
-
2023-09-11$584
-
2023-09-07historical $584
-
2023-08-12$584
-
2022-03-31soldstatus $20,000 276-char remark
Show marketing remark (276 chars)
Starter Home or Investment Opportunity! 2 bed, 1 bath bungalow with hardwood floors throughout most of the home. Additional bonus rooms in the back of the home - 1 is very large (10x18) could eventually be a family room or anything. The 2nd is where the utilities are located.
-
2022-02-26$24,900 276-char remark
Show marketing remark (276 chars)
Starter Home or Investment Opportunity! 2 bed, 1 bath bungalow with hardwood floors throughout most of the home. Additional bonus rooms in the back of the home - 1 is very large (10x18) could eventually be a family room or anything. The 2nd is where the utilities are located.
-
2021-08-06historical
-
2021-08-06historical
-
2021-08-06historical
-
2005-11-16historical
-
2001-06-22historical
-
2000-12-29soldstatus $14,500
-
2000-12-29$15,900
ⓘ Source: listings_history table (triggers on properties + properties_extension) + one-shot
backfill from property_details.listing_events for pre-trigger history.
Tax reassessment forecast IL · Partial reset (capped growth)
- Current annual tax
- $1,043 · $87/mo
- Projected year-2 tax
- $1,043 · $87/mo
- Expected delta
- $0/yr ($0/mo · 0.0%)
ⓘ Screening estimate from a state-policy table — verify with the county assessor before closing.
Climate risk First Street
- Flood 1/10 Low FEMA zone X (unshaded) · 0% chance over 30 yrs
- Wildfire 1/10 Low
- Heat 5/10 Major 7 d/yr ≥107°F today · 20 d/yr by 30 yrs out
- Wind 2/10 Low 2% chance of damaging wind over 30 yrs
- Air quality 2/10 Low 0 unhealthy d/yr today · 1 by 30 yrs out
Nearby sold comps map
Loading sold comps map…
Walkable amenities ~0.75 mi
Loading nearby amenities…
Taxation est. · year 1
- Rental income
- $9,941
- − Mortgage interest
- −$1,400
- − Property taxes
- −$1,043
- − Insurance
- −$125
- − Repairs & maintenance
- −$795
- − Management
- −$795
- − Depreciation
- −$727
- Taxable income
- $5,055
- Est. tax owed @ 24.0%
- −$1,213
- After-tax cash flow
- $3,899/yr
For passive investors: Depreciation is non-cash, so a rental often shows a tax loss while cash-flowing — sheltering income. Rental losses are passive: they offset passive income freely, and up to $25,000/yr can offset ordinary (W-2) income if you actively participate and your MAGI is under $100k (phasing out to $0 by $150k); unused losses carry forward. On sale, claimed depreciation is recaptured at up to 25%, and gains may owe capital-gains tax (a 1031 exchange can defer both). Figures are a year-1 estimate at your 24.0% rate — not tax advice; consult a CPA.
Schools (NCES district)
- District
- Frankfort CUSD 168
- NCES district ID
- 1741580
- Math proficiency
- 6% ▼ -9.00%
- Reading proficiency
- 16% ▼ -10.00%
- Median HH income
- $34,447
- Composite
- 8.93/100
- National rank
- #9886
- State rank
- #577 of 620 in IL
Livability — West Frankfort
- Score
- 56/100
- State rank
- #1210
- US rank
- #22742
Category grades
Schools grade is shown separately in the Schools card above.
Census & demographics
- Census place
- West Frankfort, IL
- City population
- 10,691
- Population (ZIP)
- 10,691
Population outlook (Franklin County) Hauer SSP2
- Today (2025)
- 37,954 people
- By 2030
- 36,828 · -3.0%
- By 2040
- 34,452 · -9.2%
- By 2050
- 31,855 · -16.1%
- By 2075
- 25,171 · -33.7%
- By 2100
- 18,462 · -51.4%
Race, ethnicity, and origin ACS 2023
- Neighborhood character
- Predominantly White (96%)
- Race & ethnicity
- White 96% Two or more races 2%
- Common ancestry
- Romanian 2% Lithuanian 1% Iranian 1%
- Foreign-born
- 1% · Canada, Jamaica
- Languages at home
- 98% English-only · Spanish 1%
Political lean MEDSL · Franklin
- 2024 margin
- Solid R (+50.6) · D 24.1% · R 74.6% · Other 1.3%
- 2008→2024 swing
- -47.8pp toward R · 2008: -2.8pp · 2024: -50.6pp
- All cycles
- 2024: R+50.6 2020: R+47.5 2016: R+45.3 2012: R+16.8 2008: R+2.8
Not yet ingested
- Civics
- —
Market trends
- HPI YoY
- ▼ -94.00%
- Current HPI
- 86.36
- Rent YoY
- —
- Metro
- —
- State GDP YoY
- ▲ 1.59%
- F500 in state
- 60
Industry mix (Fortune 500 HQ in IL)
| Industry | F500 HQs | Revenue |
|---|---|---|
| Insurance | 4 | $201B |
|
||
| Consumer Goods | 4 | $87B |
|
||
| Industrial Machinery | 3 | $64B |
|
||
| Healthcare | 2 | $55B |
|
||
| Retail / Pharmacy | 1 | $148B |
|
||
| Agriculture / Food | 1 | $86B |
|
||
Price history
+72.4% since first listed20 events — show timeline
- 2025-10-16 Listed $25,000 ForSaleByOwner.com
- 2025-05-31 Rental Removed $770 Hemlane
- 2025-05-01 Listed for Rent $770 Hemlane
- 2023-10-06 Rental Removed $584 APPFOLIO
- 2023-09-28 Rental Removed $584 RENT.
- 2023-09-15 Listed for Rent $584 RENT.
- 2023-09-11 Listed for Rent $584 APPFOLIO
- 2023-09-07 Rental Removed $584 RENT.
- 2023-08-12 Listed for Rent $584 RENT.
- 2022-03-31 Sold (MLS) $20,000 RMLSA as Distributed by MLS Grid
- 2022-03-31 Sold (MLS) $20,000 MRED as Distributed by MLS Grid
- 2022-02-26 Listed $24,900 RMLSA as Distributed by MLS Grid
- 2022-02-26 Listed $24,900 MRED as Distributed by MLS Grid
- 2021-08-06 Listing Removed — RMLSA as Distributed by MLS Grid
- 2021-08-06 Listing Removed — RMLSA as Distributed by MLS Grid
- 2021-08-06 Listing Removed — RMLSA as Distributed by MLS Grid
- 2005-11-16 Listing Removed — MRED as Distributed by MLS Grid
- 2001-06-22 Listing Removed — MRED as Distributed by MLS Grid
- 2000-12-29 Listed $15,900 RMLSA as Distributed by MLS Grid
- 2000-12-29 Sold (MLS) $14,500 RMLSA as Distributed by MLS Grid
Property tax history
+2.5%/yrLatest (2024): $1,043 · +3.1% YoY. Source: county tax records.
Cash-flow waterfall
monthlySold comps — $/sqft
last 12 mo · ≤1 miLoading sold comps…