 🔨 Auction
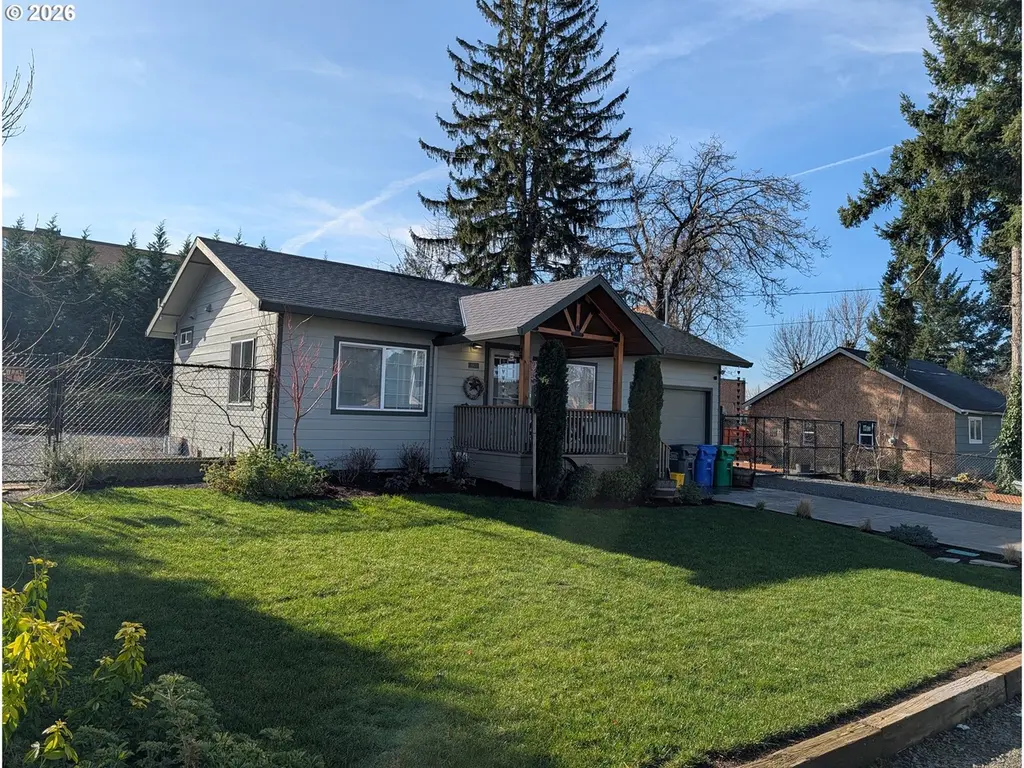
8818 SE Rhone St · Portland, OR
Flood risk 1/10 · Minimal
- FEMA flood zone
- X (unshaded)
- Chance of flooding over 30 yrs
- 0.0%
- Est. flood insurance / yr
- $507 – $1,088
Fire risk 1/10 · Minimal
- Est. fire insurance / yr
- $498 – $926
Heat risk 3/10 · Minor
- Hot days now (above 92°F)
- 7 days/yr
- Hot days in 30 yrs
- 15 days/yr
Wind risk 1/10 · Minimal
- Chance of severe wind over 30 yrs
- —
Air-quality risk 10/10 · Severe
- Unhealthy air days now
- 19 days/yr
- Unhealthy air days in 30 yrs
- 21 days/yr
Risk factors via First Street. Map © Google.
Why this score? — see what drove the F grade
The composite is a weighted blend of 9 inputs, each scored 0–100. Each bar is that input's sub-score; the figure is the points it added to the 100-point composite (weight × sub-score).
- ARV discount +7.5/15.0
- Schools +4.7/10.0
- Livability +3.9/5.0
- Rent growth +2.5/5.0
- Condition / age +2.5/5.0
- Cash flow +2.2/30.0
- 1% rule +0.0/10.0
- DSCR +0.0/10.0
- Appreciation +0.0/10.0
—
🖨 Deal sheet 📄 Offer letter ✓ Due diligence
Listing remarks MLS
These three home are being offered together as part of a 13-property, 43-unit residential portfolio that is 98% leased. Primarily located in Southeast and Northeast Portland, the portfolio is being sold via Sealed Bid Auction on June 3, 2026.All three homes and the vacant land are on a 27,352± Sq. Ft. tax lot. RM1 zoning could allow a duplex on the undeveloped portion of the property so new owner could expand rental income to five units. The small home has been renovated and is currently being used as an office by the Seller. Projected 2026 gross income is $34,860 and could be increased by $1,000± a month with leasing of home currently used as office. Real estate taxes are $8,388. Landlord is responsible for trash.
Key facts
- 0.63 acre lot
- Built 1942
- Listed 58 days
Neighborhood map
What this means for you Summary
Snapshot
- This is a 2-bed/1.0-bath single-family listed at $343k.
Deal economics
- At list price, monthly cash flow is $-1k ($-15k/yr) — negative.
- To cash-flow at today's rent, offer at most $164k (52.3% below list).
- To meet the 1% rule (rent ≥ 1% of price), the offer needs to be $143k (58.2% below list).
- Recommended offer: $143k (58.2% below list) — sets the bar for 1% rule.
Location & tenants
- Location reads 77/100 on livability (#72 in OR, #3,256 nationally) — a middle-class / working-renter tenant base. Strengths: amenities A+, commute A+, health & safety A+; Watch: crime F, cost of living F.
- Portland SD 1J (urban): math 46% / reading 58% proficiency, ranked #23 of 183 in OR (top 13%) — acceptable for families but not a draw, mixed tenant base, ~2y average lease.
- Market conditions: Rents soft (-0.1%/yr); 205 active listings in the ZIP; 40 comparable units currently listed for rent nearby; rentals at typical pace (median 24d on market — plan ~3-4 weeks tenant-placement turnaround); 2,041 units permitted in Multnomah County in 2024 (905 in 5+ unit buildings).
Forward outlook
- Local home prices are declining (-3.0%/yr); year-one equity from $2k of loan paydown is wiped out by about $10k of value loss. Plan a longer hold.
- Multnomah County population projected at +33% by 2050 — long-run rental-demand tailwind backs the buy-and-hold thesis.
Negotiation context
- It's been on market 58 days — a 3% lower offer ($332k) is reasonable based on typical stale-listing flexibility.
- Current owner paid $46k; list at $343k implies a 645% gain — meaningful room to come down on a strong offer.
Risks & watch-outs
- Watch-outs: built in 1942 — expect roof / HVAC / electrical / plumbing capex.
Questions for the listing agent
- What do current leases actually rent for vs. the listed asking? Can we see a recent rent roll and the last 12 months of T-12 income?
- It's been on market 58 days. Have you received any prior offers? Is the seller open to a 58% concession, seller financing, or rate buy-down credit?
- Built in 1942 — when were the roof, HVAC, electrical panel, plumbing, and water heater last replaced?
- Is there a deadline driving the sale (1031 exchange, divorce, estate, relocation)? That informs how much negotiation room exists.
- Crime grade is F in this area — have there been break-ins, vandalism, or insurance claims at this property in the last 3 years? What carrier currently insures it and at what premium?
- The area grade is low — what's the realistic commute time and amenity access for the typical tenant pool here? Any planned neighborhood developments (good or bad) we should know about?
- What's the average days-on-market for RENTAL listings here right now (not sales)? A rising rental-DOM trend means longer vacancies and softer asking-rent achievability than the comps imply.
- What's the recent tenant-quality profile in this submarket — average credit score on applications, eviction rate, late-payment / NSF rate, and stable-employment percentage? A property-management company in the area should have these aggregated.
- How much new for-sale + rental construction is in the pipeline within 1–3 miles? Heavy new supply typically softens prices + rents 12–24 months out; constrained supply supports both.
Investment metrics
- 1% rule
- 0.42% ✗
- Cap rate
- 1.96%
- Cash-on-cash
- -15.48%
- DSCR
- 0.31
- GRM
- 20.0
CMA / ARV
- ARV (on-the-fly)
- $342,754
- Comps found
- 2
Show comp detail 2 sales within ~0.75 mi
| Address | Dist | Beds/Ba | Sqft | Sold | Price | $/sf | Match |
|---|---|---|---|---|---|---|---|
| 3406 SE 78th Ave | 0.56mi | 1/1.0 (-1) | 572 (-1%) | 24mo | $339,000 | $593 | 47 |
| 8621 SE Raymond Ct | 0.64mi | 1/1.0 (-1) | 615 (+6%) | 22mo | $333,500 | $542 | 36 |
Match score weights: distance 35% · size 25% · config 20% · recency 20%. Top-matched comps best support the ARV.
Projected returns pro-forma
-3.0% appreciation · 0.0% rent growth · sell at horizon
- IRR
- -49.3%
- Equity multiple
- -0.44×
- Total profit
- $-138,560
- Equity at exit
- $51,106
- IRR
- —
- Equity multiple
- -1.48×
- Total profit
- $-238,305
- Equity at exit
- $29,635
Cash invested: $95,971 (down + closing). Projections, not guarantees.
Landlord ↔ Tenant lean methodology
- Overall (CITY)
- 0 Strongly Tenant-Friendly
- State Oregon
- 28 Tenant-Leaning · D+6
- County
- — inherits STATE
- City Portland
- 0 Strongly Tenant-Friendly · D+39
ZIP-level market 97266
- Rents YoY
- -0.1%
- Active inventory
- 205
Monthly cashflow live
- Estimated rent
- $1,431 high interval (Pro) →
- Mortgage (P&I)
- −$1,797
- Tax est. 1.5%
- −$428 /mo · $5,141/yr
- Insurance
- −$143
- HOA
- −$0
- Vacancy / Maint / Mgmt
- −$301
- Net cashflow
- $-1,238
Break-even live
UW: 25.0% down · 7.5% · 30yr · 1.5% tax · 5.0% vac · 8.0% maint · 8.0% mgmt
Financing live
Cash to close
- Down payment
- $85,688
- Closing costs
- $10,283
- Reserves months
- —
- Total cash needed
- —
Loan-product check · same deal, 3 products live
Conventional
25% down · 7.5% · 30yr
- Down + closing
- —
- Monthly P&I
- —
- Monthly cashflow
- —
- DSCR
- —
- Eligible?
- —
Personal DTI + credit; lowest rate.
DSCR
20% down · 8.5% · 30yr
- Down + closing
- —
- Monthly P&I
- —
- Monthly cashflow
- —
- DSCR
- —
- Eligible?
- —
No personal income docs; deal must DSCR.
Hard money
10% down · 12.0% · 12mo
- Down + closing
- —
- Monthly P&I
- —
- Monthly cashflow
- —
- DSCR
- —
- Eligible?
- —
Short-term bridge; refi at stabilization.
Rent comps 40 comps
| Address | Beds | Baths | Sqft | Rent | $/sqft | DOM | Units | Dist |
|---|---|---|---|---|---|---|---|---|
| 3636 SE 86th Ave Unit 3644 Portland, OR | 1.0 | 1.0 | 650 | $1,285 | $1.98 | 2d | 1 | 0.10mi |
| 8509 SE Bush St Portland, OR | 1.0 | 1.0 | 470 | $1,260 | $2.68 | 43d | 1 | 0.13mi |
| 8105 SE Powell Blvd Portland, OR | 1.0–2.0 | 1.0 | 675 | $1,495 | $2.21 | 2d | 5 | 0.42mi |
| 8130 SE Woodward St Unit 103 Portland, OR | 1.0 | 1.0 | 529 | $1,199 | $2.27 | 20d | 1 | 0.56mi |
| 8130 SE Woodward St Portland, OR | 1.0 | 1.0 | 529 | $1,199 | $2.27 | 16d | 1 | 0.57mi |
| 8104 SE Raymond St Portland, OR | 1.0 | 1.0 | 515 | $1,145 | $2.22 | 14d | 1 | 0.70mi |
| 8104 SE Raymond St Apt 12B Portland, OR | 1.0 | 1.0 | 515 | $1,145 | $2.22 | 43d | 1 | 0.71mi |
| 8104 SE Raymond St Apt 14 Portland, OR | 1.0 | 1.0 | 525 | $1,195 | $2.28 | 23d | 1 | 0.71mi |
| 2440-2468 SE 87th Ave Unit 315-2460 Portland, OR | 1.0 | 1.0 | 460 | $1,099 | $2.39 | 43d | 1 | 0.72mi |
| 7301 SE Powell Blvd Portland, OR | 1.0–2.0 | 1.0–1.5 | 710 | $1,495 | $2.11 | 43d | 4 | 0.80mi |
| 4539 SE 105th Ave Portland, OR | 1.0 | 1.0 | 440 | $1,500 | $3.41 | 43d | 1 | 0.93mi |
| 10735 SE Holgate Blvd Unit C Portland, OR | 1.0 | 1.0 | 500 | $1,295 | $2.59 | 43d | 1 | 1.00mi |
| 9224 SE Ramona St Portland, OR | 1.0 | 1.0–2.0 | 853 | $2,000 | $2.34 | 7d | 1 | 1.01mi |
| 7315 SE Mitchell Ct Portland, OR | 2.0 | 1.0 | 750 | $1,645 | $2.19 | 7d | 3 | 1.01mi |
| 7315 SE Mitchell Ct Portland, OR | 2.0 | 1.0 | 750 | $1,670 | $2.23 | 43d | 5 | 1.01mi |
| 5859 SE 92nd Ave Portland, OR | 1.0 | 1.0 | 685 | $1,209 | $1.76 | 43d | 2 | 1.03mi |
| 7298 SE Division St Unit 1X1 Portland, OR | 1.0 | 1.0 | 750 | $1,290 | $1.72 | 23d | 1 | 1.06mi |
| 6940 SE Long St Unit 7 Portland, OR | 1.0 | 1.0 | 552 | $1,150 | $2.08 | 43d | 1 | 1.06mi |
| 5230 SE 72nd Ave Portland, OR | 1.0 | 1.0 | 515 | $1,375 | $2.67 | 1d | 10 | 1.06mi |
| 6940 SE Long St Unit 9 Portland, OR | 2.0 | 1.0 | 642 | $1,350 | $2.10 | 43d | 1 | 1.06mi |
| 7215 SE Division St Unit 7215 Portland, OR | 2.0 | 1.0 | 700 | $1,595 | $2.28 | 14d | 1 | 1.08mi |
| 10941 SE Bush St Unit 22 Portland, OR | 2.0 | 1.0 | 700 | $1,100 | $1.57 | 23d | 1 | 1.08mi |
| 3414 SE 67th Ave Unit 3422 Portland, OR | 1.0 | 1.0 | 600 | $1,225 | $2.04 | 23d | 1 | 1.10mi |
| 6011 SE 90th Ave Unit 201 Portland, OR | 1.0 | 1.0 | 586 | $1,350 | $2.30 | 14d | 1 | 1.10mi |
| 11111 SE Bush St Unit 15 Portland, OR | 2.0 | 1.0 | 750 | $1,400 | $1.87 | 17d | 1 | 1.11mi |
| 11111 SE Bush St Unit 11111 Portland, OR | 2.0 | 1.0 | 750 | $1,450 | $1.93 | 43d | 1 | 1.12mi |
| 6080 SE 84th Ave Unit 301B Portland, OR | 2.0 | 1.0 | 552 | $1,475 | $2.67 | 2d | 1 | 1.15mi |
| 7116 SE Steele St Portland, OR | 1.0 | 1.0 | 700 | $1,650 | $2.36 | 43d | 1 | 1.16mi |
| 7110 SE Grant St Unit 7112 Portland, OR | 1.0 | 1.0 | 700 | $1,350 | $1.93 | 23d | 1 | 1.19mi |
| 9626 SE Foster Rd Portland, OR | 2.0 | 1.0 | 750 | $1,150 | $1.53 | 10d | 1 | 1.21mi |
| 8113 SE Clay St Unit 8117 Portland, OR | 1.0 | 1.0 | 736 | $995 | $1.35 | 43d | 1 | 1.22mi |
| 6720 SE Division St Unit 6846 Portland, OR | 1.0 | 1.0 | 613 | $1,095 | $1.79 | 23d | 1 | 1.27mi |
| 6355 SE 92nd Ave Unit 207 Portland, OR | 1.0 | 1.0 | 635 | $1,370 | $2.16 | 23d | 1 | 1.27mi |
| 6355 SE 92nd Ave Unit 107 Portland, OR | 1.0 | 1.0 | 636 | $1,410 | $2.22 | 43d | 1 | 1.27mi |
| 6355 SE 92nd Ave Portland, OR | 1.0 | 1.0 | 636 | $1,430 | $2.25 | 23d | 1 | 1.27mi |
| 6355 SE 92nd Ave Portland, OR | 1.0 | 1.0 | 623 | $1,374 | $2.20 | 7d | 4 | 1.27mi |
| 6355 SE 92nd Ave Portland, OR | 1.0 | 1.0 | 615 | $1,445 | $2.35 | 43d | 1 | 1.27mi |
| 7171 SE Knight St Portland, OR | 1.0 | 1.0 | 602 | $1,475 | $2.45 | 14d | 1 | 1.32mi |
| 8121 SE Salmon St Portland, OR | 1.0 | 1.0 | 705 | $1,025 | $1.45 | 2d | 1 | 1.39mi |
| 6400 SE Division St Portland, OR | 1.0 | 1.0 | 594 | $1,295 | $2.18 | 2d | 1 | 1.40mi |
Listing history 14 events
-
2026-06-18days on market Active 58 DOM
-
2026-06-17days on market Active 57 DOM
-
2026-06-16days on market Active 56 DOM
-
2026-06-15days on market Active 55 DOM
-
2026-06-13days on market Active 53 DOM
-
2026-06-09days on market Active 49 DOM
-
2026-06-08days on market Active 48 DOM
-
2026-06-07pricedays on market Active 47 DOM
-
2026-06-03days on market $45,000 Active 6 DOM
-
2026-06-02days on market $45,000 Active 5 DOM
-
2026-06-01days on market $45,000 Active 4 DOM
-
2026-05-31days on market $45,000 Active 3 DOM
-
2026-04-21Active 739-char remark
Show marketing remark (739 chars)
These three home are being offered together as part of a 13-property, 43-unit residential portfolio that is 98% leased. Primarily located in Southeast and Northeast Portland, the portfolio is being sold via Sealed Bid Auction on June 3, 2026.All three homes and the vacant land are on a 27,352± Sq. Ft. tax lot. RM1 zoning could allow a duplex on the undeveloped portion of the property so new owner could expand rental income to five units. The small home has been renovated and is currently being used as an office by the Seller. Projected 2026 gross income is $34,860 and could be increased by $1,000± a month with leasing of home currently used as office. Real estate taxes are $8,388. Landlord is responsible for trash.
-
1986-01-01soldstatus $46,000
ⓘ Source: listings_history table (triggers on properties + properties_extension) + one-shot
backfill from property_details.listing_events for pre-trigger history.
Climate risk First Street
- Flood 1/10 Low FEMA zone X (unshaded) · 0% chance over 30 yrs
- Wildfire 1/10 Low
- Heat 3/10 Moderate 7 d/yr ≥92°F today · 15 d/yr by 30 yrs out
- Wind 1/10 Low
- Air quality 10/10 Extreme 19 unhealthy d/yr today · 21 by 30 yrs out
Nearby sold comps map
Loading sold comps map…
Walkable amenities ~0.75 mi
Loading nearby amenities…
Taxation est. · year 1
- Rental income
- $17,176
- − Mortgage interest
- −$19,200
- − Property taxes
- −$5,141
- − Insurance
- −$1,714
- − Repairs & maintenance
- −$1,374
- − Management
- −$1,374
- − Depreciation
- −$9,971
- Taxable loss
- −$21,598
- Est. tax savings @ 24.0%
- +$5,184
- After-tax cash flow
- $-9,672/yr
For passive investors: Depreciation is non-cash, so a rental often shows a tax loss while cash-flowing — sheltering income. Rental losses are passive: they offset passive income freely, and up to $25,000/yr can offset ordinary (W-2) income if you actively participate and your MAGI is under $100k (phasing out to $0 by $150k); unused losses carry forward. On sale, claimed depreciation is recaptured at up to 25%, and gains may owe capital-gains tax (a 1031 exchange can defer both). Figures are a year-1 estimate at your 24.0% rate — not tax advice; consult a CPA.
Schools (NCES district)
- District
- Portland SD 1J
- NCES district ID
- 4110040
- Math proficiency
- 46% ▼ -2.00%
- Reading proficiency
- 58% ▼ -3.00%
- Median HH income
- $57,851
- Composite
- 47.1/100
- National rank
- #5112
- State rank
- #23 of 183 in OR
Livability — Portland
- Score
- 77/100
- State rank
- #72
- US rank
- #3256
Category grades
Schools grade is shown separately in the Schools card above.
Census & demographics
- Census place
- Portland, OR
- County
- Multnomah County · 786,692 people
- City population
- 774,334
- Metro
- Portland-Vancouver-Hillsboro, OR-WA
- Population (ZIP)
- 35,423
- Household income
- $72,577
- Rent vs Own
- Severe rent burden
- 2167.0
Population outlook (Multnomah County) Hauer SSP2
- Today (2025)
- 930,825 people
- By 2030
- 996,904 · +7.1%
- By 2040
- 1,121,379 · +20.5%
- By 2050
- 1,242,124 · +33.4%
- By 2075
- 1,464,431 · +57.3%
- By 2100
- 1,576,181 · +69.3%
Race, ethnicity, and origin ACS 2023
- Neighborhood character
- Diverse neighborhood (Simpson 0.65)
- Race & ethnicity
- White 54% Asian 16% Hispanic / Latino 14% Two or more races 11% Black 7% Native American 2%
- Hispanic origin (detail)
- Mexican 11%
- Common ancestry
- Italian 3% Slovak 2% Portuguese 2%
- Foreign-born
- 21% · China, Vietnam, Canada
- Languages at home
- 70% English-only · Spanish 9% Vietnamese 6% Chinese 6%
Political lean MEDSL · Multnomah
- 2024 margin
- Solid D (+62.1) · D 79.3% · R 17.2% · Other 3.5%
- 2008→2024 swing
- +6.0pp toward D · 2008: 56.1pp · 2024: 62.1pp
- All cycles
- 2024: D+62.1 2020: D+61.3 2016: D+58.3 2012: D+54.9 2008: D+56.1
Not yet ingested
- Civics
- —
Market trends
- HPI YoY
- ▼ -300.41%
- Current HPI
- 308.6145
- Rent YoY
- ▼ -0.09%
- Metro
- Portland-Vancouver-Hillsboro, OR-WA
- State GDP YoY
- ▲ 2.05%
- F500 in state
- 2
Industry mix (Fortune 500 HQ in OR)
| Industry | F500 HQs | Revenue |
|---|---|---|
| Consumer Goods | 1 | $51B |
|
||
Price history
2 events — show timeline
- 2026-04-21 Listed — RMLS
- 1986-01-01 Sold (Public Records) $46,000 Public Records
Property tax history
+4.9%/yrLatest (2025): $8,388 · +3.7% YoY. Source: county tax records.
Cash-flow waterfall
monthlySold comps — $/sqft
last 12 mo · ≤1 miLoading sold comps…