None · Corpus Christi, TX
Flood risk 6/10 · Moderate
- FEMA flood zone
- X (unshaded)
- Chance of flooding over 30 yrs
- 0.67%
- Est. flood insurance / yr
- $507 – $1,088
Fire risk 1/10 · Minimal
- Est. fire insurance / yr
- $1,222 – $2,270
Heat risk 10/10 · Severe
- Hot days now (above 107°F)
- 7 days/yr
- Hot days in 30 yrs
- 27 days/yr
Wind risk 9/10 · Severe
- Chance of severe wind over 30 yrs
- 99.0%
Air-quality risk 1/10 · Minimal
- Unhealthy air days now
- 0 days/yr
- Unhealthy air days in 30 yrs
- 0 days/yr
Risk factors via First Street. Map © Google.
Why this score? — see what drove the C- grade
The composite is a weighted blend of 9 inputs, each scored 0–100. Each bar is that input's sub-score; the figure is the points it added to the 100-point composite (weight × sub-score).
- Cash flow +18.4/30.0
- ARV discount +10.7/15.0
- DSCR +5.8/10.0
- 1% rule +5.5/10.0
- Livability +3.9/5.0
- Schools +2.8/10.0
- Condition / age +2.5/5.0
- Rent growth +2.1/5.0
- Appreciation +0.0/10.0
$185,000
🖨 Deal sheet 📄 Offer letter ✓ Due diligence
Listing remarks MLS
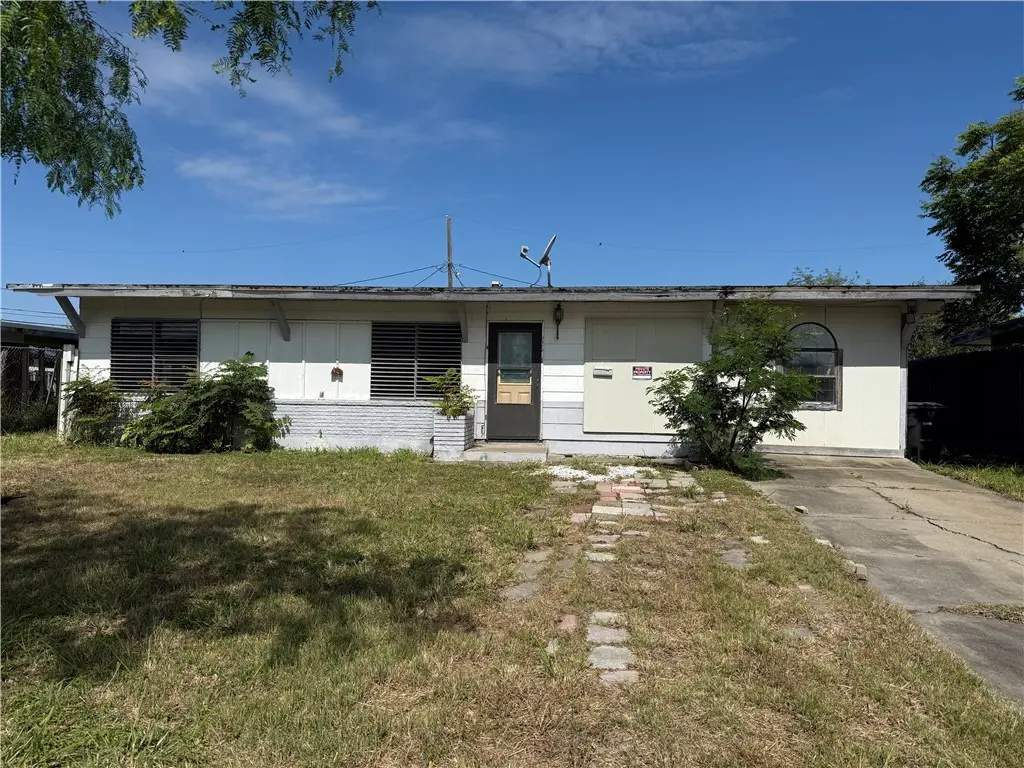
Calling all Investors! This property offers a great opportunity for anyone looking to get their hands on a fixer-upper and make it their own. This house is being sold AS IS.
Key facts
- 7,209 sq ft lot
- Built 1955
- Listed 59 days
Neighborhood map
What this means for you Summary
Snapshot
- This is a 4-bed/3.0-bath single-family listed at $185k.
Deal economics
- At list price, monthly cash flow is $172 ($2k/yr) — positive.
- The deal already cash-flows at list — no discount required.
- Meets the 1% rule at list price ($2k rent vs $185k).
- Recommended offer: $179k (3.0% below list) — sets the bar for market timing.
- Cap rate 7.4% vs local median 3.6% in Corpus Christi — top-decile yield for the area; either an underpriced asset or a hidden risk that comps aren't pricing in. Stress-test before assuming the spread holds.
Location & tenants
- Location reads 78/100 on livability (#66 in TX, #2,404 nationally) — a middle-class / working-renter tenant base. Strengths: commute A+, cost of living A+, housing A+; Watch: crime F.
- Corpus Christi ISD (urban): math 31% / reading 35% proficiency, ranked #562 of 826 in TX (top 68%) — families likely to look elsewhere, expect single-tenant / working-renter base with shorter leases; 63% free/reduced lunch — lower-income household profile, screen leases tightly.
- Market conditions: Rents soft (-1.5%/yr); 207 active listings in the ZIP; 14 comparable units currently listed for rent nearby; rentals at typical pace (median 21d on market — plan ~3-4 weeks tenant-placement turnaround); 1,397 units permitted in Nueces County in 2024 (47 in 5+ unit buildings).
- This rent runs 38% of the median local income ($61k/yr) — at the standard rent-burdened threshold; future hikes will face affordability resistance.
Forward outlook
- Local home prices are declining (-3.0%/yr); year-one equity from $1k of loan paydown is wiped out by about $6k of value loss. Plan a longer hold.
- Nueces County population projected at +36% by 2050 — long-run rental-demand tailwind backs the buy-and-hold thesis.
Negotiation context
- It's been on market 59 days — a 3% lower offer ($179k) is reasonable based on typical stale-listing flexibility.
- 2 sale attempts with the ask held roughly flat each time — persistent listings suggest the price (not the market) is what's stuck; bring a comps-based counter.
Risks & watch-outs
- Watch-outs: built in 1955 — expect roof / HVAC / electrical / plumbing capex.
- Climate carrying-cost: major flood risk; severe wind risk, 99% chance of damaging wind over 30y; extreme-heat days projected 7→27/yr by 2055 (HVAC capex compounding) — expect insurance premiums to compound above CPI over the hold.
Questions for the listing agent
- It's been on market 59 days. Have you received any prior offers? Is the seller open to a 3% concession, seller financing, or rate buy-down credit?
- Built in 1955 — when were the roof, HVAC, electrical panel, plumbing, and water heater last replaced?
- Is there a deadline driving the sale (1031 exchange, divorce, estate, relocation)? That informs how much negotiation room exists.
- Crime grade is F in this area — have there been break-ins, vandalism, or insurance claims at this property in the last 3 years? What carrier currently insures it and at what premium?
- What's the average days-on-market for RENTAL listings here right now (not sales)? A rising rental-DOM trend means longer vacancies and softer asking-rent achievability than the comps imply.
- What's the recent tenant-quality profile in this submarket — average credit score on applications, eviction rate, late-payment / NSF rate, and stable-employment percentage? A property-management company in the area should have these aggregated.
- How much new for-sale + rental construction is in the pipeline within 1–3 miles? Heavy new supply typically softens prices + rents 12–24 months out; constrained supply supports both.
Investment metrics
- 1% rule
- 1.05% ✓
- Cap rate
- 7.41%
- Cash-on-cash
- 3.98%
- DSCR
- 1.18
- GRM
- 7.9
CMA / ARV
- ARV (median comp)
- $199,031
- List price
- $185,000
- Delta
- -7.05%
- Verdict
- FAIR
- Comps
- 20 within 1.0 mi
Show comp detail 12 sales within ~0.75 mi
| Address | Dist | Beds/Ba | Sqft | Sold | Price | $/sf | Match |
|---|---|---|---|---|---|---|---|
| 1041 Whitaker Dr | 0.30mi | 4/3.0 | 1,653 (-10%) | 0mo | $229,900 | $139 | 68 |
| 1118 Stratton Dr | 0.45mi | 3/2.0 (-1) | 1,837 (-0%) | 4mo | $279,500 | $152 | 66 |
| 479 Homecrest St | 0.66mi | 3/2.0 (-1) | 1,918 (+4%) | 0mo | $139,995 | $73 | 53 |
| 533 Parade Dr | 0.61mi | 4/2.0 | 2,017 (+9%) | 1mo | $250,000 | $124 | 51 |
| 534 Parade Dr | 0.63mi | 3/2.0 (-1) | 1,724 (-6%) | 3mo | $219,900 | $128 | 48 |
| 445 Haroldson Dr | 0.73mi | 3/2.0 (-1) | 1,893 (+3%) | 5mo | $205,900 | $109 | 48 |
| 942 Woodlawn | 0.20mi | 3/1.0 (-1) | 1,615 (-12%) | 12mo | $195,000 | $121 | 47 |
| 6022 Norvel Dr | 0.42mi | 4/2.0 | 1,581 (-14%) | 10mo | $199,900 | $126 | 45 |
| 466 Palmetto St | 0.72mi | 3/2.0 (-1) | 1,956 (+6%) | 8mo | $329,900 | $169 | 40 |
| 484 Palmetto St | 0.68mi | 3/2.0 (-1) | 2,013 (+9%) | 6mo | $269,900 | $134 | 38 |
| 5802 Riley Dr | 0.66mi | 3/2.0 (-1) | 1,594 (-14%) | 10mo | $178,500 | $112 | 29 |
| 445 Troy Dr | 0.74mi | 3/2.0 (-1) | 1,631 (-12%) | 10mo | $159,000 | $97 | 29 |
Match score weights: distance 35% · size 25% · config 20% · recency 20%. Top-matched comps best support the ARV.
Projected returns pro-forma
-3.0% appreciation · 0.0% rent growth · sell at horizon
- IRR
- -13.7%
- Equity multiple
- 0.52×
- Total profit
- $-24,633
- Equity at exit
- $27,584
- IRR
- -10.8%
- Equity multiple
- 0.44×
- Total profit
- $-28,995
- Equity at exit
- $15,995
Cash invested: $51,800 (down + closing). Projections, not guarantees.
Landlord ↔ Tenant lean methodology
- Overall (STATE)
- 87 Strongly Landlord-Friendly
- State Texas
- 87 Strongly Landlord-Friendly · R+5
- County
- — inherits STATE
- City
- — inherits STATE
ZIP-level market 78412
- Rents YoY
- -1.5%
- Active inventory
- 207
- Price-to-rent
- 7.9×
Monthly cashflow live
- Estimated rent
- $1,940 high interval (Pro) →
- Mortgage (P&I)
- −$970
- Tax from tax record
- −$313 /mo · $3,757/yr
- Insurance
- −$77
- HOA
- −$0
- Vacancy / Maint / Mgmt
- −$407
- Net cashflow
- $172
Break-even live
UW: 25.0% down · 7.5% · 30yr · 1.5% tax · 5.0% vac · 8.0% maint · 8.0% mgmt
Financing live
Cash to close
- Down payment
- $46,250
- Closing costs
- $5,550
- Reserves months
- —
- Total cash needed
- —
Loan-product check · same deal, 3 products live
Conventional
25% down · 7.5% · 30yr
- Down + closing
- —
- Monthly P&I
- —
- Monthly cashflow
- —
- DSCR
- —
- Eligible?
- —
Personal DTI + credit; lowest rate.
DSCR
20% down · 8.5% · 30yr
- Down + closing
- —
- Monthly P&I
- —
- Monthly cashflow
- —
- DSCR
- —
- Eligible?
- —
No personal income docs; deal must DSCR.
Hard money
10% down · 12.0% · 12mo
- Down + closing
- —
- Monthly P&I
- —
- Monthly cashflow
- —
- DSCR
- —
- Eligible?
- —
Short-term bridge; refi at stabilization.
Rent comps 14 comps
| Address | Beds | Baths | Sqft | Rent | $/sqft | DOM | Units | Dist |
|---|---|---|---|---|---|---|---|---|
| 857 Belmeade Dr Corpus Christi, TX | 3.0 | 2.0 | 1573 | $1,800 | $1.14 | 43d | 1 | 0.69mi |
| 441 Montclair Dr Corpus Christi, TX | 3.0 | 2.0 | 2271 | $2,200 | $0.97 | 13d | 1 | 0.81mi |
| 449 Parade Dr Corpus Christi, TX | 4.0 | 2.0 | 2085 | $1,895 | $0.91 | 13d | 1 | 0.81mi |
| 6433 Aspenwood Dr Corpus Christi, TX | 3.0 | 2.0 | 1465 | $1,750 | $1.19 | 43d | 1 | 0.94mi |
| 1137 Bradshaw Dr Corpus Christi, TX | 3.0 | 2.0 | 1424 | $1,900 | $1.33 | 13d | 1 | 1.10mi |
| 6629 Rhine Dr Unit A Corpus Christi, TX | 3.0 | 2.0 | 1350 | $1,695 | $1.26 | 13d | 1 | 1.16mi |
| 6530 Ample Arbor Ct Corpus Christi, TX | 3.0 | 2.5 | 2256 | $2,400 | $1.06 | 43d | 1 | 1.18mi |
| 1066 Burkshire Dr Corpus Christi, TX | 3.0 | 2.0 | 2063 | $1,900 | $0.92 | 44d | 1 | 1.21mi |
| 16 Rock Creek Dr Corpus Christi, TX | 3.0 | 2.5 | 2450 | $1,950 | $0.80 | 21d | 1 | 1.24mi |
| 16 Rock Creek Dr #16 Corpus Christi, TX | 3.0 | 3.0 | 2450 | $1,955 | $0.80 | 21d | 1 | 1.24mi |
| 2001 Woodbend Dr Corpus Christi, TX | 2.0–3.0 | 2.0 | 1267 | $2,204 | $1.74 | 13d | 17 | 1.24mi |
| 6845 Rhine Dr Corpus Christi, TX | 3.0 | 1.5 | 1518 | $1,695 | $1.12 | 43d | 1 | 1.30mi |
| 2006 Melisa Ln Corpus Christi, TX | 3.0 | 1.0 | 1324 | $1,450 | $1.10 | 13d | 1 | 1.32mi |
| 2006 Melisa Ln Corpus Christi, TX | 3.0 | 1.0 | 1324 | $1,450 | $1.10 | 21d | 1 | 1.32mi |
Listing history 21 events
-
2026-06-18days on market $185,000 Active 59 DOM
-
2026-06-17days on market $185,000 Active 58 DOM
-
2026-06-16days on market $185,000 Active 57 DOM
-
2026-06-15days on market $185,000 Active 56 DOM
-
2026-06-14days on market $185,000 Active 54 DOM
-
2026-06-10days on market $185,000 Active 51 DOM
-
2026-06-09days on market $185,000 Active 50 DOM
-
2026-06-08days on market $185,000 Active 49 DOM
-
2026-06-07days on market $185,000 Active 48 DOM
-
2026-06-05days on market $185,000 Active 45 DOM
-
2026-06-03days on market $185,000 Active 44 DOM
-
2026-06-02days on market $185,000 Active 43 DOM
-
2026-06-01days on market $185,000 Active 42 DOM
-
2026-05-31days on market $185,000 Active 41 DOM
-
2026-05-30days on market $185,000 Active 40 DOM
-
2026-04-17$185,000 Active 173-char remark
Show marketing remark (173 chars)
Calling all Investors! This property offers a great opportunity for anyone looking to get their hands on a fixer-upper and make it their own. This house is being sold AS IS.
-
2025-09-12soldstatus
-
2025-08-17price $109,900
-
2025-07-07price $114,900
-
2025-06-23$119,900 Active
-
2025-06-18soldstatus
ⓘ Source: listings_history table (triggers on properties + properties_extension) + one-shot
backfill from property_details.listing_events for pre-trigger history.
Tax reassessment forecast TX · Resets to sale price
- Current annual tax
- $3,757 · $313/mo
- Projected year-2 tax
- $3,757 · $313/mo
- Expected delta
- $0/yr ($0/mo · -0.0%)
ⓘ Screening estimate from a state-policy table — verify with the county assessor before closing.
Climate risk First Street
- Flood 6/10 Major FEMA zone X (unshaded) · 67% chance over 30 yrs
- Wildfire 1/10 Low
- Heat 10/10 Extreme 7 d/yr ≥107°F today · 27 d/yr by 30 yrs out
- Wind 9/10 Extreme 99% chance of damaging wind over 30 yrs
- Air quality 1/10 Low 0 unhealthy d/yr today · 0 by 30 yrs out
Nearby sold comps map
Loading sold comps map…
Walkable amenities ~0.75 mi
Loading nearby amenities…
Taxation est. · year 1
- Rental income
- $23,275
- − Mortgage interest
- −$10,363
- − Property taxes
- −$3,757
- − Insurance
- −$925
- − Repairs & maintenance
- −$1,862
- − Management
- −$1,862
- − Depreciation
- −$5,382
- Taxable loss
- −$876
- Est. tax savings @ 24.0%
- +$210
- After-tax cash flow
- $2,273/yr
For passive investors: Depreciation is non-cash, so a rental often shows a tax loss while cash-flowing — sheltering income. Rental losses are passive: they offset passive income freely, and up to $25,000/yr can offset ordinary (W-2) income if you actively participate and your MAGI is under $100k (phasing out to $0 by $150k); unused losses carry forward. On sale, claimed depreciation is recaptured at up to 25%, and gains may owe capital-gains tax (a 1031 exchange can defer both). Figures are a year-1 estimate at your 24.0% rate — not tax advice; consult a CPA.
Schools (NCES district)
- District
- Corpus Christi ISD
- NCES district ID
- 4815270
- Math proficiency
- 31% ▼ -18.00%
- Reading proficiency
- 35% ▼ -7.00%
- Median HH income
- $45,672
- Composite
- 28.27/100
- National rank
- #6793
- State rank
- #562 of 826 in TX
Livability — Corpus Christi
- Score
- 78/100
- State rank
- #66
- US rank
- #2404
Category grades
Schools grade is shown separately in the Schools card above.
Census & demographics
- Census place
- Corpus Christi, TX
- County
- Nueces County · 296,836 people
- City population
- 296,836
- Metro
- Corpus Christi, TX
- Population (ZIP)
- 38,631
- Household income
- $61,215
- Rent vs Own
- Severe rent burden
- 1932.0
Population outlook (Nueces County) Hauer SSP2
- Today (2025)
- 418,037 people
- By 2030
- 447,123 · +7.0%
- By 2040
- 505,911 · +21.0%
- By 2050
- 567,522 · +35.8%
- By 2075
- 729,686 · +74.6%
- By 2100
- 847,087 · +102.6%
Race, ethnicity, and origin ACS 2023
- Neighborhood character
- Diverse neighborhood (Simpson 0.56)
- Race & ethnicity
- Hispanic / Latino 57% White 34% Two or more races 29% Asian 4% Black 3%
- Hispanic origin (detail)
- Mexican 52%
- Common ancestry
- Slovak 2% Romanian 1% Lithuanian 1%
- Foreign-born
- 8% · Canada, China, Vietnam
- Languages at home
- 74% English-only · Spanish 22% Other Indo-European 1% Vietnamese 1%
Political lean MEDSL · Nueces
- 2024 margin
- R (+11.5) · D 43.8% · R 55.3%
- 2008→2024 swing
- -7.1pp toward R · 2008: -4.4pp · 2024: -11.5pp
- All cycles
- 2024: R+11.5 2020: R+2.9 2016: R+1.5 2012: R+3.2 2008: R+4.4
Not yet ingested
- Civics
- —
Market trends
- HPI YoY
- ▼ -255.29%
- Current HPI
- 177.36
- Rent YoY
- ▼ -1.53%
- Metro
- Corpus Christi, TX
- State GDP YoY
- ▲ 3.95%
- F500 in state
- 110
Industry mix (Fortune 500 HQ in TX)
| Industry | F500 HQs | Revenue |
|---|---|---|
| Energy | 16 | $1,198B |
|
||
| Technology | 5 | $198B |
|
||
| Engineering / Construction | 4 | $72B |
|
||
| Energy Services | 3 | $60B |
|
||
| Utilities | 3 | $41B |
|
||
| Healthcare | 2 | $330B |
|
||
Price history
+54.3% since first listed6 events — show timeline
- 2026-04-17 Listed $185,000 CBMLS
- 2025-09-12 Sold (Public Records) — Public Records
- 2025-08-17 Price Changed $109,900 CBMLS
- 2025-07-07 Price Changed $114,900 CBMLS
- 2025-06-23 Listed $119,900 CBMLS
- 2025-06-18 Sold (Public Records) — Public Records
Property tax history
+5.5%/yrLatest (2025): $3,757 · +6.5% YoY. Source: county tax records.
Cash-flow waterfall
monthlySold comps — $/sqft
last 12 mo · ≤1 miLoading sold comps…