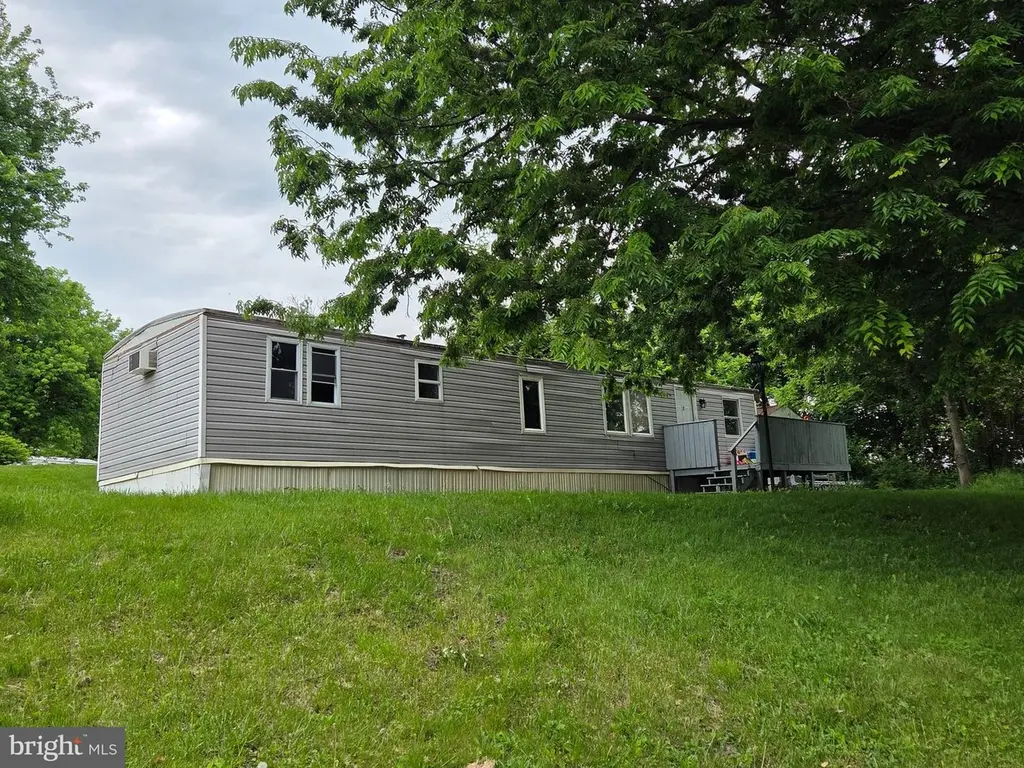
1 Northwood Mnr · Newberry, PA
Flood risk 1/10 · Minimal
- FEMA flood zone
- X (unshaded)
- Chance of flooding over 30 yrs
- 0.0%
- Est. flood insurance / yr
- $507 – $1,088
Fire risk 3/10 · Minor
- Est. fire insurance / yr
- $511 – $949
Heat risk 5/10 · Moderate
- Hot days now (above 102°F)
- 7 days/yr
- Hot days in 30 yrs
- 15 days/yr
Wind risk 3/10 · Minor
- Chance of severe wind over 30 yrs
- 8.0%
Air-quality risk 3/10 · Minor
- Unhealthy air days now
- 2 days/yr
- Unhealthy air days in 30 yrs
- 4 days/yr
Risk factors via First Street. Map © Google.
Why this score? — see what drove the B- grade
The composite is a weighted blend of 9 inputs, each scored 0–100. Each bar is that input's sub-score; the figure is the points it added to the 100-point composite (weight × sub-score).
- Cash flow +28.1/30.0
- 1% rule +10.0/10.0
- DSCR +10.0/10.0
- ARV discount +7.5/15.0
- Schools +4.7/10.0
- Rent growth +2.5/5.0
- Livability +2.5/5.0
- Condition / age +2.5/5.0
- Appreciation +0.0/10.0
$48,000
🖨 Deal sheet 📄 Offer letter ✓ Due diligence
Key facts
- Built 1985
- Listed 21 days
Property features AI
Finance
- Other: Property located in Newberry Township; use GPS for directions (house on main road)
- Financial info: Annual ground rent listed as income/expense item
- HOA & community: Ground rent $525 per month
Exterior
- Parking: Off-street parking
- Utilities: Public water; Public sewer; Electric service
- Home design: Manufactured property; Modular/Manufactured construction; Estimated year built
- Construction: Manufactured construction
- Exterior features: Not in a federal flood zone; Ground rent exists (paid monthly)
Interior
- Bedrooms: 2 bedrooms on the main level
- Bathrooms: 1 full bathroom on the main level; 1 full bathroom total
- Heating & cooling: 90% forced air heating; Propane (leased) heating fuel; Central air conditioning (electric); Electric hot water
- Interior features: No basement; Living area source: Assessor
Neighborhood map
What this means for you Summary
Snapshot
- This is a 2-bed/1.0-bath manufactured listed at $48k.
Deal economics
- At list price, monthly cash flow is $150 ($2k/yr) — positive.
- The deal already cash-flows at list — no discount required.
- Meets the 1% rule at list price ($1k rent vs $48k).
- Recommended offer: $47k (1.5% below list) — sets the bar for market timing.
Location & tenants
- Location reads: area grade B — affects rentability + tenant quality, not the cash-flow math above.
- Northeastern York SD (suburban): math 45% / reading 63% proficiency, ranked #119 of 539 in PA (top 22%) — acceptable for families but not a draw, mixed tenant base, ~2y average lease.
- Market conditions: 36 active listings in the ZIP; 1,328 units permitted in York County in 2024 (338 in 5+ unit buildings).
Forward outlook
- Local home prices are declining (-3.0%/yr); year-one equity from $332 of loan paydown is wiped out by about $1k of value loss. Plan a longer hold.
- At projected returns (-3.0% appreciation + 3.0% rent growth), your $13k cash investment doubles in ~9 years — after that, you're playing with house money.
Negotiation context
- It's been on market 21 days — a 2% lower offer ($47k) is reasonable based on typical stale-listing flexibility.
Risks & watch-outs
- Watch-outs: HOA is 42% of rent.
- Climate carrying-cost: extreme-heat days projected 7→15/yr by 2055 (HVAC capex compounding) — expect insurance premiums to compound above CPI over the hold.
Questions for the listing agent
- What does the HOA fee cover, when was the last increase, and are there any pending special assessments or reserve-fund shortfalls?
- Is there a deadline driving the sale (1031 exchange, divorce, estate, relocation)? That informs how much negotiation room exists.
- What's the average days-on-market for RENTAL listings here right now (not sales)? A rising rental-DOM trend means longer vacancies and softer asking-rent achievability than the comps imply.
- What's the recent tenant-quality profile in this submarket — average credit score on applications, eviction rate, late-payment / NSF rate, and stable-employment percentage? A property-management company in the area should have these aggregated.
- How much new for-sale + rental construction is in the pipeline within 1–3 miles? Heavy new supply typically softens prices + rents 12–24 months out; constrained supply supports both.
Investment metrics
- 1% rule
- 2.59% ✓
- Cap rate
- 10.05%
- Cash-on-cash
- 13.42%
- DSCR
- 1.60
- GRM
- 3.2
CMA / ARV
No comps found within radius.
Projected returns pro-forma
-3.0% appreciation · 3.0% rent growth · sell at horizon
- IRR
- 4.1%
- Equity multiple
- 1.16×
- Total profit
- $2,125
- Equity at exit
- $7,157
- IRR
- 14.0%
- Equity multiple
- 2.15×
- Total profit
- $15,509
- Equity at exit
- $4,150
Cash invested: $13,440 (down + closing). Projections, not guarantees.
Landlord ↔ Tenant lean methodology
- Overall (STATE)
- 62 Landlord-Friendly
- State Pennsylvania
- 62 Landlord-Friendly · EVEN
- County
- — inherits STATE
- City
- — inherits STATE
ZIP-level market 17370
- Home prices YoY
- -31.1%
- Active inventory
- 36
- Price-to-rent
- 3.2×
Monthly cashflow live
- Estimated rent
- $1,245 medium interval (Pro) →
- Mortgage (P&I)
- −$252
- Tax from tax record
- −$36 /mo · $435/yr
- Insurance
- −$20
- HOA
- −$525
- Vacancy / Maint / Mgmt
- −$261
- Net cashflow
- $150
Break-even live
UW: 25.0% down · 7.5% · 30yr · 1.5% tax · 5.0% vac · 8.0% maint · 8.0% mgmt
Financing live
Cash to close
- Down payment
- $12,000
- Closing costs
- $1,440
- Reserves months
- —
- Total cash needed
- —
Loan-product check · same deal, 3 products live
Conventional
25% down · 7.5% · 30yr
- Down + closing
- —
- Monthly P&I
- —
- Monthly cashflow
- —
- DSCR
- —
- Eligible?
- —
Personal DTI + credit; lowest rate.
DSCR
20% down · 8.5% · 30yr
- Down + closing
- —
- Monthly P&I
- —
- Monthly cashflow
- —
- DSCR
- —
- Eligible?
- —
No personal income docs; deal must DSCR.
Hard money
10% down · 12.0% · 12mo
- Down + closing
- —
- Monthly P&I
- —
- Monthly cashflow
- —
- DSCR
- —
- Eligible?
- —
Short-term bridge; refi at stabilization.
HOA detail
- Monthly dues
- $525 · $6,300/yr
Listing history 17 events
-
2026-06-18days on market $48,000 Active 21 DOM
-
2026-06-17days on market $48,000 Active 20 DOM
-
2026-06-16days on market $48,000 Active 19 DOM
-
2026-06-15days on market $48,000 Active 18 DOM
-
2026-06-14days on market $48,000 Active 16 DOM
-
2026-06-13days on market $48,000 Active 15 DOM
-
2026-06-10days on market $48,000 Active 13 DOM
-
2026-06-09days on market $48,000 Active 12 DOM
-
2026-06-08days on market $48,000 Active 11 DOM
-
2026-06-07days on market $48,000 Active 10 DOM
-
2026-06-05days on market $48,000 Active 7 DOM
-
2026-06-02days on market $48,000 Active 5 DOM
-
2026-06-01days on market $48,000 Active 4 DOM
-
2026-05-31days on market $48,000 Active 3 DOM
-
2026-05-30days on market $48,000 Active 2 DOM
-
2026-05-29$48,000 Active
-
2026-05-28historical $48,000
ⓘ Source: listings_history table (triggers on properties + properties_extension) + one-shot
backfill from property_details.listing_events for pre-trigger history.
Tax reassessment forecast PA · Partial reset (capped growth)
- Current annual tax
- $435 · $36/mo
- Projected year-2 tax
- $597 · $50/mo
- Expected delta
- +$162/yr (+$13/mo · 37.2%)
ⓘ Screening estimate from a state-policy table — verify with the county assessor before closing.
Climate risk First Street
- Flood 1/10 Low FEMA zone X (unshaded) · 0% chance over 30 yrs
- Wildfire 3/10 Moderate
- Heat 5/10 Major 7 d/yr ≥102°F today · 15 d/yr by 30 yrs out
- Wind 3/10 Moderate 8% chance of damaging wind over 30 yrs
- Air quality 3/10 Moderate 2 unhealthy d/yr today · 4 by 30 yrs out
Nearby sold comps map
Loading sold comps map…
Walkable amenities ~0.75 mi
Loading nearby amenities…
Taxation est. · year 1
- Rental income
- $14,936
- − Mortgage interest
- −$2,689
- − Property taxes
- −$435
- − Insurance
- −$240
- − Repairs & maintenance
- −$1,195
- − Management
- −$1,195
- − HOA
- −$6,300
- − Depreciation
- −$1,396
- Taxable income
- $1,487
- Est. tax owed @ 24.0%
- −$357
- After-tax cash flow
- $1,448/yr
For passive investors: Depreciation is non-cash, so a rental often shows a tax loss while cash-flowing — sheltering income. Rental losses are passive: they offset passive income freely, and up to $25,000/yr can offset ordinary (W-2) income if you actively participate and your MAGI is under $100k (phasing out to $0 by $150k); unused losses carry forward. On sale, claimed depreciation is recaptured at up to 25%, and gains may owe capital-gains tax (a 1031 exchange can defer both). Figures are a year-1 estimate at your 24.0% rate — not tax advice; consult a CPA.
Schools (NCES district)
- District
- Northeastern York SD
- NCES district ID
- 4217520
- Math proficiency
- 45% ▼ -12.00%
- Reading proficiency
- 63% ▼ -10.00%
- Median HH income
- $60,807
- Composite
- 47.06/100
- National rank
- #2338
- State rank
- #119 of 539 in PA
Livability — Newberry
No livability data for this city. (Only ~50 U.S. cities are tracked.)
Census & demographics
- Population (ZIP)
- 6,970
Population outlook (York County) Hauer SSP2
- Today (2025)
- 454,205 people
- By 2030
- 457,407 · +0.7%
- By 2040
- 457,529 · +0.7%
- By 2050
- 448,261 · -1.3%
- By 2075
- 427,388 · -5.9%
- By 2100
- 384,218 · -15.4%
Race, ethnicity, and origin ACS 2023
- Neighborhood character
- Predominantly White (87%)
- Race & ethnicity
- White 87% Two or more races 6% Hispanic / Latino 5% Black 4%
- Hispanic origin (detail)
- Puerto Rican 3%
- Common ancestry
- Romanian 5% Polish 3% Lithuanian 1%
- Foreign-born
- 1% · Canada
- Languages at home
- 98% English-only · Spanish 2%
Political lean MEDSL · York
- 2024 margin
- Strong R (+25.3) · D 36.9% · R 62.1%
- 2008→2024 swing
- -11.7pp toward R · 2008: -13.6pp · 2024: -25.3pp
- All cycles
- 2024: R+25.3 2020: R+24.6 2016: R+29.3 2012: R+21.2 2008: R+13.6
Not yet ingested
- Civics
- —
Market trends
- HPI YoY
- ▼ -112.20%
- Current HPI
- 248.9386
- Rent YoY
- —
- Metro
- —
- State GDP YoY
- ▲ 1.68%
- F500 in state
- 34
Industry mix (Fortune 500 HQ in PA)
| Industry | F500 HQs | Revenue |
|---|---|---|
| Healthcare | 2 | $309B |
|
||
| Insurance | 2 | $27B |
|
||
| Telecommunications / Media | 1 | $124B |
|
||
| Industrial Distribution | 1 | $22B |
|
||
| Financial Services | 1 | $20B |
|
||
| Chemicals / Materials | 1 | $18B |
|
||
Price history
+0.0% since first listed2 events — show timeline
- 2026-05-29 Listed $48,000 BRIGHT MLS
- 2026-05-28 Coming Soon $48,000 BRIGHT MLS
Property tax history
+6.7%/yrLatest (2025): $435 · +0.9% YoY. Source: county tax records.
Cash-flow waterfall
monthlySold comps — $/sqft
last 12 mo · ≤1 miLoading sold comps…