 Triplex
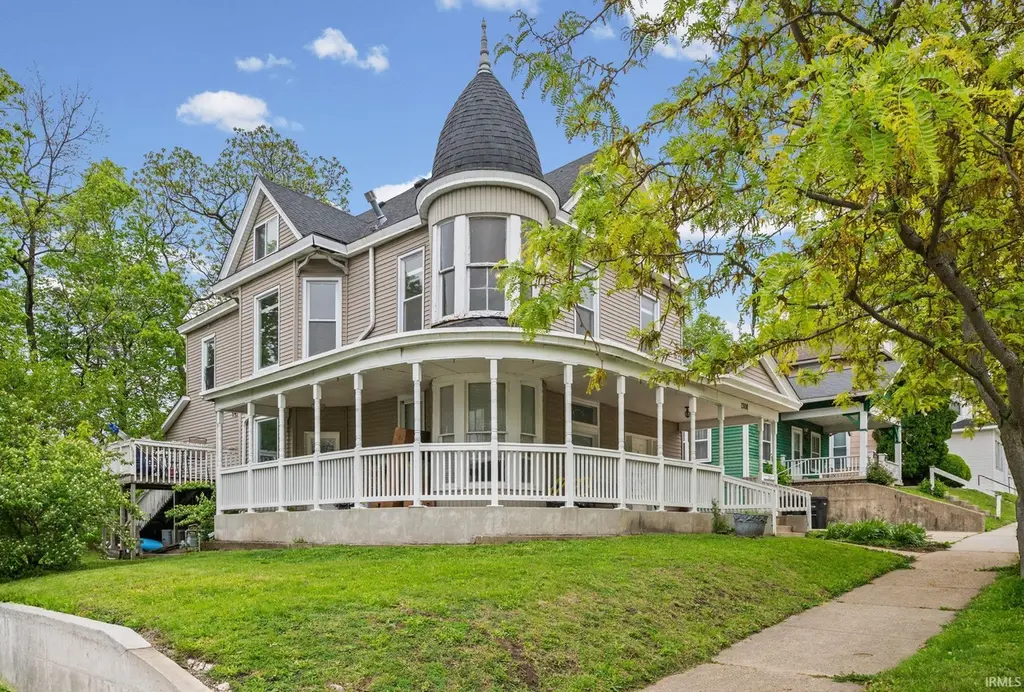
1308 South St · Lafayette, IN
Flood risk 1/10 · Minimal
- FEMA flood zone
- X (unshaded)
- Chance of flooding over 30 yrs
- 0.0%
- Est. flood insurance / yr
- $473 – $860
Fire risk 1/10 · Minimal
- Est. fire insurance / yr
- $717 – $1,331
Heat risk 3/10 · Minor
- Hot days now (above 102°F)
- 7 days/yr
- Hot days in 30 yrs
- 18 days/yr
Wind risk 2/10 · Minimal
- Chance of severe wind over 30 yrs
- —
Air-quality risk 2/10 · Minimal
- Unhealthy air days now
- 1 days/yr
- Unhealthy air days in 30 yrs
- 2 days/yr
Risk factors via First Street. Map © Google.
Why this score? — see what drove the B- grade
The composite is a weighted blend of 9 inputs, each scored 0–100. Each bar is that input's sub-score; the figure is the points it added to the 100-point composite (weight × sub-score).
- Cash flow +26.4/30.0
- DSCR +9.0/10.0
- Appreciation +6.8/10.0
- 1% rule +6.7/10.0
- ARV discount +5.0/15.0
- Rent growth +3.7/5.0
- Livability +3.7/5.0
- Schools +2.6/10.0
- Condition / age +2.5/5.0
$370,000
🖨 Deal sheet 📄 Offer letter ✓ Due diligence
Multi-family units
County records classify this as Multi-Family (2-4 Unit). Listing-text estimate: 3 units. confirmed
Listing remarks MLS
Nice, income producing triplex close to downtown. newer AC units, roof, and siding.
Key facts
- Dedicated parking
- 7,405 sq ft lot
- 3 parking spots
Tags
Property features AI
Finance
- Other: Pets allowed with breed restrictions
- Financial info: Annual taxes reported
Exterior
- Parking: 3 open parking spaces
- Utilities: Public water; Public sewer
- Home design: Residential income property; Triplex; 2 stories; Facing information not provided
- Construction: Vinyl siding; Built with a partial basement
- Exterior features: Level lot
Interior
- Kitchen: Range; Refrigerator
- Flooring: Carpet; Vinyl
- Bathrooms: 4 full bathrooms; 6 main-level bathrooms
- Heating & cooling: Central air conditioning; Forced air heating; Natural gas heating
- Interior features: Range; Refrigerator; Partial basement; Basement present
Neighborhood map
What this means for you Summary
Snapshot
- This is a 3 × 2-bed/1.3-bath units multifamily listed at $370k.
Deal economics
- At list price, monthly cash flow is $963 ($12k/yr) — positive. Per door: $321/mo.
- The deal already cash-flows at list — no discount required.
- Meets the 1% rule at list price ($4k rent vs $370k).
- Recommended offer: $359k (3.0% below list) — sets the bar for market timing.
- Cap rate 9.4% vs local median 4.2% in Lafayette — top-decile yield for the area; either an underpriced asset or a hidden risk that comps aren't pricing in. Stress-test before assuming the spread holds.
Location & tenants
- Location reads 74/100 on livability (#68 in IN, #4,374 nationally) — a middle-class / working-renter tenant base. Strengths: cost of living A+, housing A+, health & safety A+; Watch: amenities D+, employment D+, crime F.
- Lafayette School Corporation (urban): math 29% / reading 34% proficiency, ranked #235 of 301 in IN (top 78%) — families likely to look elsewhere, expect single-tenant / working-renter base with shorter leases; 63% free/reduced lunch — lower-income household profile, screen leases tightly.
- Zoned schools: Thomas Miller Elementary School (math 27% / reading 22%, grade F, #762 of 994 statewide, top 78%, 343 students, 85% FRL); Jefferson High School (math 23% / reading 55%, grade F, #235 of 369 statewide, top 65%, 2,118 students, 69% FRL).
- Market conditions: Rents rising fast (+4.8%/yr); 16 active listings in the ZIP; 1,341 units permitted in Tippecanoe County in 2024 (869 in 5+ unit buildings).
Forward outlook
- In year one you build about $16k of equity ($3k loan paydown + $13k appreciation (3.5% local appreciation)).
- Tippecanoe County population projected at +41% by 2050 — long-run rental-demand tailwind backs the buy-and-hold thesis.
- At projected returns (3.5% appreciation + 4.8% rent growth), your $104k cash investment doubles in ~4 years — after that, you're playing with house money.
- By year 3, paydown + projected appreciation supports a ~$39k cash-out refi (75% LTV) — recoverable capital for the next deal without selling this one.
Negotiation context
- It's been on market 39 days — a 3% lower offer ($359k) is reasonable based on typical stale-listing flexibility.
- 4 sale attempts since 15y ago with the ask held roughly flat each time — persistent listings suggest the price (not the market) is what's stuck; bring a comps-based counter.
- Current owner paid $275k; 35% above their basis — modest negotiation headroom, anchor on the comps not their cost.
Risks & watch-outs
- Watch-outs: built in 1890 — expect roof / HVAC / electrical / plumbing capex.
Questions for the listing agent
- It's been on market 39 days. Have you received any prior offers? Is the seller open to a 3% concession, seller financing, or rate buy-down credit?
- Can we see the unit-by-unit rent roll, current vacancy, and any below-market leases? What's the average tenancy length?
- What capital expenditures (roof, boiler, parking lot, exteriors) have been made in the last 5 years, and what's planned in the next 2?
- Built in 1890 — when were the roof, HVAC, electrical panel, plumbing, and water heater last replaced?
- Is there a deadline driving the sale (1031 exchange, divorce, estate, relocation)? That informs how much negotiation room exists.
- Schools are D-rated, which usually means shorter tenancies and higher turnover. Who's the typical renter profile here, and what's been the actual vacancy rate?
- Crime grade is F in this area — have there been break-ins, vandalism, or insurance claims at this property in the last 3 years? What carrier currently insures it and at what premium?
- What's the average days-on-market for RENTAL listings here right now (not sales)? A rising rental-DOM trend means longer vacancies and softer asking-rent achievability than the comps imply.
- What's the recent tenant-quality profile in this submarket — average credit score on applications, eviction rate, late-payment / NSF rate, and stable-employment percentage? A property-management company in the area should have these aggregated.
- How much new apartment / multifamily construction is in the pipeline within 1–3 miles? Heavy new supply (>2% of stock underway) typically softens rents 12–24 months out; light construction supports rent growth.
Investment metrics
- 1% rule
- 1.17% ✓
- Cap rate
- 9.42%
- Cash-on-cash
- 11.15%
- DSCR
- 1.50
- GRM
- 7.1
CMA / ARV
- ARV (median comp)
- $350,163
- List price
- $370,000
- Delta
- 5.67%
- Verdict
- FAIR
- Comps
- 20 within 1.0 mi
Projected returns pro-forma
3.53% appreciation · 4.83% rent growth · sell at horizon
- IRR
- 20.3%
- Equity multiple
- 2.20×
- Total profit
- $124,493
- Equity at exit
- $177,550
- IRR
- 22.0%
- Equity multiple
- 4.45×
- Total profit
- $357,306
- Equity at exit
- $282,656
Cash invested: $103,600 (down + closing). Projections, not guarantees.
Landlord ↔ Tenant lean methodology
- Overall (STATE)
- 90 Strongly Landlord-Friendly
- State Indiana
- 90 Strongly Landlord-Friendly · R+11
- County
- — inherits STATE
- City
- — inherits STATE
ZIP-level market 47901
- Home prices YoY
- 1.9%
- Rents YoY
- 4.8%
- Active inventory
- 16
- Price-to-rent
- 21.4×
Monthly cashflow live
- Estimated rent
- $4,320 high interval (Pro) →
- Mortgage (P&I)
- −$1,940
- Tax from tax record
- −$356 /mo · $4,268/yr
- Insurance
- −$154
- HOA
- −$0
- Vacancy / Maint / Mgmt
- −$907
- Net cashflow
- $963
Break-even live
3-unit breakdown (identical units grouped — click to expand)
| Units | Beds | Baths | Est. rent |
|---|---|---|---|
| 3× units | 2 | 1.3 | $4,320 |
| #1 | 2 | 1.3 | $1,440 |
| #2 | 2 | 1.3 | $1,440 |
| #3 | 2 | 1.3 | $1,440 |
| Total (3 units) | $4,320 | ||
UW: 25.0% down · 7.5% · 30yr · 1.5% tax · 5.0% vac · 8.0% maint · 8.0% mgmt
Financing live
Cash to close
- Down payment
- $92,500
- Closing costs
- $11,100
- Reserves months
- —
- Total cash needed
- —
Loan-product check · same deal, 3 products live
Conventional
25% down · 7.5% · 30yr
- Down + closing
- —
- Monthly P&I
- —
- Monthly cashflow
- —
- DSCR
- —
- Eligible?
- —
Personal DTI + credit; lowest rate.
DSCR
20% down · 8.5% · 30yr
- Down + closing
- —
- Monthly P&I
- —
- Monthly cashflow
- —
- DSCR
- —
- Eligible?
- —
No personal income docs; deal must DSCR.
Hard money
10% down · 12.0% · 12mo
- Down + closing
- —
- Monthly P&I
- —
- Monthly cashflow
- —
- DSCR
- —
- Eligible?
- —
Short-term bridge; refi at stabilization.
Listing history 22 events
-
2026-06-19days on market $370,000 Active 39 DOM
-
2026-06-18days on market $370,000 Active 38 DOM
-
2026-06-17days on market $370,000 Active 37 DOM
-
2026-06-16days on market $370,000 Active 36 DOM
-
2026-06-15days on market $370,000 Active 35 DOM
-
2026-06-14days on market $370,000 Active 33 DOM
-
2026-06-13days on market $370,000 Active 32 DOM
-
2026-06-10days on market $370,000 Active 30 DOM
-
2026-06-09days on market $370,000 Active 29 DOM
-
2026-06-08days on market $370,000 Active 28 DOM
-
2026-06-07days on market $370,000 Active 27 DOM
-
2026-06-02days on market $370,000 Active 22 DOM
-
2026-06-01days on market $370,000 Active 21 DOM
-
2026-05-31days on market $370,000 Active 20 DOM
-
2026-05-30days on market $370,000 Active 19 DOM
-
2026-05-11$370,000 Active 272-char remark
-
2023-04-21soldstatus $275,000 Closed
Show marketing remark (83 chars)
Nice, income producing triplex close to downtown. newer AC units, roof, and siding.
-
2023-03-05status Pending
Show marketing remark (83 chars)
Nice, income producing triplex close to downtown. newer AC units, roof, and siding.
-
2023-03-05$275,000 Active
Show marketing remark (83 chars)
Nice, income producing triplex close to downtown. newer AC units, roof, and siding.
-
2020-06-23soldstatus $231,000
-
2019-10-21$245,000
-
2011-09-09$205,000
ⓘ Source: listings_history table (triggers on properties + properties_extension) + one-shot
backfill from property_details.listing_events for pre-trigger history.
Tax reassessment forecast IN · Partial reset (capped growth)
- Current annual tax
- $4,268 · $356/mo
- Projected year-2 tax
- $4,268 · $356/mo
- Expected delta
- $0/yr ($0/mo · 0.0%)
ⓘ Screening estimate from a state-policy table — verify with the county assessor before closing.
Climate risk First Street
- Flood 1/10 Low FEMA zone X (unshaded) · 0% chance over 30 yrs
- Wildfire 1/10 Low
- Heat 3/10 Moderate 7 d/yr ≥102°F today · 18 d/yr by 30 yrs out
- Wind 2/10 Low
- Air quality 2/10 Low 1 unhealthy d/yr today · 2 by 30 yrs out
Nearby sold comps map
Loading sold comps map…
Walkable amenities ~0.75 mi
Loading nearby amenities…
Taxation est. · year 1
- Rental income
- $51,840
- − Mortgage interest
- −$20,726
- − Property taxes
- −$4,268
- − Insurance
- −$1,850
- − Repairs & maintenance
- −$4,147
- − Management
- −$4,147
- − Depreciation
- −$10,764
- Taxable income
- $5,938
- Est. tax owed @ 24.0%
- −$1,425
- After-tax cash flow
- $10,127/yr
For passive investors: Depreciation is non-cash, so a rental often shows a tax loss while cash-flowing — sheltering income. Rental losses are passive: they offset passive income freely, and up to $25,000/yr can offset ordinary (W-2) income if you actively participate and your MAGI is under $100k (phasing out to $0 by $150k); unused losses carry forward. On sale, claimed depreciation is recaptured at up to 25%, and gains may owe capital-gains tax (a 1031 exchange can defer both). Figures are a year-1 estimate at your 24.0% rate — not tax advice; consult a CPA.
Schools (NCES district)
- District
- Lafayette School Corporation
- NCES district ID
- 1805400
- Math proficiency
- 29% ▼ -9.00%
- Reading proficiency
- 34% ▼ -7.00%
- Median HH income
- $39,817
- Composite
- 26.46/100
- National rank
- #7217
- State rank
- #235 of 301 in IN
Livability — Lafayette
- Score
- 74/100
- State rank
- #68
- US rank
- #4374
Category grades
Schools grade is shown separately in the Schools card above.
Census & demographics
- Census place
- Lafayette, IN
- County
- Tippecanoe County · 181,820 people
- City population
- 106,622
- Metro
- Lafayette-West Lafayette, IN
- Population (ZIP)
- 4,585
- Household income
- $47,206
- Rent vs Own
- Severe rent burden
- 314.0
Population outlook (Tippecanoe County) Hauer SSP2
- Today (2025)
- 215,327 people
- By 2030
- 232,284 · +7.9%
- By 2040
- 266,517 · +23.8%
- By 2050
- 302,826 · +40.6%
- By 2075
- 394,445 · +83.2%
- By 2100
- 463,500 · +115.3%
Race, ethnicity, and origin ACS 2023
- Neighborhood character
- Predominantly White (73%)
- Race & ethnicity
- White 73% Black 15% Asian 6% Two or more races 4% Hispanic / Latino 4%
- Common ancestry
- Italian 5% Romanian 4% Slovak 3%
- Foreign-born
- 15% · China, Canada, South Korea
- Languages at home
- 87% English-only · Spanish 3% Other Indo-European 3% Chinese 2%
Political lean MEDSL · Tippecanoe
- 2024 margin
- Toss-up / Even · D 49.0% · R 49.1% · Other 1.9%
- 2008→2024 swing
- -11.8pp toward R · 2008: 11.6pp · 2024: -0.1pp
- All cycles
- 2024: R+0.1 2020: D+0.6 2016: R+5.7 2012: R+3.6 2008: D+11.6
Not yet ingested
- Civics
- —
Market trends
- HPI YoY
- ▲ 3.53%
- Current HPI
- 192.353
- Rent YoY
- ▲ 4.83%
- Metro
- Lafayette-West Lafayette, IN
- State GDP YoY
- ▲ 2.90%
- F500 in state
- 18
Industry mix (Fortune 500 HQ in IN)
| Industry | F500 HQs | Revenue |
|---|---|---|
| Industrial Machinery | 2 | $37B |
|
||
| Healthcare | 1 | $177B |
|
||
| Pharmaceuticals | 1 | $45B |
|
||
| Metals / Steel | 1 | $18B |
|
||
| Agriculture | 1 | $17B |
|
||
| Packaging | 1 | $12B |
|
||
Price history
+80.5% since first listed7 events — show timeline
- 2026-05-11 Listed $370,000 IRMLS
- 2023-04-21 Sold (MLS) $275,000 IRMLS
- 2023-03-05 Pending — IRMLS
- 2023-03-05 Listed $275,000 IRMLS
- 2020-06-23 Sold (MLS) $231,000 IRMLS
- 2019-10-21 Listed $245,000 IRMLS
- 2011-09-09 Listed $205,000 IRMLS
Property tax history
+5.6%/yrLatest (2024): $4,268 · +39.8% YoY. Source: county tax records.
Cash-flow waterfall
monthlySold comps — $/sqft
last 12 mo · ≤1 miLoading sold comps…