3521 Hank Dr · Heartland, TX
Flood risk No data
- FEMA flood zone
- —
- Chance of flooding over 30 yrs
- —
- Est. flood insurance / yr
- —
Fire risk No data
- Est. fire insurance / yr
- —
Heat risk No data
- Hot days now (above threshold)
- —
- Hot days in 30 yrs
- —
Wind risk No data
- Chance of severe wind over 30 yrs
- —
Air-quality risk No data
- Unhealthy air days now
- —
- Unhealthy air days in 30 yrs
- —
Risk factors via First Street. Map © Google.
Why this score? — see what drove the D grade
The composite is a weighted blend of 9 inputs, each scored 0–100. Each bar is that input's sub-score; the figure is the points it added to the 100-point composite (weight × sub-score).
- ARV discount +15.0/15.0
- Cash flow +11.0/30.0
- Schools +3.6/10.0
- 1% rule +3.5/10.0
- DSCR +3.2/10.0
- Rent growth +2.5/5.0
- Livability +2.5/5.0
- Condition / age +1.0/5.0
- Appreciation +0.0/10.0
$249,995
🖨 Deal sheet (PDF) 📄 Offer letter ✓ Due diligence
Listing remarks
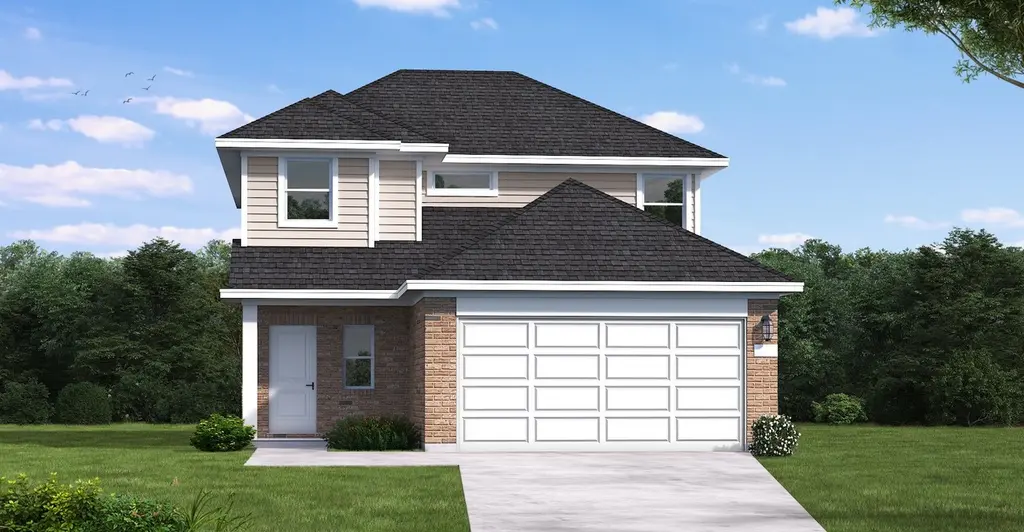
Experience the perfect blend of style, comfort, and quality in this beautifully designed two-story home featuring the sought-after Kerr floor plan. With 3 bedrooms and 2.5 bathrooms, this home offers a smart, functional layout ideal for both everyday living and entertaining. The first floor showcases an open-concept interior seamlessly connects the kitchen, dining, and living areas. Step outside to a covered patio that extends your living space, perfect for relaxing mornings or evening gatherings. Upstairs, the private primary suite provides a peaceful retreat, and two additional bedrooms offer flexibility for guests, family, or a home office. Complete with a 2-car garage, this home deliver
Key facts
- Double vanity
- Open floorplan
- Covered patio
Tags
Property features AI
Finance
- Other: Community amenities include pool, fitness center, park, playground, lake, community dock, fishing, jogging/bike paths, greenbelt and sidewalks
- Financial info: Treat as clear loan type; No second mortgage
- HOA & community: Mandatory homeowners association (Heartland Community Assoc.); HOA covers management fees; Annual association fee of $552
Exterior
- Parking: Attached 2-car garage with two 20' x 20' bay (2-car single door); Garage door opener; Garage faces front; 2 covered parking spaces
- Security: Smoke detectors; Carbon monoxide detector(s); Prewired for security
- Utilities: City water; City sewer; Individual gas meter; Individual water meter; Municipal utility district service; Community mailbox; Sidewalk access
- Home design: Single family residence; Two-story home; New construction completed in 2024; Not attached to another property; Located in the Heartland planned development
- Construction: Brick construction; Composition roof; Slab foundation; Smart home features enabled
- Exterior features: Covered porch; Covered patio/porch areas; Gutters; Outdoor lighting; Full wood fencing with gate; Landscaped lot with sprinkler system; Interior lot in a subdivision
Interior
- Kitchen: Dishwasher; Disposal; Electric oven; Gas cooktop; Microwave; Kitchen island; Granite counters; Pantry; Eat-in kitchen
- Bedrooms: 3 bedrooms total; Primary bedroom located on the second level
- Flooring: Carpet; Ceramic tile; Laminate
- Bathrooms: 2 full bathrooms; 1 half bathroom
- Heating & cooling: Central heating (natural gas); Central air; Ceiling fan(s); Electric cooling components
- Interior features: Open floorplan with vaulted ceilings; Granite counters; Kitchen island; Pantry; Eat-in kitchen; Double vanity; Cable TV available; Prewired for security
- Laundry & utility: Full-size washer/dryer area; Washer hookup; Electric dryer hookup; Utility room; Tankless water heater
Neighborhood map
What this means for you Summary
Snapshot
- This is a 3-bed/2.5-bath single-family listed at $250k. Condition is rated poor.
Deal economics
- At list price, monthly cash flow is $-103 ($-1k/yr) — negative.
- To cash-flow at today's rent, offer at most $235k (6.0% below list).
- To meet the 1% rule (rent ≥ 1% of price), the offer needs to be $211k (15.4% below list).
- Recommended offer: $211k (15.4% below list) — sets the bar for 1% rule.
- Cap rate 5.8% vs local median 4.6% in Heartland — meaningfully above typical; check what's discounted (condition, days-on-market, listing class) to confirm the premium yield is real.
Location & tenants
- Location reads: area grade D — affects rentability + tenant quality, not the cash-flow math above.
- Crandall ISD (rural): math 36% / reading 42% proficiency, ranked #351 of 826 in TX (top 42%) — families likely to look elsewhere, expect single-tenant / working-renter base with shorter leases.
- Zoned schools: Barbara Walker El (math 35% / reading 36%, grade F, #1,946 of 4,322 statewide, top 45%, 663 students, 67% FRL); Crandall Middle (math 38% / reading 42%, grade F, #646 of 1,662 statewide, top 40%, 983 students, 60% FRL); Crandall H S (math 33% / reading 53%, grade F, #713 of 1,632 statewide, top 44%, 1,707 students, 56% FRL) — zoned schools average 61% FRL vs 41% district-wide (20 pts higher); higher-poverty schools than district average — tighter screening recommended.
- Market conditions: 802 active listings in the ZIP; 40 comparable units currently listed for rent nearby; rentals at typical pace (median 27d on market — plan ~3-4 weeks tenant-placement turnaround); solid renter incomes; 1,747 units permitted in Kaufman County in 2024 (180 in 5+ unit buildings).
Forward outlook
- Local home prices are declining (-3.0%/yr); year-one equity from $2k of loan paydown is wiped out by about $8k of value loss. Plan a longer hold.
- Kaufman County population projected at +43% by 2050 — long-run rental-demand tailwind backs the buy-and-hold thesis.
Negotiation context
- Only 3 days on market — expect competitive offers; lowballing is unlikely to land.
Questions for the listing agent
- What do current leases actually rent for vs. the listed asking? Can we see a recent rent roll and the last 12 months of T-12 income?
- Have any recent inspections been done? Can we get a copy of the seller's disclosures and any deferred-maintenance estimates?
- What does the HOA fee cover, when was the last increase, and are there any pending special assessments or reserve-fund shortfalls?
- Is there a deadline driving the sale (1031 exchange, divorce, estate, relocation)? That informs how much negotiation room exists.
- The area grade is low — what's the realistic commute time and amenity access for the typical tenant pool here? Any planned neighborhood developments (good or bad) we should know about?
- What's the average days-on-market for RENTAL listings here right now (not sales)? A rising rental-DOM trend means longer vacancies and softer asking-rent achievability than the comps imply.
- What's the recent tenant-quality profile in this submarket — average credit score on applications, eviction rate, late-payment / NSF rate, and stable-employment percentage? A property-management company in the area should have these aggregated.
- How much new for-sale + rental construction is in the pipeline within 1–3 miles? Heavy new supply typically softens prices + rents 12–24 months out; constrained supply supports both.
Investment metrics
- 1% rule
- 0.85% ✗
- Cap rate
- 5.80%
- Cash-on-cash
- -1.77%
- DSCR
- 0.92
- GRM
- 9.9
CMA / ARV
- ARV (median comp)
- $316,902
- List price
- $249,995
- Delta
- -11.65%
- Verdict
- UNDERPRICED
- Comps
- 20 within 1.0 mi
Show comp detail 12 sales within ~0.75 mi
| Address | Dist | Beds/Ba | Sqft | Sold | Price | $/sf | Match |
|---|---|---|---|---|---|---|---|
| 4209 Beale St | 0.34mi | 3/2.0 | 1,724 (+3%) | 1mo | $319,995 | $186 | 76 |
| 3517 Hank Dr | 0.05mi | 3/2.0 | 1,478 (-12%) | 1mo | $278,535 | $188 | 76 |
| 3933 Lakefield Dr | 0.40mi | 3/2.0 | 1,650 (-1%) | 2mo | $316,999 | $192 | 75 |
| 3960 Avendale Dr | 0.37mi | 3/2.0 | 1,736 (+4%) | 1mo | $345,000 | $199 | 74 |
| 3809 Lakefield Dr | 0.45mi | 3/2.0 | 1,650 (-1%) | 2mo | $312,995 | $190 | 74 |
| 4017 Lakefield Dr | 0.36mi | 4/2.0 (+1) | 1,696 (+2%) | 1mo | $299,500 | $177 | 73 |
| 3104 Providence Pl | 0.32mi | 3/2.5 | 1,776 (+6%) | 2mo | $209,000 | $118 | 72 |
| 4109 Harrison St | 0.33mi | 4/2.0 (+1) | 1,724 (+3%) | 2mo | $299,995 | $174 | 71 |
| 3141 Blossom Trl | 0.40mi | 3/2.0 | 1,569 (-6%) | 1mo | $229,000 | $146 | 68 |
| 3909 Belleview Pl | 0.54mi | 4/2.0 (+1) | 1,753 (+5%) | 1mo | $145,555 | $83 | 59 |
| 3818 Noblewood Dr | 0.57mi | 3/2.0 | 1,857 (+11%) | 0mo | $335,000 | $180 | 53 |
| 3912 Melica Ln | 0.44mi | 4/2.0 (+1) | 1,888 (+13%) | 0mo | $309,149 | $164 | 51 |
Match score weights: distance 35% · size 25% · config 20% · recency 20%. Top-matched comps best support the ARV.
Projected returns pro-forma
-3.0% appreciation · 3.0% rent growth · sell at horizon
- IRR
- -19.2%
- Equity multiple
- 0.33×
- Total profit
- $-47,008
- Equity at exit
- $37,275
- IRR
- -11.8%
- Equity multiple
- 0.30×
- Total profit
- $-49,134
- Equity at exit
- $21,615
Cash invested: $69,999 (down + closing). Projections, not guarantees.
Landlord ↔ Tenant lean methodology
- Overall (STATE)
- 87 Strongly Landlord-Friendly
- State Texas
- 87 Strongly Landlord-Friendly · R+5
- County
- — inherits STATE
- City
- — inherits STATE
ZIP-level market 75114
- Home prices YoY
- -26.7%
- Active inventory
- 802
- Price-to-rent
- 9.9×
Monthly cashflow live
- Estimated rent
- $2,115 high interval (Pro) →
- Mortgage (P&I)
- −$1,311
- Tax est. 1.5%
- −$312 /mo · $3,750/yr
- Insurance
- −$104
- HOA
- −$46
- Vacancy / Maint / Mgmt
- −$444
- Net cashflow
- $-103
Break-even live
Sensitivity live
| Price | -10% $70 | -5% $-17 | +0% $-103 | +5% $-189 | +10% $-276 |
|---|---|---|---|---|---|
| Rent | -10% $-270 | -5% $-187 | +0% $-103 | +5% $-19 | +10% $64 |
| Rate | -1.0pp $23 | -0.5pp $-39 | base $-103 | +0.5pp $-168 | +1.0pp $-234 |
UW: 25.0% down · 7.5% · 30yr · 1.5% tax · 5.0% vac · 8.0% maint · 8.0% mgmt
Financing live
Cash to close
- Down payment
- $62,499
- Closing costs
- $7,500
- Reserves months
- —
- Total cash needed
- —
Loan-product check · same deal, 3 products live
Conventional
25% down · 7.5% · 30yr
- Down + closing
- —
- Monthly P&I
- —
- Monthly cashflow
- —
- DSCR
- —
- Eligible?
- —
Personal DTI + credit; lowest rate.
DSCR
20% down · 8.5% · 30yr
- Down + closing
- —
- Monthly P&I
- —
- Monthly cashflow
- —
- DSCR
- —
- Eligible?
- —
No personal income docs; deal must DSCR.
Hard money
10% down · 12.0% · 12mo
- Down + closing
- —
- Monthly P&I
- —
- Monthly cashflow
- —
- DSCR
- —
- Eligible?
- —
Short-term bridge; refi at stabilization.
Rent comps 40 comps
| Address | Beds | Baths | Sqft | Rent | $/sqft | DOM | Units | Dist |
|---|---|---|---|---|---|---|---|---|
| 3028 Willow Wood Ct Crandall, TX | 3.0 | 2.5 | 1764 | $2,600 | $1.47 | 45d | 1 | 0.39mi |
| 3147 Blossom Trl Crandall, TX | 4.0 | 3.0 | 2177 | $2,700 | $1.24 | 45d | 1 | 0.44mi |
| 3004 Dakota Trl Crandall, TX | 4.0 | 2.0 | 1938 | $2,300 | $1.19 | 5d | 1 | 0.64mi |
| 2919 Cascade Ln Forney, TX | 3.0 | 2.0 | 1481 | $2,200 | $1.49 | 45d | 1 | 0.71mi |
| 2826 Hudson Dr Crandall, TX | 3.0 | 2.0 | 1639 | $2,400 | $1.46 | 8d | 1 | 0.71mi |
| 2624 Bartlett St Crandall, TX | 4.0 | 2.0 | 1707 | $1,825 | $1.07 | 26d | 1 | 0.87mi |
| 2745 Bronte Blvd Crandall, TX | 4.0 | 2.0 | 1667 | $1,845 | $1.11 | 26d | 1 | 0.88mi |
| 3941 Hometown Blvd Unit 3941 Crandall, TX | 3.0 | 2.5 | 1736 | $2,400 | $1.38 | 45d | 1 | 0.88mi |
| 2739 Bronte Blvd Crandall, TX | 4.0 | 2.0 | 1707 | $1,825 | $1.07 | 26d | 1 | 0.89mi |
| 2237 Mustang Ghost Trl Crandall, TX | 3.0 | 2.0 | 1952 | $2,040 | $1.05 | 45d | 1 | 0.90mi |
| 2746 Bronte Blvd Crandall, TX | 4.0 | 2.0 | 1707 | $1,825 | $1.07 | 26d | 1 | 0.90mi |
| 2521 Flight Trl Crandall, TX | 4.0 | 2.0 | 1707 | $1,825 | $1.07 | 26d | 1 | 0.93mi |
| 2513 Flight Trl Crandall, TX | 4.0 | 2.0 | 1707 | $1,825 | $1.07 | 26d | 1 | 0.95mi |
| 2409 Fleming Dr Crandall, TX | 4.0 | 2.0 | 1667 | $1,845 | $1.11 | 26d | 1 | 0.96mi |
| 2510 Flight Trl Crandall, TX | 4.0 | 2.0 | 1667 | $1,845 | $1.11 | 26d | 1 | 0.98mi |
| 1968 Marble Ln Forney, TX | 3.0 | 2.5 | 2051 | $2,350 | $1.15 | 17d | 1 | 1.06mi |
| 4121 Gaillardia Way Forney, TX | 4.0 | 2.0 | 2135 | $2,250 | $1.05 | 20d | 1 | 1.08mi |
| 4001 Fairmont Ln Forney, TX | 4.0 | 2.0 | 1545 | $2,000 | $1.29 | 45d | 1 | 1.14mi |
| 1799 Courage Crk Crandall, TX | 3.0 | 2.0 | 1260 | $1,800 | $1.43 | 45d | 1 | 1.21mi |
| 1793 Courage Crk Crandall, TX | 4.0 | 2.0 | 1667 | $1,769 | $1.06 | 0d | 1 | 1.23mi |
| 1789 Courage Crk Crandall, TX | 4.0 | 2.0 | 1667 | $1,739 | $1.04 | 4d | 1 | 1.24mi |
| 2306 Great Belt Blvd Crandall, TX | 3.0 | 2.0 | 1266 | $1,695 | $1.34 | 45d | 1 | 1.27mi |
| 4002 Bighorn Dr Forney, TX | 3.0 | 2.0 | 1365 | $2,120 | $1.55 | 3d | 1 | 1.27mi |
| 2302 Great Belt Blvd Crandall, TX | 3.0 | 2.0 | 1266 | $1,650 | $1.30 | 4d | 1 | 1.28mi |
| 2294 Great Belt Blvd Crandall, TX | 3.0 | 2.0 | 1266 | $1,815 | $1.43 | 26d | 1 | 1.30mi |
| 4032 Eagle Dr Forney, TX | 3.0 | 2.0 | 1456 | $1,775 | $1.22 | 6d | 1 | 1.39mi |
| 3352 Beckwith Way Crandall, TX | 3.0 | 2.0 | 1266 | $1,750 | $1.38 | 0d | 1 | 1.39mi |
| 3315 Beckwith Way Crandall, TX | 3.0 | 2.0 | 1440 | $1,685 | $1.17 | 45d | 1 | 1.40mi |
| 2511 Cornado Way Crandall, TX | 3.0 | 2.0 | 1239 | $1,799 | $1.45 | 26d | 1 | 1.41mi |
| 1507 Trick Riding Way Crandall, TX | 4.0 | 2.0 | 1850 | $1,900 | $1.03 | 0d | 1 | 1.42mi |
| 1507 Trick Riding Way Crandall, TX | 4.0 | 2.0 | 1850 | $1,900 | $1.03 | 26d | 1 | 1.42mi |
| 3101 Helix Bay Dr Crandall, TX | 3.0 | 2.0 | 1266 | $1,745 | $1.38 | 26d | 1 | 1.43mi |
| 2603 Khaju Grv Crandall, TX | 3.0 | 2.0 | 1266 | $1,699 | $1.34 | 4d | 1 | 1.43mi |
| 3103 Helix Bay Dr Crandall, TX | 3.0 | 2.0 | 1440 | $1,729 | $1.20 | 4d | 1 | 1.43mi |
| 2311 Alcantara Ave Crandall, TX | 3.0 | 2.0 | 1220 | $1,740 | $1.43 | 0d | 1 | 1.45mi |
| 2504 Cornado Way Crandall, TX | 3.0 | 2.0 | 1440 | $1,799 | $1.25 | 45d | 1 | 1.45mi |
| 3121 Helix Bay Dr Crandall, TX | 3.0 | 2.0 | 1440 | $1,675 | $1.16 | 45d | 1 | 1.45mi |
| 3104 Helix Bay Dr Crandall, TX | 3.0 | 2.0 | 1266 | $1,675 | $1.32 | 26d | 1 | 1.46mi |
| 4009 Freedom St Heartland, TX | 3.0 | 2.0 | 1419 | $1,800 | $1.27 | 46d | 1 | 1.48mi |
| 3007 Wallace Wells Ct Crandall, TX | 3.0 | 2.0 | 1440 | $1,950 | $1.35 | 45d | 1 | 1.48mi |
HOA detail
- Monthly dues
- $46 · $552/yr
Listing history 10 events
-
2026-06-09days on market $249,995 Active 3 DOM
-
2026-06-08days on market $249,995 Active 2 DOM
-
2026-06-07pricedays on market $249,995 Active 1 DOM
-
2026-06-04days on market $279,990 Active 84 DOM
-
2026-06-03days on market $279,990 Active 83 DOM
-
2026-06-02days on market $279,990 Active 82 DOM
-
2026-06-01days on market $279,990 Active 81 DOM
-
2026-05-31days on market $279,990 Active 80 DOM
-
2026-05-06price $279,990 809-char remark
-
2026-03-12$289,340 Active 809-char remark
ⓘ Source: listings_history table (triggers on properties + properties_extension) + one-shot
backfill from property_details.listing_events for pre-trigger history.
Nearby sold comps map
Loading sold comps map…
Walkable amenities ~0.75 mi
Loading nearby amenities…
Taxation est. · year 1
- Rental income
- $25,378
- − Mortgage interest
- −$14,004
- − Property taxes
- −$3,750
- − Insurance
- −$1,250
- − Repairs & maintenance
- −$2,030
- − Management
- −$2,030
- − HOA
- −$552
- − Depreciation
- −$7,273
- Taxable loss
- −$5,511
- Est. tax savings @ 24.0%
- +$1,323
- After-tax cash flow
- $87/yr
For passive investors: Depreciation is non-cash, so a rental often shows a tax loss while cash-flowing — sheltering income. Rental losses are passive: they offset passive income freely, and up to $25,000/yr can offset ordinary (W-2) income if you actively participate and your MAGI is under $100k (phasing out to $0 by $150k); unused losses carry forward. On sale, claimed depreciation is recaptured at up to 25%, and gains may owe capital-gains tax (a 1031 exchange can defer both). Figures are a year-1 estimate at your 24.0% rate — not tax advice; consult a CPA.
Condition & rehab AI · 2 photos
This two-story home requires extensive repairs and updates to its roof, exterior, interior, and HVAC systems. Significant investment is needed to bring the property up to a livable condition.
Repairs flagged
- Major roof — Aerial view suggests potential for significant roof replacement.
- Major exterior siding — Aerial view suggests potential for significant siding replacement.
- Major landscaping — No landscaping or curb appeal photos provided.
- Major interior walls/paint — No interior photos provided.
- Major HVAC/mechanical systems — No HVAC/mechanical photos provided.
Value-add opportunities
- Resale roof replacement — A new roof would significantly improve the home's curb appeal and value.
- Resale exterior siding replacement — New siding would improve the home's curb appeal and value.
- Both landscaping and curb appeal — A well-maintained landscape and curb appeal would attract buyers and renters.
- Both interior painting and updates — Fresh paint and updates would improve the home's interior and attract buyers and renters.
- Both HVAC/mechanical systems upgrade — Upgrading HVAC systems would improve comfort and energy efficiency, attracting buyers and renters.
Renovation cost estimate screening
| Repair item | Severity | Est. cost |
|---|---|---|
| roof · Aerial view suggests potential for significant roof replacement. | Major | $15,000–50,000 |
| exterior siding · Aerial view suggests potential for significant siding replacement. | Major | $15,000–50,000 |
| landscaping · No landscaping or curb appeal photos provided. | Major | $15,000–50,000 |
| interior walls/paint · No interior photos provided. | Major | $15,000–50,000 |
| HVAC/mechanical systems · No HVAC/mechanical photos provided. | Major | $15,000–50,000 |
| Total estimated repair cost · 5 items | $75,000–250,000 |
Value-add ROI direction
- Resale roof replacement — A new roof would significantly improve the home's curb appeal and value. ↑
- Resale exterior siding replacement — New siding would improve the home's curb appeal and value. ↑
- Both landscaping and curb appeal — A well-maintained landscape and curb appeal would attract buyers and renters. ↑
- Both interior painting and updates — Fresh paint and updates would improve the home's interior and attract buyers and renters. ↑
- Both HVAC/mechanical systems upgrade — Upgrading HVAC systems would improve comfort and energy efficiency, attracting buyers and renters. ↑
ⓘ Cost ranges are severity-bucket heuristics (US national rule-of-thumb). Get contractor quotes + a written scope before underwriting a rehab budget.
Schools (NCES district)
- District
- Crandall ISD
- NCES district ID
- 4815510
- Math proficiency
- 36% ▼ -13.00%
- Reading proficiency
- 42% ▼ -8.00%
- Median HH income
- $70,076
- Composite
- 35.57/100
- National rank
- #4901
- State rank
- #351 of 826 in TX
Livability — Heartland
No livability data for this city. (Only ~50 U.S. cities are tracked.)
Census & demographics
- Census place
- Heartland, TX
- County
- Kaufman County · 122,338 people
- Metro
- Dallas-Fort Worth-Arlington, TX
- Population (ZIP)
- 9,333
- Household income
- $88,013
- Rent vs Own
- Severe rent burden
- 33.0
Population outlook (Kaufman County) Hauer SSP2
- Today (2025)
- 138,716 people
- By 2030
- 150,815 · +8.7%
- By 2040
- 174,877 · +26.1%
- By 2050
- 198,020 · +42.8%
- By 2075
- 251,908 · +81.6%
- By 2100
- 285,325 · +105.7%
Race, ethnicity, and origin ACS 2023
- Neighborhood character
- Diverse neighborhood (Simpson 0.62)
- Race & ethnicity
- White 48% Hispanic / Latino 36% Two or more races 14% Black 14%
- Hispanic origin (detail)
- Mexican 34%
- Common ancestry
- Slovak 1%
- Foreign-born
- 18% · Canada, China
- Languages at home
- 71% English-only · Spanish 27% Other Indo-European 1%
Political lean MEDSL · Kaufman
- 2024 margin
- Strong R (+27.9) · D 35.6% · R 63.5%
- 2008→2024 swing
- +7.9pp toward D · 2008: -35.8pp · 2024: -27.9pp
- All cycles
- 2024: R+27.9 2020: R+33.9 2016: R+47.0 2012: R+44.4 2008: R+35.8
Not yet ingested
- Civics
- —
Market trends
- HPI YoY
- ▼ -71.61%
- Current HPI
- 196.4773
- Rent YoY
- —
- Metro
- Dallas-Fort Worth-Arlington, TX
- State GDP YoY
- ▲ 3.95%
- F500 in state
- 110
Industry mix (Fortune 500 HQ in TX)
| Industry | F500 HQs | Revenue |
|---|---|---|
| Energy | 16 | $1,198B |
|
||
| Technology | 5 | $198B |
|
||
| Engineering / Construction | 4 | $72B |
|
||
| Energy Services | 3 | $60B |
|
||
| Utilities | 3 | $41B |
|
||
| Healthcare | 2 | $330B |
|
||
Price history
1 event — show timeline
- 2026-06-06 Listed $249,995 NTREIS
Cash-flow waterfall
monthlySold comps — $/sqft
last 12 mo · ≤1 miLoading sold comps…