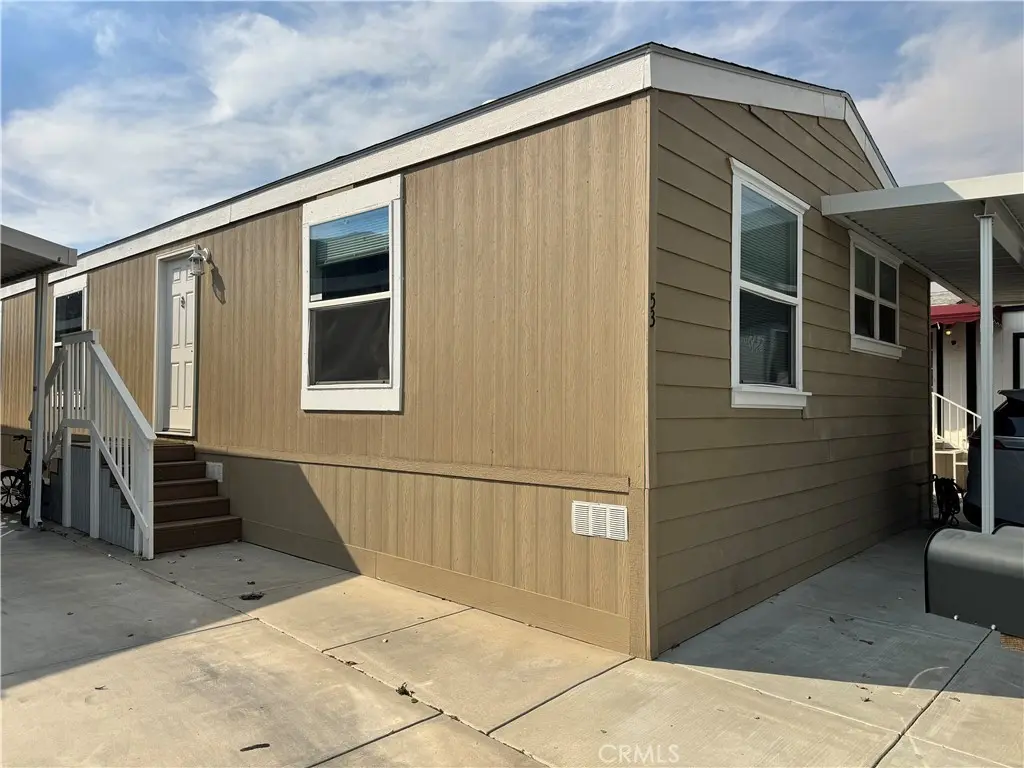
32900 Riverside #53 · Lake Elsinore, CA
Flood risk 1/10 · Minimal
- FEMA flood zone
- X (shaded)
- Chance of flooding over 30 yrs
- 0.0%
- Est. flood insurance / yr
- $507 – $1,088
Fire risk 8/10 · Major
- Est. fire insurance / yr
- $659 – $1,223
Heat risk 5/10 · Moderate
- Hot days now (above 105°F)
- 7 days/yr
- Hot days in 30 yrs
- 20 days/yr
Wind risk 1/10 · Minimal
- Chance of severe wind over 30 yrs
- —
Air-quality risk 6/10 · Moderate
- Unhealthy air days now
- 9 days/yr
- Unhealthy air days in 30 yrs
- 11 days/yr
Risk factors via First Street. Map © Google.
Why this score? — see what drove the C grade
The composite is a weighted blend of 9 inputs, each scored 0–100. Each bar is that input's sub-score; the figure is the points it added to the 100-point composite (weight × sub-score).
- Cash flow +28.9/30.0
- DSCR +10.0/10.0
- 1% rule +7.0/10.0
- Condition / age +4.0/5.0
- Schools +3.7/10.0
- Livability +3.1/5.0
- Rent growth +2.3/5.0
- ARV discount +0.0/15.0
- Appreciation +0.0/10.0
$216,500
🖨 Deal sheet 📄 Offer letter ✓ Due diligence
Listing remarks MLS
Charming 3-bed, 2-bath home in desirable Butterfield Village with lake access around the corner, and resort-style amenities. Light-filled open floor plan, oversized primary suite with soaking tub and walk-in shower, indoor laundry, private yard, and covered carport. Convenient location near schools, shopping, and walking trails.
Key facts
- Community pool
- Built 2019
- Listed 72 days
Neighborhood map
What this means for you Summary
Snapshot
- This is a 3-bed/2.0-bath manufactured listed at $216k. Condition is rated good.
Deal economics
- At list price, monthly cash flow is $735 ($9k/yr) — positive.
- The deal already cash-flows at list — no discount required.
- Meets the 1% rule at list price ($3k rent vs $216k).
- Recommended offer: $204k (6.0% below list) — sets the bar for market timing.
- Cap rate 10.4% vs local median 3.3% in Lake Elsinore — top-decile yield for the area; either an underpriced asset or a hidden risk that comps aren't pricing in. Stress-test before assuming the spread holds.
Location & tenants
- Location reads 62/100 on livability (#510 in CA) — a middle-class / working-renter tenant base. Strengths: housing A+, crime B, employment B; Watch: schools D, amenities D, commute F.
- Lake Elsinore Unified (suburban): math 34% / reading 49% proficiency, ranked #210 of 517 in CA (top 41%) — families likely to look elsewhere, expect single-tenant / working-renter base with shorter leases.
- Market conditions: Rents soft (-0.8%/yr); 453 active listings in the ZIP; 16 comparable units currently listed for rent nearby; rentals at typical pace (median 17d on market — plan ~3-4 weeks tenant-placement turnaround); solid renter incomes; 9,195 units permitted in Riverside County in 2024 (1,512 in 5+ unit buildings).
- This rent runs 36% of the median local income ($87k/yr) — at the standard rent-burdened threshold; future hikes will face affordability resistance.
Forward outlook
- Local home prices are declining (-3.0%/yr); year-one equity from $1k of loan paydown is wiped out by about $6k of value loss. Plan a longer hold.
- Riverside County population projected at +22% by 2050 — long-run rental-demand tailwind backs the buy-and-hold thesis.
Negotiation context
- It's been on market 72 days — a 6% lower offer ($204k) is reasonable based on typical stale-listing flexibility.
- 2 sale attempts with the ask held roughly flat each time — persistent listings suggest the price (not the market) is what's stuck; bring a comps-based counter.
Risks & watch-outs
- Climate carrying-cost: severe wildfire risk; extreme-heat days projected 7→20/yr by 2055 (HVAC capex compounding) — expect insurance premiums to compound above CPI over the hold.
Questions for the listing agent
- It's been on market 72 days. Have you received any prior offers? Is the seller open to a 6% concession, seller financing, or rate buy-down credit?
- Why hasn't it sold? Are there any deal-killer items the seller is aware of (foundation, flood, title, zoning, code violations)?
- Is there a deadline driving the sale (1031 exchange, divorce, estate, relocation)? That informs how much negotiation room exists.
- Schools are D-rated, which usually means shorter tenancies and higher turnover. Who's the typical renter profile here, and what's been the actual vacancy rate?
- What's the average days-on-market for RENTAL listings here right now (not sales)? A rising rental-DOM trend means longer vacancies and softer asking-rent achievability than the comps imply.
- What's the recent tenant-quality profile in this submarket — average credit score on applications, eviction rate, late-payment / NSF rate, and stable-employment percentage? A property-management company in the area should have these aggregated.
- How much new for-sale + rental construction is in the pipeline within 1–3 miles? Heavy new supply typically softens prices + rents 12–24 months out; constrained supply supports both.
Investment metrics
- 1% rule
- 1.20% ✓
- Cap rate
- 10.36%
- Cash-on-cash
- 14.54%
- DSCR
- 1.65
- GRM
- 7.0
CMA / ARV
- ARV (median comp)
- $156,189
- List price
- $216,500
- Delta
- 38.61%
- Verdict
- OVERPRICED
- Comps
- 20 within 1.0 mi
Show comp detail 4 sales within ~0.75 mi
| Address | Dist | Beds/Ba | Sqft | Sold | Price | $/sf | Match |
|---|---|---|---|---|---|---|---|
| 32900 Riverside #51 | 0.01mi | 3/2.0 | 1,334 (-1%) | 4mo | $239,900 | $180 | 94 |
| 32900 Riverside Dr #118 | 0.00mi | 3/2.0 | 1,360 (+1%) | 12mo | $227,000 | $167 | 89 |
| 32900 Riverside Dr. #55 | 0.05mi | 3/2.0 | 1,320 (-2%) | 9mo | $219,000 | $166 | 86 |
| 32900 Riverside Dr #72 | 0.09mi | 3/2.0 | 1,392 (+3%) | 13mo | $193,000 | $139 | 80 |
Match score weights: distance 35% · size 25% · config 20% · recency 20%. Top-matched comps best support the ARV.
Projected returns pro-forma
-3.0% appreciation · 0.0% rent growth · sell at horizon
- IRR
- 1.8%
- Equity multiple
- 1.07×
- Total profit
- $4,031
- Equity at exit
- $32,281
- IRR
- 8.4%
- Equity multiple
- 1.56×
- Total profit
- $34,091
- Equity at exit
- $18,719
Cash invested: $60,620 (down + closing). Projections, not guarantees.
Landlord ↔ Tenant lean methodology
- Overall (STATE)
- 18 Strongly Tenant-Friendly
- State California
- 18 Strongly Tenant-Friendly · D+13
- County
- — inherits STATE
- City
- — inherits STATE
ZIP-level market 92530
- Home prices YoY
- -34.3%
- Rents YoY
- -0.8%
- Active inventory
- 453
- Price-to-rent
- 7.0×
Monthly cashflow live
- Estimated rent
- $2,593 high interval (Pro) →
- Mortgage (P&I)
- −$1,135
- Tax from tax record
- −$88 /mo · $1,058/yr
- Insurance
- −$90
- HOA
- −$0
- Vacancy / Maint / Mgmt
- −$544
- Net cashflow
- $735
Break-even live
UW: 25.0% down · 7.5% · 30yr · 1.5% tax · 5.0% vac · 8.0% maint · 8.0% mgmt
Financing live
Cash to close
- Down payment
- $54,125
- Closing costs
- $6,495
- Reserves months
- —
- Total cash needed
- —
Loan-product check · same deal, 3 products live
Conventional
25% down · 7.5% · 30yr
- Down + closing
- —
- Monthly P&I
- —
- Monthly cashflow
- —
- DSCR
- —
- Eligible?
- —
Personal DTI + credit; lowest rate.
DSCR
20% down · 8.5% · 30yr
- Down + closing
- —
- Monthly P&I
- —
- Monthly cashflow
- —
- DSCR
- —
- Eligible?
- —
No personal income docs; deal must DSCR.
Hard money
10% down · 12.0% · 12mo
- Down + closing
- —
- Monthly P&I
- —
- Monthly cashflow
- —
- DSCR
- —
- Eligible?
- —
Short-term bridge; refi at stabilization.
Rent comps 16 comps
| Address | Beds | Baths | Sqft | Rent | $/sqft | DOM | Units | Dist |
|---|---|---|---|---|---|---|---|---|
| 15190 Grand Ave Lake Elsinore, CA | 1.0–3.0 | 1.0–2.0 | 840 | $2,135 | $2.54 | 1d | 6 | 0.26mi |
| 15120 Grand Ave Lake Elsinore, CA | 1.0–3.0 | 1.0–2.0 | 870 | $2,775 | $3.19 | 1d | 7 | 0.30mi |
| 33111 Jamieson St Lake Elsinore, CA | 2.0 | 1.0 | 1000 | $1,425 | $1.43 | 16d | 1 | 0.35mi |
| 1121 Monroe St Unit NA Lake Elsinore, CA | 3.0 | 2.0 | 1100 | $2,575 | $2.34 | 14d | 1 | 0.55mi |
| 583 Le Harve Ave Lake Elsinore, CA | 3.0 | 2.0 | 1174 | $2,750 | $2.34 | 43d | 1 | 0.56mi |
| 15680 Shadow Mountain Ln Lake Elsinore, CA | 3.0 | 2.0 | 1220 | $2,495 | $2.05 | 43d | 1 | 0.58mi |
| 15195 Lincoln St Lake Elsinore, CA | 1.0–3.0 | 1.0–2.0 | 832 | $2,495 | $3.00 | 1d | 1 | 0.80mi |
| 892 Robin Dr Lake Elsinore, CA | 2.0 | 2.0 | 1315 | $2,450 | $1.86 | 1d | 1 | 0.87mi |
| 16523 Joy St Lake Elsinore, CA | 3.0 | 2.0 | 1200 | $2,400 | $2.00 | 24d | 1 | 1.14mi |
| 15047 Amorose St Lake Elsinore, CA | 4.0 | 2.0 | 1871 | $2,990 | $1.60 | 24d | 1 | 1.15mi |
| 16465 Joy St Unit 20 Lake Elsinore, CA | 2.0 | 2.0 | 950 | $1,850 | $1.95 | 18d | 1 | 1.17mi |
| 30042 Sugarpine St Lake Elsinore, CA | 3.0 | 2.0 | 1566 | $3,790 | $2.42 | 2d | 1 | 1.21mi |
| 15120 Ironwood St Lake Elsinore, CA | 3.0 | 2.0 | 1391 | $3,450 | $2.48 | 1d | 1 | 1.24mi |
| 597 Woodcrest Dr Lake Elsinore, CA | 3.0–4.0 | 2.5 | 1600 | $2,545 | $1.59 | 1d | 1 | 1.38mi |
| 16524 Badalona St Lake Elsinore, CA | 3.0 | 2.0 | 1540 | $2,875 | $1.87 | 18d | 1 | 1.40mi |
| 685 Woodcrest Dr Unit A Lake Elsinore, CA | 2.0 | 2.5 | 1000 | $2,200 | $2.20 | 43d | 1 | 1.44mi |
Listing history 17 events
-
2026-06-18days on market $216,500 Active 72 DOM
-
2026-06-17days on market $216,500 Active 71 DOM
-
2026-06-16days on market $216,500 Active 70 DOM
-
2026-06-15days on market $216,500 Active 69 DOM
-
2026-06-13days on market $216,500 Active 67 DOM
-
2026-06-13pricedays on market $216,500 Active 66 DOM
-
2026-06-09days on market $221,500 Active 63 DOM
-
2026-06-08days on market $221,500 Active 62 DOM
-
2026-06-07days on market $221,500 Active 61 DOM
-
2026-06-04days on market $221,500 Active 58 DOM
-
2026-06-03days on market $221,500 Active 57 DOM
-
2026-06-02days on market $221,500 Active 56 DOM
-
2026-06-01days on market $221,500 Active 55 DOM
-
2026-05-31days on market $221,500 Active 54 DOM
-
2026-04-07$221,500 Active 330-char remark
Show marketing remark (330 chars)
Charming 3-bed, 2-bath home in desirable Butterfield Village with lake access around the corner, and resort-style amenities. Light-filled open floor plan, oversized primary suite with soaking tub and walk-in shower, indoor laundry, private yard, and covered carport. Convenient location near schools, shopping, and walking trails.
-
2026-03-31historical
-
2025-10-23$225,000 Active
ⓘ Source: listings_history table (triggers on properties + properties_extension) + one-shot
backfill from property_details.listing_events for pre-trigger history.
Tax reassessment forecast CA · Resets to sale price
- Current annual tax
- $1,058 · $88/mo
- Projected year-2 tax
- $1,645 · $137/mo
- Expected delta
- +$587/yr (+$49/mo · 55.5%)
ⓘ Screening estimate from a state-policy table — verify with the county assessor before closing.
Climate risk First Street
- Flood 1/10 Low FEMA zone X (shaded) · 0% chance over 30 yrs
- Wildfire 8/10 Severe
- Heat 5/10 Major 7 d/yr ≥105°F today · 20 d/yr by 30 yrs out
- Wind 1/10 Low
- Air quality 6/10 Major 9 unhealthy d/yr today · 11 by 30 yrs out
Nearby sold comps map
Loading sold comps map…
Walkable amenities ~0.75 mi
Loading nearby amenities…
Taxation est. · year 1
- Rental income
- $31,113
- − Mortgage interest
- −$12,127
- − Property taxes
- −$1,058
- − Insurance
- −$1,082
- − Repairs & maintenance
- −$2,489
- − Management
- −$2,489
- − Depreciation
- −$6,298
- Taxable income
- $5,569
- Est. tax owed @ 24.0%
- −$1,337
- After-tax cash flow
- $7,478/yr
For passive investors: Depreciation is non-cash, so a rental often shows a tax loss while cash-flowing — sheltering income. Rental losses are passive: they offset passive income freely, and up to $25,000/yr can offset ordinary (W-2) income if you actively participate and your MAGI is under $100k (phasing out to $0 by $150k); unused losses carry forward. On sale, claimed depreciation is recaptured at up to 25%, and gains may owe capital-gains tax (a 1031 exchange can defer both). Figures are a year-1 estimate at your 24.0% rate — not tax advice; consult a CPA.
Condition & rehab AI · 12 photos
This charming 3-bedroom, 2-bath home in Butterfield Village is move-in ready with a good condition score and minimal repairs needed.
Value-add opportunities
- Both paint exterior — enhances curb appeal and resale value
- Both landscaping — improves curb appeal and rental value
- Both HVAC maintenance — improves comfort and energy efficiency
Renovation cost estimate screening
Value-add ROI direction
- Both paint exterior — enhances curb appeal and resale value ↑
- Both landscaping — improves curb appeal and rental value ↑
- Both HVAC maintenance — improves comfort and energy efficiency ↑
ⓘ Cost ranges are severity-bucket heuristics (US national rule-of-thumb). Get contractor quotes + a written scope before underwriting a rehab budget.
Schools (NCES district)
- District
- Lake Elsinore Unified
- NCES district ID
- 0600027
- Math proficiency
- 34% ▲ 5.00%
- Reading proficiency
- 49% ▲ 8.00%
- Median HH income
- $63,829
- Composite
- 37.01/100
- National rank
- #4518
- State rank
- #210 of 517 in CA
Livability — Lake Elsinore
- Score
- 62/100
- State rank
- #510
- US rank
- #17250
Category grades
Schools grade is shown separately in the Schools card above.
Census & demographics
- Census place
- Lake Elsinore, CA
- County
- Riverside County · 2,287,001 people
- City population
- 89,823
- Metro
- Riverside-San Bernardino-Ontario, CA
- Population (ZIP)
- 61,768
- Household income
- $86,862
- Rent vs Own
- Severe rent burden
- 1690.0
Population outlook (Riverside County) Hauer SSP2
- Today (2025)
- 2,664,475 people
- By 2030
- 2,802,692 · +5.2%
- By 2040
- 3,050,904 · +14.5%
- By 2050
- 3,256,783 · +22.2%
- By 2075
- 3,655,058 · +37.2%
- By 2100
- 3,766,594 · +41.4%
Race, ethnicity, and origin ACS 2023
- Neighborhood character
- Diverse neighborhood (Simpson 0.55)
- Race & ethnicity
- Hispanic / Latino 61% White 28% Two or more races 21% Black 4% Asian 4% Native American 2%
- Hispanic origin (detail)
- Mexican 50% Puerto Rican 1%
- Common ancestry
- Iranian 1% Lithuanian 1% Slovak 1%
- Foreign-born
- 22% · Canada, China, Jamaica
- Languages at home
- 55% English-only · Spanish 41% Tagalog/Filipino 1% Chinese 1%
Political lean MEDSL · Riverside
- 2024 margin
- Toss-up / Even · D 48.0% · R 49.3% · Other 2.6%
- 2008→2024 swing
- -3.6pp toward R · 2008: 2.3pp · 2024: -1.3pp
- All cycles
- 2024: R+1.3 2020: D+8.0 2016: D+4.3 2012: R+0.4 2008: D+2.3
Not yet ingested
- Civics
- —
Market trends
- HPI YoY
- ▼ -205.66%
- Current HPI
- 394.1705
- Rent YoY
- ▼ -0.76%
- Metro
- Riverside-San Bernardino-Ontario, CA
- State GDP YoY
- ▲ 3.21%
- F500 in state
- 116
Industry mix (Fortune 500 HQ in CA)
| Industry | F500 HQs | Revenue |
|---|---|---|
| Technology | 27 | $1,492B |
|
||
| Financial Services | 3 | $174B |
|
||
| Retail | 3 | $44B |
|
||
| Insurance | 3 | $26B |
|
||
| Media / Entertainment | 2 | $115B |
|
||
| Pharmaceuticals / Biotech | 2 | $62B |
|
||
Price history
-1.6% since first listed3 events — show timeline
- 2026-04-07 Listed $221,500 CRMLS
- 2026-03-31 Listing Removed — CRMLS
- 2025-10-23 Listed $225,000 CRMLS
Property tax history
+2.1%/yrLatest (2025): $1,058 · +4.8% YoY. Source: county tax records.
Cash-flow waterfall
monthlySold comps — $/sqft
last 12 mo · ≤1 miLoading sold comps…