 Triplex
🌊 Lakefront
Triplex
🌊 Lakefront
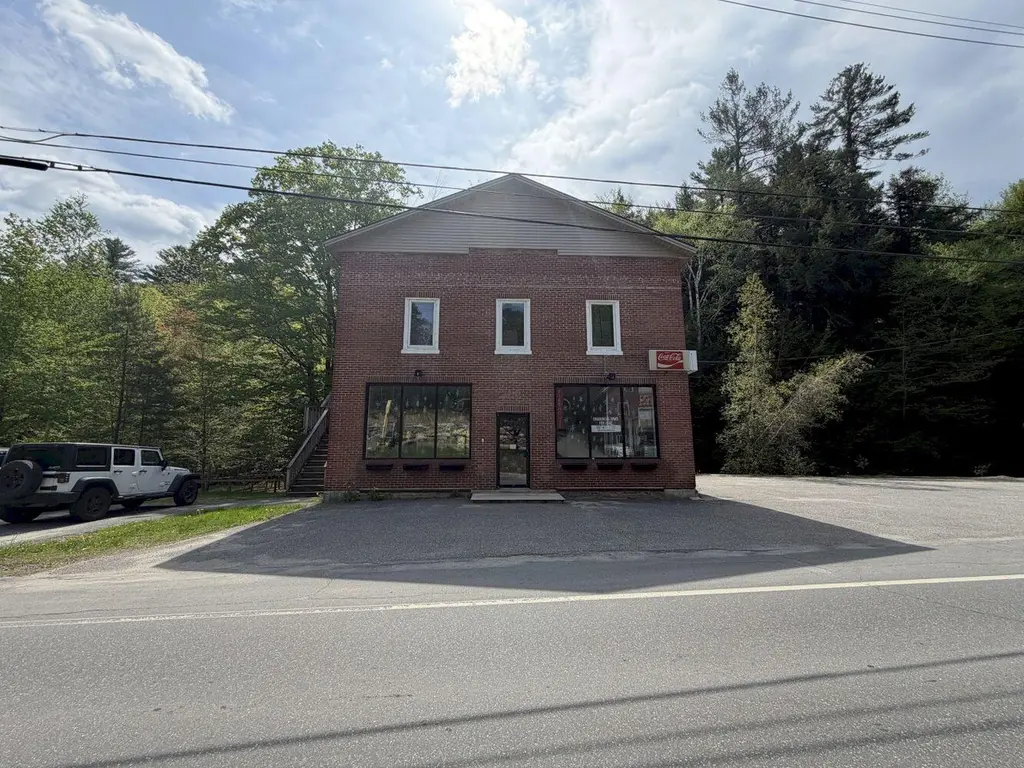
525 Main St · Wilton, ME
Flood risk No data
- FEMA flood zone
- —
- Chance of flooding over 30 yrs
- —
- Est. flood insurance / yr
- —
Fire risk No data
- Est. fire insurance / yr
- —
Heat risk No data
- Hot days now (above threshold)
- —
- Hot days in 30 yrs
- —
Wind risk No data
- Chance of severe wind over 30 yrs
- —
Air-quality risk No data
- Unhealthy air days now
- —
- Unhealthy air days in 30 yrs
- —
Risk factors via First Street. Map © Google.
Why this score? — see what drove the C+ grade
The composite is a weighted blend of 9 inputs, each scored 0–100. Each bar is that input's sub-score; the figure is the points it added to the 100-point composite (weight × sub-score).
- Cash flow +24.3/30.0
- DSCR +7.9/10.0
- ARV discount +7.5/15.0
- Schools +6.7/10.0
- 1% rule +6.3/10.0
- Livability +3.2/5.0
- Rent growth +2.5/5.0
- Condition / age +2.5/5.0
- Appreciation +0.0/10.0
$350,500
🖨 Deal sheet 📄 Offer letter ✓ Due diligence
Multi-family units
County records classify this as Multi-Family (2-4 Unit). Listing-text estimate: 3 units. confirmed
Listing remarks
Three unit rental with solid bones already generating incoming. Great potential with open space on first floor with plenty of parking. Start a business and use the residential rental money upstairs. Located in the heart of Wilton next door to all dining and shopping. This commercial space gets excellent visibility and features Wilson stream frontage out back. Lots of parking for the business and plenty for the apartments. Solid occupancy in the apartments leased. Schedule your showing today!
Key facts
- Excellent visibility
- Plenty of parking
- 0.62 acre lot
Tags
Property features AI
Finance
- Financial info: Gross income reported: $30,000; Operating expenses reported: $30,000; Unit 1 actual rent: $1,000; Unit 2 actual rent: $1,500; Property configured as a 2‑unit building
- HOA & community: Pets allowed with no restrictions
Exterior
- Parking: Gravel and paved on‑site parking; Off‑street parking; 11–20 parking spaces
- Utilities: Public water; Public sewer; Electric service with circuit breakers; Electric tankless water heater(s)
- Home design: Masonry/brick construction; 2 stories; Built in 1909; Zoned RP
- Construction: Brick and masonry exterior; Shingle roof; Originally built in 1909
- Exterior features: Near golf course; Near public beach; Near shopping; Near town; Level lot; Sidewalks; Paved road access; Waterfront on Wilson Stream with water view
Interior
- Kitchen: No refrigerators provided in either unit
- Bedrooms: Two 2‑bedroom units (both located on the second level)
- Flooring: Carpet; Concrete; Vinyl
- Bathrooms: 2 full bathrooms (total)
- Heating & cooling: Baseboard heating; Forced air heating; Central air conditioning
- Interior features: Level entry; Bath modifications for accessibility; Carpet flooring; Concrete flooring; Vinyl flooring
- Laundry & utility: No dedicated water heaters for units; Dedicated electric meters for each unit
Neighborhood map
What this means for you Summary
Snapshot
- This is a 3 × 4-bed/2.0-bath units multifamily listed at $350k.
Deal economics
- At list price, monthly cash flow is $708 ($8k/yr) — positive. Per door: $236/mo.
- The deal already cash-flows at list — no discount required.
- Meets the 1% rule at list price ($4k rent vs $350k).
- Recommended offer: $345k (1.5% below list) — sets the bar for market timing.
Location & tenants
- Location reads 64/100 on livability (#112 in ME) — a middle-class / working-renter tenant base. Strengths: crime A+, cost of living A+, housing A+; Watch: health & safety C-, schools F, amenities F.
- RSU 09 (rural): math 78% / reading 82% proficiency, ranked #88 of 112 in ME (top 79%) — strong family-tenant draw, lease renewals of 3-5y typical.
- Market conditions: 37 active listings in the ZIP; 164 units permitted in Franklin County in 2024 (0 in 5+ unit buildings).
Forward outlook
- Local home prices are declining (-3.0%/yr); year-one equity from $2k of loan paydown is wiped out by about $11k of value loss. Plan a longer hold.
- Franklin County population projected at -21% by 2050 — secular population decline; favor cash flow + early exit over multi-decade hold.
Negotiation context
- It's been on market 20 days — a 2% lower offer ($345k) is reasonable based on typical stale-listing flexibility.
- 6 sale attempts since 14y ago with the ask held roughly flat each time — persistent listings suggest the price (not the market) is what's stuck; bring a comps-based counter.
Risks & watch-outs
- Watch-outs: built in 1909 — expect roof / HVAC / electrical / plumbing capex.
Questions for the listing agent
- Can we see the unit-by-unit rent roll, current vacancy, and any below-market leases? What's the average tenancy length?
- What capital expenditures (roof, boiler, parking lot, exteriors) have been made in the last 5 years, and what's planned in the next 2?
- Built in 1909 — when were the roof, HVAC, electrical panel, plumbing, and water heater last replaced?
- Is there a deadline driving the sale (1031 exchange, divorce, estate, relocation)? That informs how much negotiation room exists.
- Schools are F-rated, which usually means shorter tenancies and higher turnover. Who's the typical renter profile here, and what's been the actual vacancy rate?
- This sits on a lake — are riparian / water-frontage rights deeded with the parcel? Any dock permits, shoreline easements, or HOA water-use restrictions?
- What's the documented flood / surge / shoreline-erosion history here (FEMA AND non-FEMA — e.g., storm surge, creek backup, septic-field saturation)?
- Any water-quality or seasonal algae-bloom issues that affect tenant satisfaction or short-term-rental demand?
- What's the average days-on-market for RENTAL listings here right now (not sales)? A rising rental-DOM trend means longer vacancies and softer asking-rent achievability than the comps imply.
- What's the recent tenant-quality profile in this submarket — average credit score on applications, eviction rate, late-payment / NSF rate, and stable-employment percentage? A property-management company in the area should have these aggregated.
- How much new apartment / multifamily construction is in the pipeline within 1–3 miles? Heavy new supply (>2% of stock underway) typically softens rents 12–24 months out; light construction supports rent growth.
Investment metrics
- 1% rule
- 1.13% ✓
- Cap rate
- 8.72%
- Cash-on-cash
- 8.65%
- DSCR
- 1.39
- GRM
- 7.4
CMA / ARV
No comps found within radius.
Projected returns pro-forma
-3.0% appreciation · 3.0% rent growth · sell at horizon
- IRR
- -3.2%
- Equity multiple
- 0.88×
- Total profit
- $-11,659
- Equity at exit
- $52,261
- IRR
- 6.5%
- Equity multiple
- 1.49×
- Total profit
- $48,134
- Equity at exit
- $30,305
Cash invested: $98,140 (down + closing). Projections, not guarantees.
Landlord ↔ Tenant lean methodology
- Overall (STATE)
- 41 Moderately Tenant-Leaning
- State Maine
- 41 Moderately Tenant-Leaning · D+2
- County
- — inherits STATE
- City
- — inherits STATE
ZIP-level market 04294
- Home prices YoY
- -14.5%
- Active inventory
- 37
- Price-to-rent
- 22.1×
Monthly cashflow live
- Estimated rent
- $3,962 medium interval (Pro) →
- Mortgage (P&I)
- −$1,838
- Tax est. 1.5%
- −$438 /mo · $5,258/yr
- Insurance
- −$146
- HOA
- −$0
- Vacancy / Maint / Mgmt
- −$832
- Net cashflow
- $708
Break-even live
3-unit breakdown (identical units grouped — click to expand)
| Units | Beds | Baths | Est. rent |
|---|---|---|---|
| 3× units | 4 | 2 | $3,963 |
| #1 | 4 | 2 | $1,321 |
| #2 | 4 | 2 | $1,321 |
| #3 | 4 | 2 | $1,321 |
| Total (3 units) | $3,962 | ||
UW: 25.0% down · 7.5% · 30yr · 1.5% tax · 5.0% vac · 8.0% maint · 8.0% mgmt
Financing live
Cash to close
- Down payment
- $87,625
- Closing costs
- $10,515
- Reserves months
- —
- Total cash needed
- —
Loan-product check · same deal, 3 products live
Conventional
25% down · 7.5% · 30yr
- Down + closing
- —
- Monthly P&I
- —
- Monthly cashflow
- —
- DSCR
- —
- Eligible?
- —
Personal DTI + credit; lowest rate.
DSCR
20% down · 8.5% · 30yr
- Down + closing
- —
- Monthly P&I
- —
- Monthly cashflow
- —
- DSCR
- —
- Eligible?
- —
No personal income docs; deal must DSCR.
Hard money
10% down · 12.0% · 12mo
- Down + closing
- —
- Monthly P&I
- —
- Monthly cashflow
- —
- DSCR
- —
- Eligible?
- —
Short-term bridge; refi at stabilization.
Listing history 23 events
-
2026-06-18days on market $350,500 Active 20 DOM
-
2026-06-17days on market $350,500 Active 19 DOM
-
2026-06-16days on market $350,500 Active 18 DOM
-
2026-06-15days on market $350,500 Active 17 DOM
-
2026-06-13days on market $350,500 Active 15 DOM
-
2026-06-12days on market $350,500 Active 14 DOM
-
2026-06-09days on market $350,500 Active 11 DOM
-
2026-06-08days on market $350,500 Active 10 DOM
-
2026-06-07days on market $350,500 Active 9 DOM
-
2026-06-07days on market $350,500 Active 8 DOM
-
2026-06-04days on market $350,500 Active 5 DOM
-
2026-06-02days on market $350,500 Active 4 DOM
-
2026-06-01days on market $350,500 Active 3 DOM
-
2026-05-31days on market $350,500 Active 2 DOM
-
2026-05-29$350,500 Active
-
2017-03-29historical
-
2016-09-28$75,000 Active
-
2016-06-30historical
-
2016-01-04$85,000 Active
-
2015-08-20historical
-
2015-03-05$85,000 Active
-
2013-08-19$85,000
-
2012-06-08$95,000
ⓘ Source: listings_history table (triggers on properties + properties_extension) + one-shot
backfill from property_details.listing_events for pre-trigger history.
Nearby sold comps map
Loading sold comps map…
Walkable amenities ~0.75 mi
Loading nearby amenities…
Taxation est. · year 1
- Rental income
- $47,544
- − Mortgage interest
- −$19,633
- − Property taxes
- −$5,258
- − Insurance
- −$1,752
- − Repairs & maintenance
- −$3,804
- − Management
- −$3,804
- − Depreciation
- −$10,196
- Taxable income
- $3,097
- Est. tax owed @ 24.0%
- −$743
- After-tax cash flow
- $7,750/yr
For passive investors: Depreciation is non-cash, so a rental often shows a tax loss while cash-flowing — sheltering income. Rental losses are passive: they offset passive income freely, and up to $25,000/yr can offset ordinary (W-2) income if you actively participate and your MAGI is under $100k (phasing out to $0 by $150k); unused losses carry forward. On sale, claimed depreciation is recaptured at up to 25%, and gains may owe capital-gains tax (a 1031 exchange can defer both). Figures are a year-1 estimate at your 24.0% rate — not tax advice; consult a CPA.
Schools (NCES district)
- District
- RSU 09
- NCES district ID
- 2314809
- Math proficiency
- 78% ▲ 48.00%
- Reading proficiency
- 82% ▲ 31.00%
- Median HH income
- $40,202
- Composite
- 66.71/100
- National rank
- #409
- State rank
- #88 of 112 in ME
Livability — Wilton
- Score
- 64/100
- State rank
- #112
- US rank
- #14868
Category grades
Schools grade is shown separately in the Schools card above.
Census & demographics
- Census place
- Wilton, ME
- Population (ZIP)
- 3,978
Population outlook (Franklin County) Hauer SSP2
- Today (2025)
- 28,948 people
- By 2030
- 27,889 · -3.7%
- By 2040
- 25,275 · -12.7%
- By 2050
- 22,770 · -21.3%
- By 2075
- 18,980 · -34.4%
- By 2100
- 16,816 · -41.9%
Race, ethnicity, and origin ACS 2023
- Neighborhood character
- Predominantly White (96%)
- Race & ethnicity
- White 96% Black 2%
- Common ancestry
- Lithuanian 12% Slovak 5% Portuguese 2%
- Foreign-born
- 4% · Canada
- Languages at home
- 97% English-only · French/Haitian/Cajun 2%
Political lean MEDSL · Franklin
- 2024 margin
- Lean R (+8.2) · D 44.8% · R 53.0% · Other 2.2%
- 2008→2024 swing
- -28.5pp toward R · 2008: 20.3pp · 2024: -8.2pp
- All cycles
- 2024: R+8.2 2020: R+3.9 2016: R+5.5 2012: D+18.5 2008: D+20.3
Not yet ingested
- Civics
- —
Market trends
- HPI YoY
- ▼ -37.67%
- Current HPI
- 222.3995
- Rent YoY
- —
- Metro
- —
- State GDP YoY
- —
- F500 in state
- 0
Price history
+268.9% since first listed9 events — show timeline
- 2026-05-29 Listed $350,500 MREIS
- 2017-03-29 Delisted — MREIS
- 2016-09-28 Listed $75,000 MREIS
- 2016-06-30 Delisted — MREIS
- 2016-01-04 Listed $85,000 MREIS
- 2015-08-20 Delisted — MREIS
- 2015-03-05 Listed $85,000 MREIS
- 2013-08-19 Listed $85,000 MREIS
- 2012-06-08 Listed $95,000 MREIS
Cash-flow waterfall
monthlySold comps — $/sqft
last 12 mo · ≤1 miLoading sold comps…