 🌊 Lakefront
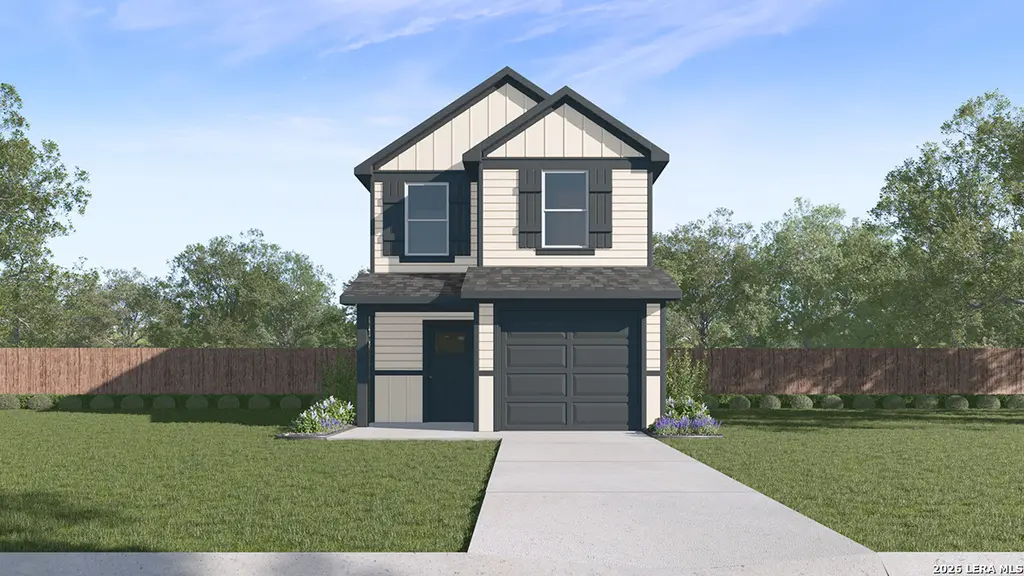
2044 Giant Cactus · San Antonio, TX
Flood risk 1/10 · Minimal
- FEMA flood zone
- A
- Chance of flooding over 30 yrs
- 0.0%
- Est. flood insurance / yr
- $1,009 – $1,996
Fire risk 1/10 · Minimal
- Est. fire insurance / yr
- $1,222 – $2,270
Heat risk 7/10 · Major
- Hot days now (above 109°F)
- 3 days/yr
- Hot days in 30 yrs
- 9 days/yr
Wind risk 8/10 · Major
- Chance of severe wind over 30 yrs
- 80.0%
Air-quality risk 2/10 · Minimal
- Unhealthy air days now
- 0 days/yr
- Unhealthy air days in 30 yrs
- 1 days/yr
Risk factors via First Street. Map © Google.
Why this score? — see what drove the D+ grade
The composite is a weighted blend of 9 inputs, each scored 0–100. Each bar is that input's sub-score; the figure is the points it added to the 100-point composite (weight × sub-score).
- ARV discount +15.0/15.0
- Cash flow +11.0/30.0
- Appreciation +6.0/10.0
- Condition / age +4.8/5.0
- Livability +4.0/5.0
- 1% rule +3.3/10.0
- DSCR +3.2/10.0
- Schools +1.8/10.0
- Rent growth +0.7/5.0
$216,840
🖨 Deal sheet (PDF) 📄 Offer letter ✓ Due diligence
Listing remarks
The Linnet is a charming two-story home featured at Sonora in San Antonio, TX. Featuring 2 classic front exteriors, this 3 bedroom, 2.5 bathroom home also offers 1419 square feet of living space and a 1-car garage. A front porch (per plan) welcomes you into the home and opens to the gourmet kitchen which includes quartz counter tops, quality cabinets, stainless steel appliances and an open concept floorplan with the kitchen flowing seamlessly into the dining room and living room. The main bedroom has an attractive ensuite bathroom that features a quartz vanity countertop and quality cabinetry. Enjoy additional storage with a spacious walk-in closet located off of the primary bathroom.
Key facts
- Gourmet kitchen
- Quality cabinets
- Quartz counter tops
Tags
Property features AI
Finance
- HOA & community: Mandatory HOA with annual fee of $180
Exterior
- Parking: 1-car garage
- Utilities: Water and sewer provided by SAWS (city); Electric and gas supplied by CPS; HERS rated with low-flow commode
- Home design: New construction by D.R. Horton; Siding and cement fiber exterior; Entry level on main floor; Subdivision: SONORA
- Construction: Slab foundation; Composition roof
- Exterior features: Patio slab; Privacy fence; Sprinkler system; Double pane windows; Street paved with curbs and streetlights
Interior
- Kitchen: Eat-in kitchen with island and breakfast bar; Microwave oven, Stove/Range, Dishwasher, Disposal, Ice maker connection; Solid countertops
- Bedrooms: Master bedroom on upper level with walk-in closet and full bath; Second bedroom (10 x 10); Third bedroom (10 x 11); Master bedroom dimensions approximately 13 x 11
- Flooring: Carpeting; Vinyl flooring
- Bathrooms: Two full bathrooms and one half bathroom; Master bath with shower only and single vanity; Master bath dimensions approximately 6 x 9
- Heating & cooling: Central heating (electric); Central air conditioning
- Interior features: Washer and dryer connections; Microwave oven, Stove/Range, Disposal, Dishwasher, Ice maker connection; Smoke alarm, Carbon monoxide detector, Electric water heater; Solid countertops; 1 living area with living/dining combination; Eat-in kitchen with island and breakfast bar; Utility room inside, Laundry room (upper level), Attic with pull-down stairs; Open floor plan, High speed internet; All bedrooms on upper level
- Laundry & utility: Washer and dryer connections; Laundry room on upper level; Utility room inside
Neighborhood map
What this means for you Summary
Snapshot
- This is a 3-bed/2.5-bath single-family listed at $217k. Condition is rated excellent.
Deal economics
- At list price, monthly cash flow is $-217 ($-3k/yr) — negative.
- To cash-flow at today's rent, offer at most $185k (14.5% below list).
- To meet the 1% rule (rent ≥ 1% of price), the offer needs to be $180k (17.0% below list).
- Recommended offer: $180k (17.0% below list) — sets the bar for 1% rule.
- Cap rate 5.8% vs local median 3.8% in San Antonio — top-decile yield for the area; either an underpriced asset or a hidden risk that comps aren't pricing in. Stress-test before assuming the spread holds.
Location & tenants
- Location reads 80/100 on livability (#31 in TX, #1,616 nationally) — a professional / high-income tenant draw. Strengths: amenities A+, commute A+, cost of living A+; Watch: crime F.
- Southside ISD (rural): math 16% / reading 25% proficiency, ranked #771 of 826 in TX (top 93%) — low school quality limits family demand, transient renter base, plan for 1-2y turnover; 76% free/reduced lunch — lower-income household profile, screen leases tightly.
- Zoned schools: Julian C Gallardo El (math 13% / reading 22%, grade F, #3,805 of 4,322 statewide, top 89%, 544 students, 87% FRL); Julius L Matthey Middle (math 17% / reading 25%, grade F, #1,387 of 1,662 statewide, top 85%, 604 students, 92% FRL); Southside H S (math 18% / reading 25%, grade F, #1,377 of 1,632 statewide, top 85%, 1,685 students, 85% FRL).
- Market conditions: Rents falling (-7.2%/yr); 389 active listings in the ZIP; 25 comparable units currently listed for rent nearby; rentals at typical pace (median 22d on market — plan ~3-4 weeks tenant-placement turnaround); 8,308 units permitted in Bexar County in 2024 (2,506 in 5+ unit buildings).
- This rent runs 34% of the median local income ($64k/yr) — at the standard rent-burdened threshold; future hikes will face affordability resistance.
Forward outlook
- In year one you build about $6k of equity ($1k loan paydown + $4k appreciation (2.0% local appreciation)).
- Bexar County population projected at +50% by 2050 — long-run rental-demand tailwind backs the buy-and-hold thesis.
- By year 6, paydown + projected appreciation supports a ~$32k cash-out refi (75% LTV) — recoverable capital for the next deal without selling this one.
Negotiation context
- It's been on market 38 days — a 3% lower offer ($210k) is reasonable based on typical stale-listing flexibility.
Risks & watch-outs
- Watch-outs: flood insurance adds $125/mo.
- Climate carrying-cost: in FEMA flood zone A (mandatory federal flood insurance); severe wind risk, 80% chance of damaging wind over 30y; extreme-heat days projected 3→9/yr by 2055 (HVAC capex compounding) — expect insurance premiums to compound above CPI over the hold.
Questions for the listing agent
- What do current leases actually rent for vs. the listed asking? Can we see a recent rent roll and the last 12 months of T-12 income?
- It's been on market 38 days. Have you received any prior offers? Is the seller open to a 17% concession, seller financing, or rate buy-down credit?
- What's the actual annual flood-insurance premium (NFIP or private), and is the property in a SFHA with mandatory coverage?
- What does the HOA fee cover, when was the last increase, and are there any pending special assessments or reserve-fund shortfalls?
- Is there a deadline driving the sale (1031 exchange, divorce, estate, relocation)? That informs how much negotiation room exists.
- Crime grade is F in this area — have there been break-ins, vandalism, or insurance claims at this property in the last 3 years? What carrier currently insures it and at what premium?
- The area grade is low — what's the realistic commute time and amenity access for the typical tenant pool here? Any planned neighborhood developments (good or bad) we should know about?
- This sits on a lake — are riparian / water-frontage rights deeded with the parcel? Any dock permits, shoreline easements, or HOA water-use restrictions?
- What's the documented flood / surge / shoreline-erosion history here (FEMA AND non-FEMA — e.g., storm surge, creek backup, septic-field saturation)?
- Any water-quality or seasonal algae-bloom issues that affect tenant satisfaction or short-term-rental demand?
- What's the average days-on-market for RENTAL listings here right now (not sales)? A rising rental-DOM trend means longer vacancies and softer asking-rent achievability than the comps imply.
- What's the recent tenant-quality profile in this submarket — average credit score on applications, eviction rate, late-payment / NSF rate, and stable-employment percentage? A property-management company in the area should have these aggregated.
- How much new for-sale + rental construction is in the pipeline within 1–3 miles? Heavy new supply typically softens prices + rents 12–24 months out; constrained supply supports both.
Investment metrics
- 1% rule
- 0.83% ✗
- Cap rate
- 5.78%
- Cash-on-cash
- -1.82%
- DSCR
- 0.92
- GRM
- 10.0
CMA / ARV
- ARV (median comp)
- $330,374
- List price
- $216,840
- Delta
- -34.37%
- Verdict
- UNDERPRICED
- Comps
- 20 within 1.0 mi
Show comp detail 10 sales within ~0.75 mi
| Address | Dist | Beds/Ba | Sqft | Sold | Price | $/sf | Match |
|---|---|---|---|---|---|---|---|
| — | 0.00mi | 3/1.0 | 1,608 (+13%) | 2mo | $90,000 | $56 | 70 |
| 2052 Organ Pipe Cactus | 0.00mi | 3/2.0 | 1,206 (-15%) | 10mo | $201,849 | $167 | 65 |
| 2030 Organ Pipe Cactus | 0.00mi | 3/2.0 | 1,206 (-15%) | 11mo | $199,999 | $166 | 64 |
| 751 Vermilion | 0.59mi | 3/2.0 | 1,454 (+2%) | 8mo | $234,999 | $162 | 60 |
| 539 Lew Pass | 0.59mi | 3/2.0 | 1,474 (+4%) | 12mo | $212,799 | $144 | 54 |
| 563 Lew Pass | 0.57mi | 3/2.0 | 1,474 (+4%) | 13mo | $203,802 | $138 | 54 |
| 526 Lew Pass | 0.64mi | 3/2.0 | 1,474 (+4%) | 11mo | $229,343 | $156 | 53 |
| 506 Lew Pass | 0.68mi | 3/2.0 | 1,474 (+4%) | 12mo | $237,999 | $161 | 50 |
| 11934 Catbird | 0.64mi | 3/2.0 | 1,211 (-15%) | 10mo | $210,000 | $173 | 36 |
| 11718 Boyd Bay | 0.61mi | 3/2.0 | 1,276 (-10%) | 24mo | $199,999 | $157 | 33 |
Match score weights: distance 35% · size 25% · config 20% · recency 20%. Top-matched comps best support the ARV.
Projected returns pro-forma
2.03% appreciation · 0.0% rent growth · sell at horizon
- IRR
- -1.2%
- Equity multiple
- 0.94×
- Total profit
- $-3,824
- Equity at exit
- $85,861
- IRR
- 1.7%
- Equity multiple
- 1.23×
- Total profit
- $13,950
- Equity at exit
- $123,899
Cash invested: $60,715 (down + closing). Projections, not guarantees.
Landlord ↔ Tenant lean methodology
- Overall (STATE)
- 87 Strongly Landlord-Friendly
- State Texas
- 87 Strongly Landlord-Friendly · R+5
- County
- — inherits STATE
- City
- — inherits STATE
ZIP-level market 78221
- Home prices YoY
- 0.8%
- Rents YoY
- -7.2%
- Active inventory
- 389
- Price-to-rent
- 10.0×
Monthly cashflow live
- Estimated rent
- $1,799 high interval (Pro) →
- Mortgage (P&I)
- −$1,137
- Tax est. 1.5%
- −$271 /mo · $3,253/yr
- Insurance
- −$90
- Flood insurance flood zone
- −$125 /mo · $1,502/yr
- HOA
- −$15
- Vacancy / Maint / Mgmt
- −$378
- Net cashflow
- $-217
Break-even live
Sensitivity live
| Price | -10% $-68 | -5% $-142 | +0% $-217 | +5% $-292 | +10% $-367 |
|---|---|---|---|---|---|
| Rent | -10% $-360 | -5% $-288 | +0% $-217 | +5% $-146 | +10% $-75 |
| Rate | -1.0pp $-108 | -0.5pp $-162 | base $-217 | +0.5pp $-274 | +1.0pp $-331 |
UW: 25.0% down · 7.5% · 30yr · 1.5% tax · 5.0% vac · 8.0% maint · 8.0% mgmt
Financing live
Cash to close
- Down payment
- $54,210
- Closing costs
- $6,505
- Reserves months
- —
- Total cash needed
- —
Loan-product check · same deal, 3 products live
Conventional
25% down · 7.5% · 30yr
- Down + closing
- —
- Monthly P&I
- —
- Monthly cashflow
- —
- DSCR
- —
- Eligible?
- —
Personal DTI + credit; lowest rate.
DSCR
20% down · 8.5% · 30yr
- Down + closing
- —
- Monthly P&I
- —
- Monthly cashflow
- —
- DSCR
- —
- Eligible?
- —
No personal income docs; deal must DSCR.
Hard money
10% down · 12.0% · 12mo
- Down + closing
- —
- Monthly P&I
- —
- Monthly cashflow
- —
- DSCR
- —
- Eligible?
- —
Short-term bridge; refi at stabilization.
Rent comps 25 comps
| Address | Beds | Baths | Sqft | Rent | $/sqft | DOM | Units | Dist |
|---|---|---|---|---|---|---|---|---|
| 2203 Cielo Rio, Lot 102 San Antonio, TX | 2.0–4.0 | 2.0–2.5 | 1574 | $2,360 | $1.50 | 0d | 150 | 0.02mi |
| 11963 Sand Wedge Way San Antonio, TX | 3.0 | 3.5 | 1474 | $1,575 | $1.07 | 6d | 1 | 0.56mi |
| 718 Albatross Way San Antonio, TX | 3.0 | 2.0 | 1436 | $1,650 | $1.15 | 14d | 1 | 0.63mi |
| 11426 Four Iron Way San Antonio, TX | 4.0 | 2.5 | 1814 | $1,695 | $0.93 | 6d | 1 | 0.64mi |
| 742 Haas Way San Antonio, TX | 4.0 | 2.0 | 1699 | $2,100 | $1.24 | 0d | 1 | 0.70mi |
| 742 Haas Way San Antonio, TX | 4.0 | 2.0 | 1699 | $2,100 | $1.24 | 19d | 1 | 0.70mi |
| 12055 Links Pkwy San Antonio, TX | 3.0 | 2.0 | 1479 | $1,625 | $1.10 | 25d | 1 | 0.73mi |
| 12030 Picard Bnd San Antonio, TX | 3.0 | 2.0 | 1450 | $1,495 | $1.03 | 5d | 1 | 0.79mi |
| 12015 Still Pass San Antonio, TX | 4.0 | 2.0 | 1635 | $1,600 | $0.98 | 22d | 1 | 0.82mi |
| 934 Cook Bnd San Antonio, TX | 4.0 | 2.0 | 1627 | $1,445 | $0.89 | 25d | 1 | 0.93mi |
| 907 Stricker Path San Antonio, TX | 3.0 | 2.0 | 1129 | $1,500 | $1.33 | 25d | 1 | 1.02mi |
| 13222 Dutra Rd San Antonio, TX | 3.0 | 2.0 | 1266 | $1,595 | $1.26 | 25d | 1 | 1.03mi |
| 1019 Snedeker Dr San Antonio, TX | 3.0 | 2.0 | 1200 | $1,449 | $1.21 | 25d | 1 | 1.06mi |
| 1343 Art Wall Way San Antonio, TX | 3.0 | 2.0 | 1440 | $1,395 | $0.97 | 45d | 1 | 1.09mi |
| 1019 Magrum Way San Antonio, TX | 3.0 | 2.0 | 1300 | $1,445 | $1.11 | 12d | 1 | 1.10mi |
| 1115 Janzen Rd San Antonio, TX | 3.0 | 2.0 | 1300 | $1,595 | $1.23 | 45d | 1 | 1.14mi |
| 1119 Jordan Xing San Antonio, TX | 3.0 | 2.0 | 1276 | $1,795 | $1.41 | 45d | 1 | 1.15mi |
| 1038 Janzen Rd San Antonio, TX | 3.0 | 2.0 | 1125 | $1,725 | $1.53 | 23d | 1 | 1.16mi |
| 1327 Mission Grande Unit 710 San Antonio, TX | 2.0 | 2.0 | 945 | $1,073 | $1.14 | 0d | 1 | 1.18mi |
| 12910 Clubhouse Blvd San Antonio, TX | 1.0–3.0 | 1.0–2.0 | 920 | $1,364 | $1.48 | 0d | 26 | 1.19mi |
| 1011 Catalonia Pass San Antonio, TX | 3.0 | 2.5 | 1470 | $1,700 | $1.16 | 25d | 1 | 1.33mi |
| 1015 Catalonia Pass San Antonio, TX | 3.0 | 2.0 | 1280 | $1,600 | $1.25 | 6d | 1 | 1.34mi |
| 13806 S Strange Way San Antonio, TX | 4.0 | 2.0 | 1668 | $1,795 | $1.08 | 25d | 1 | 1.39mi |
| 9879 Chavaneaux Lndg San Antonio, TX | 4.0 | 2.0 | 1585 | $1,700 | $1.07 | 25d | 1 | 1.44mi |
| 102 Emerald Ash Unit 710 San Antonio, TX | 2.0 | 2.0 | 950 | $973 | $1.02 | 0d | 1 | 1.47mi |
HOA detail
- Monthly dues
- $15 · $180/yr
Listing history 16 events
-
2026-06-21days on market $216,840 Active 38 DOM
-
2026-06-18days on market $216,840 Active 35 DOM
-
2026-06-17days on market $216,840 Active 34 DOM
-
2026-06-16days on market $216,840 Active 33 DOM
-
2026-06-15days on market $216,840 Active 32 DOM
-
2026-06-13days on market $216,840 Active 30 DOM
-
2026-06-13days on market $216,840 Active 29 DOM
-
2026-06-09days on market $216,840 Active 26 DOM
-
2026-06-08days on market $216,840 Active 25 DOM
-
2026-06-07days on market $216,840 Active 24 DOM
-
2026-06-04days on market $216,840 Active 21 DOM
-
2026-06-03days on market $216,840 Active 20 DOM
-
2026-06-02days on market $216,840 Active 19 DOM
-
2026-06-01days on market $216,840 Active 18 DOM
-
2026-05-31days on market $216,840 Active 17 DOM
-
2026-05-14$216,840 New 1238-char remark
ⓘ Source: listings_history table (triggers on properties + properties_extension) + one-shot
backfill from property_details.listing_events for pre-trigger history.
Climate risk First Street
- Flood 1/10 Low FEMA zone A · 0% chance over 30 yrs
- Wildfire 1/10 Low
- Heat 7/10 Severe 3 d/yr ≥109°F today · 9 d/yr by 30 yrs out
- Wind 8/10 Severe 80% chance of damaging wind over 30 yrs
- Air quality 2/10 Low 0 unhealthy d/yr today · 1 by 30 yrs out
Nearby sold comps map
Loading sold comps map…
Walkable amenities ~0.75 mi
Loading nearby amenities…
Taxation est. · year 1
- Rental income
- $21,590
- − Mortgage interest
- −$12,146
- − Property taxes
- −$3,253
- − Insurance
- −$2,587
- − Repairs & maintenance
- −$1,727
- − Management
- −$1,727
- − HOA
- −$180
- − Depreciation
- −$6,308
- Taxable loss
- −$6,338
- Est. tax savings @ 24.0%
- +$1,521
- After-tax cash flow
- $-1,088/yr
For passive investors: Depreciation is non-cash, so a rental often shows a tax loss while cash-flowing — sheltering income. Rental losses are passive: they offset passive income freely, and up to $25,000/yr can offset ordinary (W-2) income if you actively participate and your MAGI is under $100k (phasing out to $0 by $150k); unused losses carry forward. On sale, claimed depreciation is recaptured at up to 25%, and gains may owe capital-gains tax (a 1031 exchange can defer both). Figures are a year-1 estimate at your 24.0% rate — not tax advice; consult a CPA.
Condition & rehab AI · 13 photos
This two-story home is in excellent condition with modern finishes and a well-maintained exterior. It offers a spacious kitchen, bathrooms, and ample storage. The home is move-in ready and would benefit from a fresh coat of paint and some landscaping to further enhance its curb appeal.
Value-add opportunities
- Both Painting the exterior and interior walls — Fresh paint can enhance the curb appeal and interior aesthetics, making the home more attractive to potential buyers and renters.
- Both Landscaping the front yard — A well-maintained front yard can improve the home's curb appeal and add value to the property.
Renovation cost estimate screening
Value-add ROI direction
- Both Painting the exterior and interior walls — Fresh paint can enhance the curb appeal and interior aesthetics, making the home more attractive to potential buyers and renters. ↑
- Both Landscaping the front yard — A well-maintained front yard can improve the home's curb appeal and add value to the property. ↑
ⓘ Cost ranges are severity-bucket heuristics (US national rule-of-thumb). Get contractor quotes + a written scope before underwriting a rehab budget.
Schools (NCES district)
- District
- Southside ISD
- NCES district ID
- 4840920
- Math proficiency
- 16% ▼ -15.00%
- Reading proficiency
- 25% ▼ -2.00%
- Median HH income
- $43,526
- Composite
- 17.68/100
- National rank
- #9027
- State rank
- #771 of 826 in TX
Livability — San Antonio
- Score
- 80/100
- State rank
- #31
- US rank
- #1616
Category grades
Schools grade is shown separately in the Schools card above.
Census & demographics
- Census place
- San Antonio, TX
- County
- Bexar County · 1,990,555 people
- City population
- 1,806,925
- Metro
- San Antonio-New Braunfels, TX
- Population (ZIP)
- 42,178
- Household income
- $63,811
- Rent vs Own
- Severe rent burden
- 1180.0
Population outlook (Bexar County) Hauer SSP2
- Today (2025)
- 2,336,851 people
- By 2030
- 2,560,728 · +9.6%
- By 2040
- 3,020,569 · +29.3%
- By 2050
- 3,493,522 · +49.5%
- By 2075
- 4,668,459 · +99.8%
- By 2100
- 5,533,242 · +136.8%
Race, ethnicity, and origin ACS 2023
- Neighborhood character
- Predominantly Hispanic (89%)
- Race & ethnicity
- Hispanic / Latino 89% Two or more races 28% White 9% Native American 2%
- Hispanic origin (detail)
- Mexican 74%
- Common ancestry
- Lithuanian 1% Romanian 1%
- Foreign-born
- 16% · Canada
- Languages at home
- 45% English-only · Spanish 54%
Political lean MEDSL · Bexar
- 2024 margin
- Lean D (+9.8) · D 54.3% · R 44.6% · Other 1.1%
- 2008→2024 swing
- +4.2pp toward D · 2008: 5.6pp · 2024: 9.8pp
- All cycles
- 2024: D+9.8 2020: D+18.2 2016: D+13.5 2012: D+4.6 2008: D+5.6
Not yet ingested
- Civics
- —
Market trends
- HPI YoY
- ▲ 2.03%
- Current HPI
- 251.1635
- Rent YoY
- ▼ -7.21%
- Metro
- San Antonio-New Braunfels, TX
- State GDP YoY
- ▲ 3.95%
- F500 in state
- 110
Industry mix (Fortune 500 HQ in TX)
| Industry | F500 HQs | Revenue |
|---|---|---|
| Energy | 16 | $1,198B |
|
||
| Technology | 5 | $198B |
|
||
| Engineering / Construction | 4 | $72B |
|
||
| Energy Services | 3 | $60B |
|
||
| Utilities | 3 | $41B |
|
||
| Healthcare | 2 | $330B |
|
||
Price history
1 event — show timeline
- 2026-05-14 Listed $216,840 LERA
Cash-flow waterfall
monthlySold comps — $/sqft
last 12 mo · ≤1 miLoading sold comps…