1872 E Marion St · Georgetown, SC
Flood risk 3/10 · Minor
- FEMA flood zone
- X (unshaded)
- Chance of flooding over 30 yrs
- 0.12%
- Est. flood insurance / yr
- $507 – $1,088
Fire risk 4/10 · Minor
- Est. fire insurance / yr
- $783 – $1,453
Heat risk 9/10 · Severe
- Hot days now (above 109°F)
- 7 days/yr
- Hot days in 30 yrs
- 17 days/yr
Wind risk 8/10 · Major
- Chance of severe wind over 30 yrs
- 99.0%
Air-quality risk 2/10 · Minimal
- Unhealthy air days now
- 0 days/yr
- Unhealthy air days in 30 yrs
- 1 days/yr
Risk factors via First Street. Map © Google.
Why this score? — see what drove the D grade
The composite is a weighted blend of 9 inputs, each scored 0–100. Each bar is that input's sub-score; the figure is the points it added to the 100-point composite (weight × sub-score).
- Cash flow +15.8/30.0
- ARV discount +9.8/15.0
- DSCR +4.9/10.0
- 1% rule +3.2/10.0
- Livability +3.2/5.0
- Schools +2.7/10.0
- Rent growth +2.5/5.0
- Condition / age +2.5/5.0
- Appreciation +0.0/10.0
$290,000
🖨 Deal sheet (PDF) 📄 Offer letter ✓ Due diligence
Listing remarks MLS
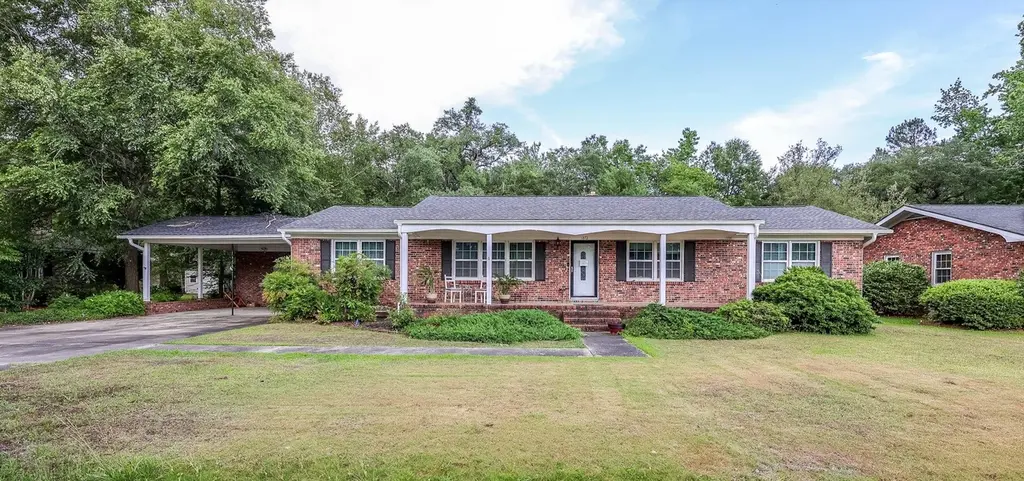
Charming All-Brick Rancher with Endless Character! This must-see home effortlessly blends timeless charm with modern convenience. From the inviting covered front porch to the lush, mature landscaping, this property offers curb appeal. Inside, original hardwood floors grace the living room, bedrooms, and hallway, creating a warm and welcoming atmosphere. The kitchen is a delight, featuring granite countertops, tile flooring, stainless steel appliances, and a matching work island. Its open design flows seamlessly into the great room, which showcases custom built-ins, an exposed brick fireplace, and access to a covered outdoor deck, perfect for entertaining or relaxing. A formal dining room connects to an additional living area, offering versatility and elegance. With three bedrooms and two bathrooms, including a primary suite with a tiled step-in shower, this home ensures both comfort and functionality. Outside, the property shines just as brightly. The spacious yard, adorned with a majestic live oak, provides a private oasis. A large carport with an attached covered workshop area adds practicality and convenience. Nestled in the desirable Kensington Plantation, this home is just minutes from historic downtown Georgetown, where shopping, dining, and fresh seafood abound. Plus, it's only an hour from Charleston and a quick 20-minute drive to the stunning shores of Pawleys Island. Don't miss this rare opportunity to own a home that truly has it all! Measurements are not guaranteed. Buyer is responsible for verifying.
Key facts
- Covered carport
- Cozy fireplace
- 0.34 acre lot
Tags
Property features AI
Finance
- Other: Lot approximately 0.34 acre; Zoned residential; Sale: For sale; Pets allowed for owner only
- HOA & community: Monthly association fee; Owner allowed golf cart; Owner allowed motorcycle; Pet restrictions; Golf carts allowed in community
Exterior
- Parking: Carport; 4 total parking spaces
- Security: Smoke detectors
- Utilities: Public water; Sewer available; Electricity available; Cable available
- Home design: Single-story; Resale property
- Construction: Brick construction
- Exterior features: Front porch; Rear porch; Porch; Storage
Interior
- Kitchen: Cooktop; Range; Dishwasher; Microwave; Stainless steel appliances; Breakfast bar
- Bedrooms: Main-level primary bedroom; Bedroom on main level
- Flooring: Tile; Wood
- Bathrooms: 2 full bathrooms
- Heating & cooling: Central heating (electric); Central air conditioning
- Interior features: Ceiling fans; Fireplace; Main-level primary bedroom; Split bedroom floor plan; Separate shower; Vanity; Breakfast bar; Bedroom on main level; Stainless steel appliances; Unfurnished
- Laundry & utility: Washer hookup; Utility room
Neighborhood map
What this means for you Summary
Snapshot
- This is a 3-bed/2.0-bath single-family listed at $290k.
Deal economics
- At list price, monthly cash flow is $131 ($2k/yr) — positive.
- The deal already cash-flows at list — no discount required.
- To meet the 1% rule (rent ≥ 1% of price), the offer needs to be $238k (17.8% below list).
- Recommended offer: $238k (17.8% below list) — sets the bar for 1% rule.
- Cap rate 6.8% vs local median 4.7% in Georgetown — top-decile yield for the area; either an underpriced asset or a hidden risk that comps aren't pricing in. Stress-test before assuming the spread holds.
Location & tenants
- Location reads 65/100 on livability (#141 in SC) — a middle-class / working-renter tenant base. Strengths: cost of living A+, housing A+, health & safety A+; Watch: amenities D, crime F, commute F.
- Georgetown 01 (town): math 26% / reading 38% proficiency, ranked #51 of 80 in SC (top 64%) — families likely to look elsewhere, expect single-tenant / working-renter base with shorter leases.
- Zoned schools: Kensington Elementary (math 34% / reading 31%, grade F, #366 of 597 statewide, top 62%, 555 students, 100% FRL); Georgetown Middle (math 15% / reading 23%, grade F, #185 of 229 statewide, top 81%, 712 students, 100% FRL); Georgetown High (math 27% / reading 75%, grade D+, #148 of 196 statewide, top 76%, 940 students, 77% FRL) — zoned schools average 92% FRL vs 59% district-wide (33 pts higher); higher-poverty schools than district average — tighter screening recommended.
- Market conditions: 412 active listings in the ZIP; 323 units permitted in Georgetown County in 2024 (0 in 5+ unit buildings).
Forward outlook
- Local home prices are declining (-3.0%/yr); year-one equity from $2k of loan paydown is wiped out by about $9k of value loss. Plan a longer hold.
Negotiation context
- Only 12 days on market — expect competitive offers; lowballing is unlikely to land.
- 7 sale attempts since 16y ago with the ask held roughly flat each time — persistent listings suggest the price (not the market) is what's stuck; bring a comps-based counter.
Risks & watch-outs
- Climate carrying-cost: severe wind risk, 99% chance of damaging wind over 30y; extreme-heat days projected 7→17/yr by 2055 (HVAC capex compounding) — expect insurance premiums to compound above CPI over the hold.
Questions for the listing agent
- Built in 1966 — when were the roof, HVAC, electrical panel, plumbing, and water heater last replaced?
- Is there a deadline driving the sale (1031 exchange, divorce, estate, relocation)? That informs how much negotiation room exists.
- Schools are F-rated, which usually means shorter tenancies and higher turnover. Who's the typical renter profile here, and what's been the actual vacancy rate?
- Crime grade is F in this area — have there been break-ins, vandalism, or insurance claims at this property in the last 3 years? What carrier currently insures it and at what premium?
- The area grade is low — what's the realistic commute time and amenity access for the typical tenant pool here? Any planned neighborhood developments (good or bad) we should know about?
- What's the average days-on-market for RENTAL listings here right now (not sales)? A rising rental-DOM trend means longer vacancies and softer asking-rent achievability than the comps imply.
- What's the recent tenant-quality profile in this submarket — average credit score on applications, eviction rate, late-payment / NSF rate, and stable-employment percentage? A property-management company in the area should have these aggregated.
- How much new for-sale + rental construction is in the pipeline within 1–3 miles? Heavy new supply typically softens prices + rents 12–24 months out; constrained supply supports both.
Investment metrics
- 1% rule
- 0.82% ✗
- Cap rate
- 6.84%
- Cash-on-cash
- 1.94%
- DSCR
- 1.09
- GRM
- 10.1
CMA / ARV
- ARV (on-the-fly)
- $305,370
- Comps found
- 12
Show comp detail 12 sales within ~0.75 mi
| Address | Dist | Beds/Ba | Sqft | Sold | Price | $/sf | Match |
|---|---|---|---|---|---|---|---|
| 1852 Marion St | 0.03mi | 3/2.0 | 1,884 (+7%) | 7mo | $392,000 | $208 | 81 |
| 465 Lot 13 - Abaco Summit Ave | 0.28mi | 3/2.0 | 1,660 (-5%) | 1mo | $364,990 | $220 | 77 |
| 530 Wildewood Ave | 0.09mi | 4/2.0 (+1) | 1,680 (-4%) | 18mo | $277,000 | $165 | 68 |
| 1682 Pickens St | 0.33mi | 4/1.5 (+1) | 1,859 (+6%) | 6mo | $200,000 | $108 | 63 |
| 10 Bush St | 0.18mi | 3/1.5 | 1,608 (-8%) | 16mo | $195,000 | $121 | 62 |
| 2004 Seitter St | 0.59mi | 3/2.0 | 1,866 (+6%) | 4mo | $215,000 | $115 | 58 |
| 447 Bragdon Ave | 0.27mi | 4/3.0 (+1) | 1,904 (+8%) | 12mo | $385,000 | $202 | 55 |
| 1834 Kensington Estates Marion St | 0.04mi | 4/2.0 (+1) | 1,978 (+13%) | 22mo | $344,000 | $174 | 54 |
| 833 2nd Ave | 0.37mi | 3/2.5 | 2,015 (+15%) | 3mo | $415,000 | $206 | 54 |
| 407 Kensington Walnut Ave | 0.25mi | 3/2.0 | 2,013 (+15%) | 15mo | $330,000 | $164 | 51 |
| 77 Jacobs Ave | 0.71mi | 3/2.0 | 1,680 (-4%) | 13mo | $260,000 | $155 | 49 |
| 1916 Jasper St | 0.48mi | 3/2.0 | 1,536 (-12%) | 14mo | $275,000 | $179 | 45 |
Match score weights: distance 35% · size 25% · config 20% · recency 20%. Top-matched comps best support the ARV.
Projected returns pro-forma
-3.0% appreciation · 3.0% rent growth · sell at horizon
- IRR
- -13.3%
- Equity multiple
- 0.52×
- Total profit
- $-38,754
- Equity at exit
- $43,240
- IRR
- -4.4%
- Equity multiple
- 0.71×
- Total profit
- $-23,468
- Equity at exit
- $25,074
Cash invested: $81,200 (down + closing). Projections, not guarantees.
Landlord ↔ Tenant lean methodology
- Overall (STATE)
- 90 Strongly Landlord-Friendly
- State South Carolina
- 90 Strongly Landlord-Friendly · R+6
- County
- — inherits STATE
- City
- — inherits STATE
ZIP-level market 29440
- Home prices YoY
- -34.9%
- Active inventory
- 412
- Price-to-rent
- 10.1×
Monthly cashflow live
- Estimated rent
- $2,384 medium interval (Pro) →
- Mortgage (P&I)
- −$1,521
- Tax from tax record
- −$111 /mo · $1,329/yr
- Insurance
- −$121
- HOA
- −$0
- Vacancy / Maint / Mgmt
- −$501
- Net cashflow
- $131
Break-even live
Sensitivity live
| Price | -10% $295 | -5% $213 | +0% $131 | +5% $49 | +10% $-33 |
|---|---|---|---|---|---|
| Rent | -10% $-57 | -5% $37 | +0% $131 | +5% $225 | +10% $320 |
| Rate | -1.0pp $277 | -0.5pp $205 | base $131 | +0.5pp $56 | +1.0pp $-20 |
UW: 25.0% down · 7.5% · 30yr · 1.5% tax · 5.0% vac · 8.0% maint · 8.0% mgmt
Financing live
Cash to close
- Down payment
- $72,500
- Closing costs
- $8,700
- Reserves months
- —
- Total cash needed
- —
Loan-product check · same deal, 3 products live
Conventional
25% down · 7.5% · 30yr
- Down + closing
- —
- Monthly P&I
- —
- Monthly cashflow
- —
- DSCR
- —
- Eligible?
- —
Personal DTI + credit; lowest rate.
DSCR
20% down · 8.5% · 30yr
- Down + closing
- —
- Monthly P&I
- —
- Monthly cashflow
- —
- DSCR
- —
- Eligible?
- —
No personal income docs; deal must DSCR.
Hard money
10% down · 12.0% · 12mo
- Down + closing
- —
- Monthly P&I
- —
- Monthly cashflow
- —
- DSCR
- —
- Eligible?
- —
Short-term bridge; refi at stabilization.
Listing history 8 events
-
2026-06-22days on market $290,000 Active 12 DOM
-
2026-06-18days on market $290,000 Active 9 DOM
-
2026-06-17days on market $290,000 Active 8 DOM
-
2026-06-16days on market $290,000 Active 7 DOM
-
2026-06-15days on market $290,000 Active 6 DOM
-
2026-06-14days on market $290,000 Active 4 DOM
-
2026-06-10remarks 699-char remark
-
2026-06-10$290,000 Active 1 DOM
ⓘ Source: listings_history table (triggers on properties + properties_extension) + one-shot
backfill from property_details.listing_events for pre-trigger history.
Tax reassessment forecast SC · Resets to sale price
- Current annual tax
- $1,329 · $111/mo
- Projected year-2 tax
- $1,653 · $138/mo
- Expected delta
- +$324/yr (+$27/mo · 24.4%)
ⓘ Screening estimate from a state-policy table — verify with the county assessor before closing.
Climate risk First Street
- Flood 3/10 Moderate FEMA zone X (unshaded) · 12% chance over 30 yrs
- Wildfire 4/10 Moderate
- Heat 9/10 Extreme 7 d/yr ≥109°F today · 17 d/yr by 30 yrs out
- Wind 8/10 Severe 99% chance of damaging wind over 30 yrs
- Air quality 2/10 Low 0 unhealthy d/yr today · 1 by 30 yrs out
Nearby sold comps map
Loading sold comps map…
Walkable amenities ~0.75 mi
Loading nearby amenities…
Taxation est. · year 1
- Rental income
- $28,611
- − Mortgage interest
- −$16,245
- − Property taxes
- −$1,329
- − Insurance
- −$1,450
- − Repairs & maintenance
- −$2,289
- − Management
- −$2,289
- − Depreciation
- −$8,436
- Taxable loss
- −$3,426
- Est. tax savings @ 24.0%
- +$822
- After-tax cash flow
- $2,397/yr
For passive investors: Depreciation is non-cash, so a rental often shows a tax loss while cash-flowing — sheltering income. Rental losses are passive: they offset passive income freely, and up to $25,000/yr can offset ordinary (W-2) income if you actively participate and your MAGI is under $100k (phasing out to $0 by $150k); unused losses carry forward. On sale, claimed depreciation is recaptured at up to 25%, and gains may owe capital-gains tax (a 1031 exchange can defer both). Figures are a year-1 estimate at your 24.0% rate — not tax advice; consult a CPA.
Schools (NCES district)
- District
- Georgetown 01
- NCES district ID
- 4502280
- Math proficiency
- 26% ▼ -11.00%
- Reading proficiency
- 38% ▼ -5.00%
- Median HH income
- $43,045
- Composite
- 27.15/100
- National rank
- #7030
- State rank
- #51 of 80 in SC
Livability — Georgetown
- Score
- 65/100
- State rank
- #141
- US rank
- #13446
Category grades
Schools grade is shown separately in the Schools card above.
Census & demographics
- Population (ZIP)
- 26,419
Population outlook (Georgetown County) Hauer SSP2
- Today (2025)
- 63,275 people
- By 2030
- 63,630 · +0.6%
- By 2040
- 63,130 · -0.2%
- By 2050
- 61,904 · -2.2%
- By 2075
- 59,305 · -6.3%
- By 2100
- 53,852 · -14.9%
Race, ethnicity, and origin ACS 2023
- Neighborhood character
- Majority White (52%)
- Race & ethnicity
- White 52% Black 45% Hispanic / Latino 2%
- Common ancestry
- Italian 3% Lithuanian 2% Slovak 1%
- Foreign-born
- 3% · Canada
- Languages at home
- 97% English-only · Spanish 2%
Political lean MEDSL · Georgetown
- 2024 margin
- R (+19.5) · D 39.6% · R 59.1% · Other 1.2%
- 2008→2024 swing
- -14.2pp toward R · 2008: -5.2pp · 2024: -19.5pp
- All cycles
- 2024: R+19.5 2020: R+12.7 2016: R+13.0 2012: R+7.6 2008: R+5.2
Not yet ingested
- Civics
- —
Market trends
- HPI YoY
- ▼ -111.84%
- Current HPI
- 208.6792
- Rent YoY
- —
- Metro
- —
- State GDP YoY
- ▲ 4.51%
- F500 in state
- 2
Industry mix (Fortune 500 HQ in SC)
| Industry | F500 HQs | Revenue |
|---|---|---|
| Packaging | 1 | $7B |
|
||
Price history
+93.3% since first listed21 events — show timeline
- 2026-05-27 Listed $290,000 CCAR
- 2025-03-24 Sold (Public Records) $258,000 Public Records
- 2025-03-24 Sold (MLS) $258,000 CCAR
- 2025-02-28 Contingent — CCAR
- 2025-02-24 Price Changed $279,900 CCAR
- 2025-01-31 Price Changed $284,900 CCAR
- 2025-01-19 Price Changed $289,999 CCAR
- 2024-12-31 Listed $295,000 CCAR
- 2022-06-03 Sold (Public Records) $265,000 Public Records
- 2022-06-03 Sold (MLS) $265,000 CCAR
- 2022-04-25 Contingent — CCAR
- 2022-04-13 Relisted — CCAR
- 2022-04-02 Contingent — CCAR
- 2022-03-25 Listed $275,000 CCAR
- 2014-11-12 Sold (Public Records) $143,100 Public Records
- 2014-11-10 Sold (MLS) $143,000 CCAR
- 2014-08-25 Listed $154,900 CCAR
- 2014-07-31 Listing Removed — CCAR
- 2013-05-09 Listed $159,900 CCAR
- 2011-10-07 Listing Removed — CCAR
- 2010-08-12 Listed $150,000 CCAR
Property tax history
-3.2%/yrLatest (2025): $1,329 · +8.0% YoY. Source: county tax records.
Cash-flow waterfall
monthlySold comps — $/sqft
last 12 mo · ≤1 miLoading sold comps…