 Multi-family
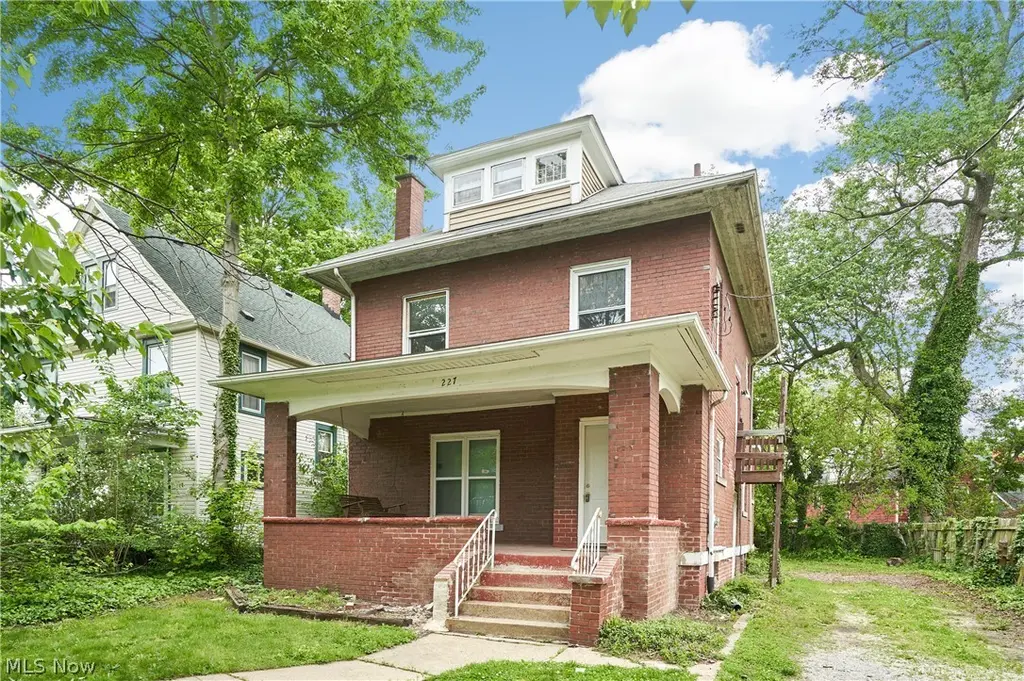
227 S Balch St · Akron, OH
Flood risk 1/10 · Minimal
- FEMA flood zone
- X (unshaded)
- Chance of flooding over 30 yrs
- 0.0%
- Est. flood insurance / yr
- $473 – $860
Fire risk 1/10 · Minimal
- Est. fire insurance / yr
- $713 – $1,323
Heat risk 3/10 · Minor
- Hot days now (above 97°F)
- 7 days/yr
- Hot days in 30 yrs
- 17 days/yr
Wind risk 1/10 · Minimal
- Chance of severe wind over 30 yrs
- —
Air-quality risk 3/10 · Minor
- Unhealthy air days now
- 2 days/yr
- Unhealthy air days in 30 yrs
- 4 days/yr
Risk factors via First Street. Map © Google.
Why this score? — see what drove the C+ grade
The composite is a weighted blend of 9 inputs, each scored 0–100. Each bar is that input's sub-score; the figure is the points it added to the 100-point composite (weight × sub-score).
- Cash flow +30.0/30.0
- 1% rule +10.0/10.0
- DSCR +10.0/10.0
- Livability +4.0/5.0
- Rent growth +2.5/5.0
- Condition / age +2.5/5.0
- Schools +2.1/10.0
- ARV discount +1.2/15.0
- Appreciation +0.0/10.0
$149,900
🖨 Deal sheet 📄 Offer letter ✓ Due diligence
Multi-family units
County records classify this as Multi-Family (2-4 Unit). Listing-text estimate: 1 unit. estimate disagrees with records
Listing remarks
Wonderful mostly brick 2.5 story home. Spacious kitchen and dining room. Kitchen applianced with plenty of cabinet space and half bath located off it. On the second floors are 3 bedrooms and a remodeled bathroom. The third floor offer s 2 additional bonus rooms that could be additional bedrooms/ or flex rooms. The Goodman furnace was new approx. . in 2018, hot water tank on 26. The roof over the front porch was new in 25 and there is 100 amp electric box. At one time this was converted to a 2 unit and rezoned for that. The current owner remodeled it back to a single family. Don't miss out on this great investment!!
Key facts
- 4,678 sq ft lot
- Built 1904
- Listed 23 days
Property features AI
Exterior
- Parking: No garage
- Utilities: Public water; Public sewer
- Home design: 3 stories; Faces west
- Construction: Brick and vinyl siding; Asphalt/fiberglass roof
- Exterior features: Covered porch; Outbuilding/storage; Back yard; Front yard; City lot; Flat/level/irregular lot
Interior
- Kitchen: Dishwasher; Range; Refrigerator
- Bathrooms: 1 full bathroom; 1 half bathroom; 1 main-level bathroom
- Heating & cooling: Forced air gas heating
- Interior features: Crown molding; Living room fireplace (1)
- Laundry & utility: Electric dryer hookup; Laundry in basement
Neighborhood map
What this means for you Summary
Snapshot
- This is a 2-bed/2.0-bath multifamily listed at $150k.
Deal economics
- At list price, monthly cash flow is $1k ($14k/yr) — positive.
- The deal already cash-flows at list — no discount required.
- Meets the 1% rule at list price ($3k rent vs $150k).
- Recommended offer: $148k (1.5% below list) — sets the bar for market timing.
- Cap rate 15.9% vs local median 6.6% in Akron — top-decile yield for the area; either an underpriced asset or a hidden risk that comps aren't pricing in. Stress-test before assuming the spread holds.
Location & tenants
- Location reads 81/100 on livability (#104 in OH, #1,591 nationally) — a professional / high-income tenant draw. Strengths: amenities A+, commute A+, cost of living A+; Watch: crime F, employment F.
- Akron City (urban): math 22% / reading 30% proficiency, ranked #602 of 656 in OH (top 92%) — low school quality limits family demand, transient renter base, plan for 1-2y turnover; 66% free/reduced lunch — lower-income household profile, screen leases tightly.
- Market conditions: 27 active listings in the ZIP; 35 comparable units currently listed for rent nearby; rentals at typical pace (median 24d on market — plan ~3-4 weeks tenant-placement turnaround); 43% of comp listings sitting > 30 days — soft ceiling on asking rent; lower-income renter base — watch delinquency; 1,114 units permitted in Summit County in 2024 (397 in 5+ unit buildings).
- At $2,842/mo this rent would consume 80% of the median local household income ($42k/yr) (locally 372% of renters already pay >50% of income on rent) — very limited rent-growth headroom before tenants either downsize or default.
Forward outlook
- Local home prices are declining (-3.0%/yr); year-one equity from $1k of loan paydown is wiped out by about $4k of value loss. Plan a longer hold.
- Summit County population projected to shrink 6% by 2050 — rents likely to lag national; underwrite the cash flow, not the appreciation.
- At projected returns (-3.0% appreciation + 3.0% rent growth), your $42k cash investment doubles in ~4 years — after that, you're playing with house money.
Negotiation context
- It's been on market 23 days — a 2% lower offer ($148k) is reasonable based on typical stale-listing flexibility.
- 2 sale attempts since 12y ago; this cycle's ask has dropped $10k (6%) from the opening price — seller is motivated, your offer sets the floor, not the list.
- Current owner paid $19k; list at $150k implies a 689% gain — meaningful room to come down on a strong offer.
Risks & watch-outs
- Watch-outs: built in 1904 — expect roof / HVAC / electrical / plumbing capex.
Questions for the listing agent
- Built in 1904 — when were the roof, HVAC, electrical panel, plumbing, and water heater last replaced?
- Is there a deadline driving the sale (1031 exchange, divorce, estate, relocation)? That informs how much negotiation room exists.
- Crime grade is F in this area — have there been break-ins, vandalism, or insurance claims at this property in the last 3 years? What carrier currently insures it and at what premium?
- What's the average days-on-market for RENTAL listings here right now (not sales)? A rising rental-DOM trend means longer vacancies and softer asking-rent achievability than the comps imply.
- What's the recent tenant-quality profile in this submarket — average credit score on applications, eviction rate, late-payment / NSF rate, and stable-employment percentage? A property-management company in the area should have these aggregated.
- How much new apartment / multifamily construction is in the pipeline within 1–3 miles? Heavy new supply (>2% of stock underway) typically softens rents 12–24 months out; light construction supports rent growth.
Investment metrics
- 1% rule
- 1.90% ✓
- Cap rate
- 15.93%
- Cash-on-cash
- 34.42%
- DSCR
- 2.53
- GRM
- 4.4
CMA / ARV
- ARV (on-the-fly)
- $131,535
- Comps found
- 2
Show comp detail 2 sales within ~0.75 mi
| Address | Dist | Beds/Ba | Sqft | Sold | Price | $/sf | Match |
|---|---|---|---|---|---|---|---|
| 18 Oakdale Ave | 0.34mi | 3/2.0 (+1) | 1,738 (+4%) | 9mo | $137,000 | $79 | 64 |
| 199 Crosby St | 0.47mi | 2/2.0 | 1,708 (+3%) | 15mo | $63,500 | $37 | 61 |
Match score weights: distance 35% · size 25% · config 20% · recency 20%. Top-matched comps best support the ARV.
Projected returns pro-forma
-3.0% appreciation · 3.0% rent growth · sell at horizon
- IRR
- 29.9%
- Equity multiple
- 2.25×
- Total profit
- $52,428
- Equity at exit
- $22,351
- IRR
- 37.2%
- Equity multiple
- 4.44×
- Total profit
- $144,569
- Equity at exit
- $12,961
Cash invested: $41,972 (down + closing). Projections, not guarantees.
Landlord ↔ Tenant lean methodology
- Overall (STATE)
- 73 Landlord-Friendly
- State Ohio
- 73 Landlord-Friendly · R+6
- County
- — inherits STATE
- City
- — inherits STATE
ZIP-level market 44302
- Active inventory
- 27
- Price-to-rent
- 13.2×
Monthly cashflow live
- Estimated rent
- $2,842 high interval (Pro) →
- Mortgage (P&I)
- −$786
- Tax from tax record
- −$193 /mo · $2,314/yr
- Insurance
- −$62
- HOA
- −$0
- Vacancy / Maint / Mgmt
- −$597
- Net cashflow
- $1,204
Break-even live
3-unit breakdown (identical units grouped — click to expand)
| Units | Beds | Baths | Est. rent |
|---|---|---|---|
| 3× units | 2 | 1 | $2,841 |
| #1 | 2 | 1 | $947 |
| #2 | 2 | 1 | $947 |
| #3 | 2 | 1 | $947 |
| Total (3 units) | $2,842 | ||
UW: 25.0% down · 7.5% · 30yr · 1.5% tax · 5.0% vac · 8.0% maint · 8.0% mgmt
Financing live
Cash to close
- Down payment
- $37,475
- Closing costs
- $4,497
- Reserves months
- —
- Total cash needed
- —
Loan-product check · same deal, 3 products live
Conventional
25% down · 7.5% · 30yr
- Down + closing
- —
- Monthly P&I
- —
- Monthly cashflow
- —
- DSCR
- —
- Eligible?
- —
Personal DTI + credit; lowest rate.
DSCR
20% down · 8.5% · 30yr
- Down + closing
- —
- Monthly P&I
- —
- Monthly cashflow
- —
- DSCR
- —
- Eligible?
- —
No personal income docs; deal must DSCR.
Hard money
10% down · 12.0% · 12mo
- Down + closing
- —
- Monthly P&I
- —
- Monthly cashflow
- —
- DSCR
- —
- Eligible?
- —
Short-term bridge; refi at stabilization.
Rent comps 35 comps
| Address | Beds | Baths | Sqft | Rent | $/sqft | DOM | Units | Dist |
|---|---|---|---|---|---|---|---|---|
| 202 Westwood Ave Akron, OH | 3.0 | 1.0 | 1344 | $1,250 | $0.93 | 14d | 1 | 0.12mi |
| 91 Westwood Ave Akron, OH | 3.0 | 1.0 | 1631 | $1,450 | $0.89 | 14d | 1 | 0.24mi |
| 55 S Balch St Unit A Akron, OH | 2.0 | 1.0 | 1500 | $800 | $0.53 | 23d | 1 | 0.26mi |
| 53 S Balch St Unit 55 Akron, OH | 2.0 | 1.0 | 1500 | $850 | $0.57 | 14d | 1 | 0.26mi |
| 445 S Maple St Akron, OH | 3.0 | 1.5 | 1041 | $1,240 | $1.19 | 44d | 7 | 0.28mi |
| 378 Trigonia Dr Akron, OH | 3.0 | 1.5 | 1090 | $1,200 | $1.10 | 44d | 1 | 0.34mi |
| 724 Crosby St Unit 1 Akron, OH | 2.0 | 1.0 | 1582 | $995 | $0.63 | 44d | 1 | 0.51mi |
| 724 Crosby St Akron, OH | 2.0 | 1.0 | 1582 | $995 | $0.63 | 23d | 1 | 0.51mi |
| 713 Crosby St Unit 1496092P Akron, OH | 3.0 | 2.0 | 1840 | $5,078 | $2.76 | 21d | 1 | 0.51mi |
| 677 Crossings Ln Akron, OH | 3.0 | 2.5 | 1440 | $1,950 | $1.35 | 23d | 1 | 0.66mi |
| 855 Work Dr Unit B Akron, OH | 1.0 | 1.0 | 1440 | $1,349 | $0.94 | 14d | 1 | 0.73mi |
| 924 Hamlin St Akron, OH | 3.0 | 1.0 | 1106 | $1,300 | $1.18 | 44d | 1 | 0.82mi |
| 918 Bye St Akron, OH | 3.0 | 1.0 | 1248 | $1,200 | $0.96 | 44d | 1 | 0.83mi |
| 156 S Main St Akron, OH | 2.0–3.0 | 2.0 | 1197 | $1,925 | $1.61 | 23d | 4 | 0.86mi |
| 321 Grace Ave Akron, OH | 3.0 | 2.0 | 1484 | $1,175 | $0.79 | 14d | 1 | 0.92mi |
| 900 W Market St Akron, OH | 2.0–3.0 | 1.5–2.0 | 1880 | $1,070 | $0.57 | 23d | 6 | 0.95mi |
| 22 E Exchange St Unit 233 Akron, OH | 2.0 | 2.0 | 1052 | $1,599 | $1.52 | 44d | 1 | 1.03mi |
| 22 E Exchange St Apt 310 Akron, OH | 3.0 | 3.0 | 1496 | $1,962 | $1.31 | 44d | 1 | 1.03mi |
| 401 S Main St Akron, OH | 4.0 | 1.0–4.0 | 814 | $1,198 | $1.47 | 14d | 54 | 1.04mi |
| 295 Noble Ave Akron, OH | 3.0 | 2.5 | 1488 | $1,600 | $1.08 | 44d | 1 | 1.04mi |
| 80 N Portage Path Akron, OH | 2.0–3.0 | 2.0 | 1462 | $1,200 | $0.82 | 44d | 1 | 1.05mi |
| 575 Noble Ave Akron, OH | 3.0 | 1.0 | 1300 | $1,350 | $1.04 | 14d | 1 | 1.09mi |
| 115 N Portage Path Unit 6 Akron, OH | 2.0 | 1.0 | 1200 | $1,195 | $1.00 | 44d | 1 | 1.12mi |
| 530 S Main St Akron, OH | 1.0–2.0 | 1.0–2.0 | 937 | $2,195 | $2.34 | 44d | 2 | 1.16mi |
| 637 Storer Ave Akron, OH | 3.0 | 1.5 | 1322 | $1,250 | $0.95 | 14d | 1 | 1.16mi |
| 931 Trimble Dr Akron, OH | 2.0 | 1.5 | 1448 | $1,495 | $1.03 | 23d | 1 | 1.22mi |
| 961 Lawton St Akron, OH | 3.0 | 1.0 | 1144 | $1,450 | $1.27 | 14d | 1 | 1.23mi |
| 730 Noble Ave Akron, OH | 3.0 | 1.0 | 1092 | $1,200 | $1.10 | 23d | 1 | 1.24mi |
| 1142 Jefferson Ave Unit 2 Akron, OH | 3.0 | 1.0 | 1200 | $1,150 | $0.96 | 44d | 1 | 1.26mi |
| 15 W York St Akron, OH | 3.0 | 1.0 | 1178 | $1,150 | $0.98 | 21d | 1 | 1.30mi |
| 15 W York St Akron, OH | 2.0 | 1.5 | 1178 | $1,150 | $0.98 | 14d | 1 | 1.30mi |
| 218 Twin Oaks Rd Unit 222-05 Akron, OH | 2.0 | 1.0 | 1100 | $1,150 | $1.05 | 44d | 1 | 1.36mi |
| 218 Twin Oaks Rd Unit 222-16 Akron, OH | 3.0 | 2.0 | 1400 | $1,500 | $1.07 | 44d | 1 | 1.36mi |
| 601 Glendora Ave Akron, OH | 3.0 | 1.0 | 1310 | $1,200 | $0.92 | 44d | 1 | 1.42mi |
| 406 Sumner St Akron, OH | 2.0–4.0 | 1.0–2.0 | 836 | $875 | $1.05 | 14d | 3 | 1.44mi |
Listing history 23 events
-
2026-06-18days on market $149,900 Active 23 DOM
-
2026-06-17days on market $149,900 Active 22 DOM
-
2026-06-16days on market $149,900 Active 21 DOM
-
2026-06-15days on market $149,900 Active 20 DOM
-
2026-06-14days on market $149,900 Active 18 DOM
-
2026-06-13days on market $149,900 Active 17 DOM
-
2026-06-10days on market $149,900 Active 15 DOM
-
2026-06-09days on market $149,900 Active 14 DOM
-
2026-06-08days on market $149,900 Active 13 DOM
-
2026-06-07days on market $149,900 Active 12 DOM
-
2026-06-05days on market $149,900 Active 9 DOM
-
2026-06-03days on market $149,900 Active 8 DOM
-
2026-06-02days on market $149,900 Active 7 DOM
-
2026-06-01days on market $149,900 Active 6 DOM
-
2026-05-31days on market $149,900 Active 5 DOM
-
2026-05-31days on market $149,900 Active 4 DOM
-
2026-05-26$159,900 Active
-
2014-12-12soldstatus $19,000
-
2014-12-12soldstatus $19,000
-
2014-11-21historical
-
2014-07-29$24,900
-
1986-10-07soldstatus $32,000
-
1980-10-31soldstatus $17,500
ⓘ Source: listings_history table (triggers on properties + properties_extension) + one-shot
backfill from property_details.listing_events for pre-trigger history.
Tax reassessment forecast OH · Partial reset (capped growth)
- Current annual tax
- $2,314 · $193/mo
- Projected year-2 tax
- $2,326 · $194/mo
- Expected delta
- +$12/yr (+$1/mo · 0.5%)
ⓘ Screening estimate from a state-policy table — verify with the county assessor before closing.
Climate risk First Street
- Flood 1/10 Low FEMA zone X (unshaded) · 0% chance over 30 yrs
- Wildfire 1/10 Low
- Heat 3/10 Moderate 7 d/yr ≥97°F today · 17 d/yr by 30 yrs out
- Wind 1/10 Low
- Air quality 3/10 Moderate 2 unhealthy d/yr today · 4 by 30 yrs out
Nearby sold comps map
Loading sold comps map…
Walkable amenities ~0.75 mi
Loading nearby amenities…
Taxation est. · year 1
- Rental income
- $34,104
- − Mortgage interest
- −$8,397
- − Property taxes
- −$2,314
- − Insurance
- −$750
- − Repairs & maintenance
- −$2,728
- − Management
- −$2,728
- − Depreciation
- −$4,361
- Taxable income
- $12,827
- Est. tax owed @ 24.0%
- −$3,078
- After-tax cash flow
- $11,367/yr
For passive investors: Depreciation is non-cash, so a rental often shows a tax loss while cash-flowing — sheltering income. Rental losses are passive: they offset passive income freely, and up to $25,000/yr can offset ordinary (W-2) income if you actively participate and your MAGI is under $100k (phasing out to $0 by $150k); unused losses carry forward. On sale, claimed depreciation is recaptured at up to 25%, and gains may owe capital-gains tax (a 1031 exchange can defer both). Figures are a year-1 estimate at your 24.0% rate — not tax advice; consult a CPA.
Schools (NCES district)
- District
- Akron City
- NCES district ID
- 3904348
- Math proficiency
- 22% ▼ -17.00%
- Reading proficiency
- 30% ▼ -12.00%
- Median HH income
- $33,811
- Composite
- 21.31/100
- National rank
- #8383
- State rank
- #602 of 656 in OH
Livability — Akron
- Score
- 81/100
- State rank
- #104
- US rank
- #1591
Category grades
Schools grade is shown separately in the Schools card above.
Census & demographics
- Census place
- Akron, OH
- County
- Summit County · 440,783 people
- City population
- 174,375
- Metro
- Akron, OH
- Population (ZIP)
- 5,474
- Household income
- $42,400
- Rent vs Own
- Severe rent burden
- 372.0
Population outlook (Summit County) Hauer SSP2
- Today (2025)
- 546,583 people
- By 2030
- 544,028 · -0.5%
- By 2040
- 531,363 · -2.8%
- By 2050
- 514,923 · -5.8%
- By 2075
- 481,765 · -11.9%
- By 2100
- 432,265 · -20.9%
Race, ethnicity, and origin ACS 2023
- Neighborhood character
- Diverse neighborhood (Simpson 0.62)
- Race & ethnicity
- White 51% Black 34% Two or more races 8% Asian 4% Hispanic / Latino 2%
- Common ancestry
- Slovak 6% Romanian 3% Lithuanian 2%
- Foreign-born
- 7% · India, Canada
- Languages at home
- 95% English-only · German/W. Germanic 2% Spanish 1% Other Indo-European 1%
Political lean MEDSL · Summit
- 2024 margin
- Lean D (+7.0) · D 53.0% · R 46.0%
- 2008→2024 swing
- -9.6pp toward R · 2008: 16.6pp · 2024: 7.0pp
- All cycles
- 2024: D+7.0 2020: D+9.6 2016: D+8.2 2012: D+14.8 2008: D+16.6
Not yet ingested
- Civics
- —
Market trends
- HPI YoY
- ▼ -127.53%
- Current HPI
- 209.7327
- Rent YoY
- —
- Metro
- Akron, OH
- State GDP YoY
- ▲ 1.98%
- F500 in state
- 48
Industry mix (Fortune 500 HQ in OH)
| Industry | F500 HQs | Revenue |
|---|---|---|
| Insurance | 3 | $145B |
|
||
| Industrial Machinery | 3 | $49B |
|
||
| Financial Services | 3 | $24B |
|
||
| Consumer Goods | 2 | $93B |
|
||
| Aerospace / Defense | 2 | $47B |
|
||
| Utilities | 2 | $33B |
|
||
Price history
+813.7% since first listed7 events — show timeline
- 2026-05-26 Listed $159,900 MLSNOW
- 2014-12-12 Sold (Public Records) $19,000 Public Records
- 2014-12-12 Sold (MLS) $19,000 MLSNOW
- 2014-11-21 Listing Removed — MLSNOW
- 2014-07-29 Listed $24,900 MLSNOW
- 1986-10-07 Sold (Public Records) $32,000 Public Records
- 1980-10-31 Sold (Public Records) $17,500 Public Records
Property tax history
+4.0%/yrLatest (2025): $2,314 · +4.9% YoY. Source: county tax records.
Cash-flow waterfall
monthlySold comps — $/sqft
last 12 mo · ≤1 miLoading sold comps…