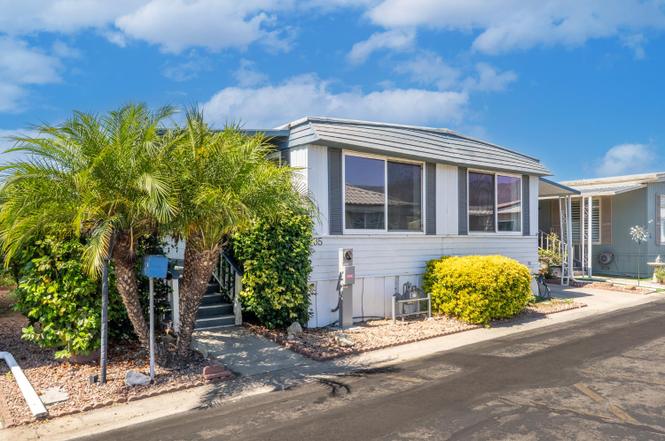
35 Don Antonio Way · Mira Monte, CA
Flood risk 1/10 · Minimal
- FEMA flood zone
- X (unshaded)
- Chance of flooding over 30 yrs
- 0.0%
- Est. flood insurance / yr
- $507 – $1,088
Fire risk 5/10 · Moderate
- Est. fire insurance / yr
- $659 – $1,223
Heat risk 5/10 · Moderate
- Hot days now (above 96°F)
- 7 days/yr
- Hot days in 30 yrs
- 19 days/yr
Wind risk 1/10 · Minimal
- Chance of severe wind over 30 yrs
- —
Air-quality risk 8/10 · Major
- Unhealthy air days now
- 12 days/yr
- Unhealthy air days in 30 yrs
- 12 days/yr
Risk factors via First Street. Map © Google.
Why this score? — see what drove the B+ grade
The composite is a weighted blend of 9 inputs, each scored 0–100. Each bar is that input's sub-score; the figure is the points it added to the 100-point composite (weight × sub-score).
- Cash flow +30.0/30.0
- ARV discount +15.0/15.0
- DSCR +10.0/10.0
- 1% rule +8.9/10.0
- Condition / age +3.8/5.0
- Schools +3.2/10.0
- Livability +3.2/5.0
- Rent growth +2.5/5.0
- Appreciation +0.0/10.0
$259,000
🖨 Deal sheet 📄 Offer letter ✓ Due diligence
Listing remarks
Welcome home to this charming and well-maintained 2-bedroom, 2-bath residence located in the desirable Ojai Villa 55+ Community. Offering approximately 1,392 square feet of living space, this home features an inviting floor plan with a spacious living room showcasing beautiful mountain views, built-in shelving, and updated windows throughout. The kitchen offers newer cabinetry, a butcher block breakfast bar, and all appliances included. The primary suite features a walk-in closet, dual-sink vanity, and step-in shower, while the versatile office/den provides additional space for hobbies, guests, or a home office. Additional highlights include central air and heat, updated plumbing, a dedicat
Key facts
- Walk-in closet
- Dual-sink vanity
- Built-in shelving
Tags
Property features AI
Exterior
- Home design: Residential mobile home
- Exterior features: Has a view
Interior
- Kitchen: Dishwasher; Disposal
- Flooring: Carpet; Vinyl; Wood
- Heating & cooling: Forced Air heating; Natural gas heating
- Interior features: Dishwasher; Disposal
Neighborhood map
What this means for you Summary
Snapshot
- This is a 2-bed/2.0-bath manufactured listed at $259k. Condition is rated good.
Deal economics
- At list price, monthly cash flow is $1k ($13k/yr) — positive.
- The deal already cash-flows at list — no discount required.
- Meets the 1% rule at list price ($4k rent vs $259k).
- Cap rate 11.2% vs local median 3.2% in Mira Monte — top-decile yield for the area; either an underpriced asset or a hidden risk that comps aren't pricing in. Stress-test before assuming the spread holds.
Location & tenants
- Location reads 64/100 on livability (#401 in CA) — a middle-class / working-renter tenant base. Strengths: commute A+, employment A+, crime A-; Watch: amenities F, cost of living F.
- Ojai Unified (suburban): math 27% / reading 43% proficiency, ranked #257 of 517 in CA (top 50%) — families likely to look elsewhere, expect single-tenant / working-renter base with shorter leases.
- Market conditions: 135 active listings in the ZIP; 4 comparable units currently listed for rent nearby; rentals lingering (median 44d on market — plan ~5-8 weeks vacancy on turnover, expect pricing pressure); 50% of comp listings sitting > 30 days — soft ceiling on asking rent; solid renter incomes; 1,759 units permitted in Ventura County in 2024 (1,196 in 5+ unit buildings).
- At $3,593/mo this rent would consume 53% of the median local household income ($81k/yr) (locally 723% of renters already pay >50% of income on rent) — very limited rent-growth headroom before tenants either downsize or default.
Forward outlook
- Local home prices are declining (-3.0%/yr); year-one equity from $2k of loan paydown is wiped out by about $8k of value loss. Plan a longer hold.
- Ventura County population projected at +4% by 2050 — modest demand growth; plan on rents tracking national, not racing it.
- At projected returns (-3.0% appreciation + 3.0% rent growth), your $73k cash investment doubles in ~7 years — after that, you're playing with house money.
Negotiation context
- Only 1 days on market — expect competitive offers; lowballing is unlikely to land.
Risks & watch-outs
- Climate carrying-cost: moderate wildfire risk; extreme-heat days projected 7→19/yr by 2055 (HVAC capex compounding) — expect insurance premiums to compound above CPI over the hold.
Questions for the listing agent
- Built in 1971 — when were the roof, HVAC, electrical panel, plumbing, and water heater last replaced?
- Is there a deadline driving the sale (1031 exchange, divorce, estate, relocation)? That informs how much negotiation room exists.
- Schools are B-rated — typically a magnet for longer-tenancy family renters. What's the average tenant stay here, and is there a school-zone premium baked into asking?
- What's the average days-on-market for RENTAL listings here right now (not sales)? A rising rental-DOM trend means longer vacancies and softer asking-rent achievability than the comps imply.
- What's the recent tenant-quality profile in this submarket — average credit score on applications, eviction rate, late-payment / NSF rate, and stable-employment percentage? A property-management company in the area should have these aggregated.
- How much new for-sale + rental construction is in the pipeline within 1–3 miles? Heavy new supply typically softens prices + rents 12–24 months out; constrained supply supports both.
Investment metrics
- 1% rule
- 1.39% ✓
- Cap rate
- 11.15%
- Cash-on-cash
- 17.35%
- DSCR
- 1.77
- GRM
- 6.0
CMA / ARV
- ARV (on-the-fly)
- $370,272
- Comps found
- 12
Show comp detail 12 sales within ~0.75 mi
| Address | Dist | Beds/Ba | Sqft | Sold | Price | $/sf | Match |
|---|---|---|---|---|---|---|---|
| 110 Don Carlos Way #110 | 0.06mi | 3/2.0 (+1) | 1,344 (-3%) | 1mo | $300,000 | $223 | 85 |
| 56 Don Antonio Way #56 | 0.20mi | 2/2.0 | 1,440 (+3%) | 1mo | $270,000 | $188 | 84 |
| 11 Don Antonio Way | 0.18mi | 2/2.0 | 1,248 (-10%) | 9mo | $310,000 | $248 | 67 |
| 16 Don Antonio Way #16 | 0.22mi | 3/2.0 (+1) | 1,521 (+9%) | 6mo | $405,000 | $266 | 64 |
| 16 Don Antonio Way | 0.22mi | 3/2.0 (+1) | 1,521 (+9%) | 6mo | $405,000 | $266 | 64 |
| 950 Woodland Ave #123 | 0.40mi | 3/2.0 (+1) | 1,450 (+4%) | 8mo | $325,000 | $224 | 63 |
| 1273 S Rice Rd #53 | 0.42mi | 2/2.0 | 1,272 (-9%) | 5mo | $425,000 | $334 | 62 |
| 950 Woodland Ave #115 | 0.40mi | 3/2.0 (+1) | 1,488 (+7%) | 6mo | $325,000 | $218 | 60 |
| 1273 S Rice Rd #12 | 0.43mi | 3/2.0 (+1) | 1,248 (-10%) | 2mo | $410,000 | $329 | 56 |
| 1273 S Rice Rd #72 | 0.49mi | 3/2.0 (+1) | 1,498 (+8%) | 7mo | $450,000 | $300 | 54 |
| 1273 S Rice Rd #55 | 0.42mi | 3/2.0 (+1) | 1,232 (-12%) | 3mo | $320,000 | $260 | 54 |
| 11195 N Ventura Ave #17 | 0.74mi | 3/2.0 (+1) | 1,236 (-11%) | 4mo | $345,000 | $279 | 38 |
Match score weights: distance 35% · size 25% · config 20% · recency 20%. Top-matched comps best support the ARV.
Projected returns pro-forma
-3.0% appreciation · 3.0% rent growth · sell at horizon
- IRR
- 8.7%
- Equity multiple
- 1.34×
- Total profit
- $24,866
- Equity at exit
- $38,618
- IRR
- 17.9%
- Equity multiple
- 2.49×
- Total profit
- $107,863
- Equity at exit
- $22,394
Cash invested: $72,520 (down + closing). Projections, not guarantees.
Landlord ↔ Tenant lean methodology
- Overall (STATE)
- 18 Strongly Tenant-Friendly
- State California
- 18 Strongly Tenant-Friendly · D+13
- County
- — inherits STATE
- City
- — inherits STATE
ZIP-level market 93023
- Active inventory
- 135
- Price-to-rent
- 6.0×
Monthly cashflow live
- Estimated rent
- $3,593 medium interval (Pro) →
- Mortgage (P&I)
- −$1,358
- Tax est. 1.5%
- −$324 /mo · $3,885/yr
- Insurance
- −$108
- HOA
- −$0
- Vacancy / Maint / Mgmt
- −$755
- Net cashflow
- $1,049
Break-even live
UW: 25.0% down · 7.5% · 30yr · 1.5% tax · 5.0% vac · 8.0% maint · 8.0% mgmt
Financing live
Cash to close
- Down payment
- $64,750
- Closing costs
- $7,770
- Reserves months
- —
- Total cash needed
- —
Loan-product check · same deal, 3 products live
Conventional
25% down · 7.5% · 30yr
- Down + closing
- —
- Monthly P&I
- —
- Monthly cashflow
- —
- DSCR
- —
- Eligible?
- —
Personal DTI + credit; lowest rate.
DSCR
20% down · 8.5% · 30yr
- Down + closing
- —
- Monthly P&I
- —
- Monthly cashflow
- —
- DSCR
- —
- Eligible?
- —
No personal income docs; deal must DSCR.
Hard money
10% down · 12.0% · 12mo
- Down + closing
- —
- Monthly P&I
- —
- Monthly cashflow
- —
- DSCR
- —
- Eligible?
- —
Short-term bridge; refi at stabilization.
Rent comps 4 comps
| Address | Beds | Baths | Sqft | Rent | $/sqft | DOM | Units | Dist |
|---|---|---|---|---|---|---|---|---|
| 718 S La Luna Ave Ojai, CA | 2.0 | 2.0 | 1250 | $3,600 | $2.88 | 43d | 1 | 0.97mi |
| 714 S La Luna Ave Unit A Ojai, CA | 1.0 | 1.0 | 1000 | $2,600 | $2.60 | 19d | 1 | 0.97mi |
| 218 Barbara St Oak View, CA | 3.0 | 2.0 | 1786 | $3,500 | $1.96 | 16d | 1 | 1.01mi |
| 511 S La Luna Ave Ojai, CA | 2.0 | 1.0 | 1200 | $3,700 | $3.08 | 43d | 1 | 1.19mi |
Listing history 2 events
-
2026-06-19remarks 699-char remark
-
2026-06-19$259,000 Active 1 DOM
ⓘ Source: listings_history table (triggers on properties + properties_extension) + one-shot
backfill from property_details.listing_events for pre-trigger history.
Climate risk First Street
- Flood 1/10 Low FEMA zone X (unshaded) · 0% chance over 30 yrs
- Wildfire 5/10 Major
- Heat 5/10 Major 7 d/yr ≥96°F today · 19 d/yr by 30 yrs out
- Wind 1/10 Low
- Air quality 8/10 Severe 12 unhealthy d/yr today · 12 by 30 yrs out
Nearby sold comps map
Loading sold comps map…
Walkable amenities ~0.75 mi
Loading nearby amenities…
Taxation est. · year 1
- Rental income
- $43,115
- − Mortgage interest
- −$14,508
- − Property taxes
- −$3,885
- − Insurance
- −$1,295
- − Repairs & maintenance
- −$3,449
- − Management
- −$3,449
- − Depreciation
- −$7,535
- Taxable income
- $8,994
- Est. tax owed @ 24.0%
- −$2,159
- After-tax cash flow
- $10,424/yr
For passive investors: Depreciation is non-cash, so a rental often shows a tax loss while cash-flowing — sheltering income. Rental losses are passive: they offset passive income freely, and up to $25,000/yr can offset ordinary (W-2) income if you actively participate and your MAGI is under $100k (phasing out to $0 by $150k); unused losses carry forward. On sale, claimed depreciation is recaptured at up to 25%, and gains may owe capital-gains tax (a 1031 exchange can defer both). Figures are a year-1 estimate at your 24.0% rate — not tax advice; consult a CPA.
Condition & rehab AI · 12 photos
This well-maintained 2-bedroom, 2-bath manufactured home in the Ojai Villa 55+ Community is ready for a fresh coat of paint and new flooring to enhance its curb appeal and value.
Value-add opportunities
- Both paint exterior — enhances curb appeal and value
- Both replace carpet — improves comfort and value
- Both update flooring — enhances aesthetic and value
- Both update kitchen countertops — enhances aesthetic and value
- Both update bathroom fixtures — enhances aesthetic and value
Renovation cost estimate screening
Value-add ROI direction
- Both paint exterior — enhances curb appeal and value ↑
- Both replace carpet — improves comfort and value ↑
- Both update flooring — enhances aesthetic and value ↑
- Both update kitchen countertops — enhances aesthetic and value ↑
- Both update bathroom fixtures — enhances aesthetic and value ↑
ⓘ Cost ranges are severity-bucket heuristics (US national rule-of-thumb). Get contractor quotes + a written scope before underwriting a rehab budget.
Schools (NCES district)
- District
- Ojai Unified
- NCES district ID
- 0628270
- Math proficiency
- 27% ▼ -5.00%
- Reading proficiency
- 43% ▼ -1.00%
- Median HH income
- $67,618
- Composite
- 31.97/100
- National rank
- #5839
- State rank
- #257 of 517 in CA
Livability — Mira Monte
- Score
- 64/100
- State rank
- #401
- US rank
- #13701
Category grades
Schools grade is shown separately in the Schools card above.
Census & demographics
- Census place
- Mira Monte, CA
- County
- Ventura County · 829,955 people
- Metro
- Oxnard-Thousand Oaks-Ventura, CA
- Population (ZIP)
- 21,036
- Household income
- $80,927
- Rent vs Own
- Severe rent burden
- 723.0
Population outlook (Ventura County) Hauer SSP2
- Today (2025)
- 895,754 people
- By 2030
- 912,134 · +1.8%
- By 2040
- 931,454 · +4.0%
- By 2050
- 934,609 · +4.3%
- By 2075
- 924,899 · +3.3%
- By 2100
- 864,712 · -3.5%
Race, ethnicity, and origin ACS 2023
- Neighborhood character
- Predominantly White (71%)
- Race & ethnicity
- White 71% Hispanic / Latino 20% Two or more races 10% Asian 3%
- Hispanic origin (detail)
- Mexican 17%
- Common ancestry
- Slovak 4% Portuguese 3% Italian 2%
- Foreign-born
- 15% · Canada, South Korea
- Languages at home
- 80% English-only · Spanish 15% German/W. Germanic 2% Other Indo-European 1%
Political lean MEDSL · Ventura
- 2024 margin
- D (+15.1) · D 56.1% · R 41.0% · Other 2.9%
- 2008→2024 swing
- +2.8pp toward D · 2008: 12.3pp · 2024: 15.1pp
- All cycles
- 2024: D+15.1 2020: D+21.1 2016: D+16.8 2012: D+5.3 2008: D+12.3
Not yet ingested
- Civics
- —
Market trends
- HPI YoY
- ▼ -942.31%
- Current HPI
- 331.6103
- Rent YoY
- —
- Metro
- Oxnard-Thousand Oaks-Ventura, CA
- State GDP YoY
- ▲ 3.21%
- F500 in state
- 116
Industry mix (Fortune 500 HQ in CA)
| Industry | F500 HQs | Revenue |
|---|---|---|
| Technology | 27 | $1,492B |
|
||
| Financial Services | 3 | $174B |
|
||
| Retail | 3 | $44B |
|
||
| Insurance | 3 | $26B |
|
||
| Media / Entertainment | 2 | $115B |
|
||
| Pharmaceuticals / Biotech | 2 | $62B |
|
||
Price history
1 event — show timeline
- 2026-06-16 Listed $259,000 OVMLS
Cash-flow waterfall
monthlySold comps — $/sqft
last 12 mo · ≤1 miLoading sold comps…