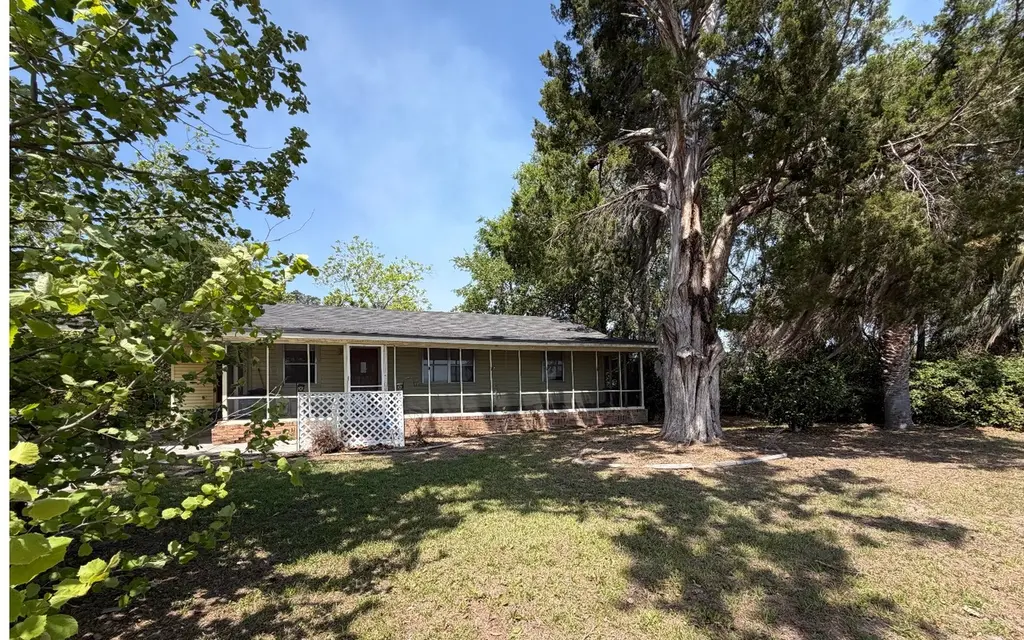
358 SE Cr 245 · Watertown, FL
Flood risk 1/10 · Minimal
- FEMA flood zone
- X (unshaded)
- Chance of flooding over 30 yrs
- 0.0%
- Est. flood insurance / yr
- $507 – $1,088
Fire risk 6/10 · Moderate
- Est. fire insurance / yr
- $947 – $1,759
Heat risk 8/10 · Major
- Hot days now (above 107°F)
- 7 days/yr
- Hot days in 30 yrs
- 20 days/yr
Wind risk 9/10 · Severe
- Chance of severe wind over 30 yrs
- 99.0%
Air-quality risk 5/10 · Moderate
- Unhealthy air days now
- 9 days/yr
- Unhealthy air days in 30 yrs
- 10 days/yr
Risk factors via First Street. Map © Google.
Why this score? — see what drove the D+ grade
The composite is a weighted blend of 9 inputs, each scored 0–100. Each bar is that input's sub-score; the figure is the points it added to the 100-point composite (weight × sub-score).
- Cash flow +15.8/30.0
- Appreciation +10.0/10.0
- DSCR +4.9/10.0
- Schools +4.5/10.0
- 1% rule +3.8/10.0
- Livability +3.0/5.0
- Rent growth +2.5/5.0
- Condition / age +2.5/5.0
- ARV discount +1.9/15.0
$199,000
🖨 Deal sheet 📄 Offer letter ✓ Due diligence
Listing remarks MLS
Beautiful country home on over an acre of land, close to town. Large screened in veranda on front side of house. Spacious work shed partially closed off and re-done for office space or whatever you desire. Yard furnished with Pecan trees, Pear trees, and Grape Arbor.
Key facts
- 1.15 acres yard
- Mature pecan trees
- Workshop house
Tags
Property features AI
Exterior
- Parking: On-street parking
- Utilities: Private well water
- Home design: Single-story residential home
- Construction: Frame construction; Shingle roof
- Exterior features: Screened patio/porch; Workshop on property
Interior
- Kitchen: Dishwasher; Electric cooktop; Refrigerator
- Flooring: Laminate flooring
- Bathrooms: 1 full bathroom
- Heating & cooling: Central heating (electric); Central air conditioning
- Interior features: Dishwasher; Electric cooktop; Refrigerator
Neighborhood map
What this means for you Summary
Snapshot
- This is a 3-bed/1.0-bath single-family listed at $199k.
Deal economics
- At list price, monthly cash flow is $91 ($1k/yr) — positive.
- The deal already cash-flows at list — no discount required.
- To meet the 1% rule (rent ≥ 1% of price), the offer needs to be $174k (12.4% below list).
- Recommended offer: $174k (12.4% below list) — sets the bar for 1% rule.
- Cap rate 6.8% vs local median 5.5% in Watertown — meaningfully above typical; check what's discounted (condition, days-on-market, listing class) to confirm the premium yield is real.
Location & tenants
- Location reads 60/100 on livability (#798 in FL) — a middle-class / working-renter tenant base. Strengths: crime A+, cost of living A+, housing A-; Watch: schools F, amenities F, commute F.
- Columbia (town): math 53% / reading 54% proficiency, ranked #25 of 73 in FL (top 34%) — acceptable for families but not a draw, mixed tenant base, ~2y average lease.
- Market conditions: 143 active listings in the ZIP; 178 units permitted in Columbia County in 2024 (0 in 5+ unit buildings).
- This rent runs 38% of the median local income ($55k/yr) — at the standard rent-burdened threshold; future hikes will face affordability resistance.
Forward outlook
- In year one you build about $21k of equity ($1k loan paydown + $20k appreciation (10.0% local appreciation)).
- Columbia County population projected to shrink 7% by 2050 — rents likely to lag national; underwrite the cash flow, not the appreciation.
- At projected returns (10.0% appreciation + 3.0% rent growth), your $56k cash investment doubles in ~3 years — after that, you're playing with house money.
- By year 2, paydown + projected appreciation supports a ~$34k cash-out refi (75% LTV) — recoverable capital for the next deal without selling this one.
Negotiation context
- It's been on market 57 days — a 3% lower offer ($193k) is reasonable based on typical stale-listing flexibility.
- 3 sale attempts since 3y ago; this cycle's ask has dropped $21k (10%) from the opening price — seller is motivated, your offer sets the floor, not the list.
- Current owner paid $120k; list at $199k implies a 66% gain — meaningful room to come down on a strong offer.
Risks & watch-outs
- Climate carrying-cost: severe wind risk, 99% chance of damaging wind over 30y; major wildfire risk; extreme-heat days projected 7→20/yr by 2055 (HVAC capex compounding) — expect insurance premiums to compound above CPI over the hold.
Questions for the listing agent
- It's been on market 57 days. Have you received any prior offers? Is the seller open to a 12% concession, seller financing, or rate buy-down credit?
- Built in 1960 — when were the roof, HVAC, electrical panel, plumbing, and water heater last replaced?
- Is there a deadline driving the sale (1031 exchange, divorce, estate, relocation)? That informs how much negotiation room exists.
- Schools are F-rated, which usually means shorter tenancies and higher turnover. Who's the typical renter profile here, and what's been the actual vacancy rate?
- The area grade is low — what's the realistic commute time and amenity access for the typical tenant pool here? Any planned neighborhood developments (good or bad) we should know about?
- What's the average days-on-market for RENTAL listings here right now (not sales)? A rising rental-DOM trend means longer vacancies and softer asking-rent achievability than the comps imply.
- What's the recent tenant-quality profile in this submarket — average credit score on applications, eviction rate, late-payment / NSF rate, and stable-employment percentage? A property-management company in the area should have these aggregated.
- How much new for-sale + rental construction is in the pipeline within 1–3 miles? Heavy new supply typically softens prices + rents 12–24 months out; constrained supply supports both.
Investment metrics
- 1% rule
- 0.88% ✗
- Cap rate
- 6.84%
- Cash-on-cash
- 1.97%
- DSCR
- 1.09
- GRM
- 9.5
CMA / ARV
- ARV (on-the-fly)
- $176,960
- Comps found
- 12
Show comp detail 12 sales within ~0.75 mi
| Address | Dist | Beds/Ba | Sqft | Sold | Price | $/sf | Match |
|---|---|---|---|---|---|---|---|
| 205 SE Tristin Ln | 0.30mi | 2/2.0 (-1) | 1,151 (+3%) | 6mo | $210,000 | $182 | 67 |
| 367 SE Tribble St | 0.70mi | 3/1.5 | 1,103 (-2%) | 2mo | $160,000 | $145 | 61 |
| 173 SE Jenese Way | 0.37mi | 2/2.0 (-1) | 1,216 (+9%) | 0mo | $180,000 | $148 | 59 |
| 755 SE Rosewood Cir | 0.59mi | 2/2.0 (-1) | 1,111 (-1%) | 4mo | $165,000 | $149 | 59 |
| 741 SE Rosewood Cir | 0.59mi | 2/2.0 (-1) | 1,193 (+6%) | 6mo | $189,000 | $158 | 48 |
| 114 SE Tristin Ln | 0.39mi | 2/2.0 (-1) | 1,232 (+10%) | 11mo | $206,000 | $167 | 47 |
| 734 SE Rosewood Cir | 0.62mi | 2/2.0 (-1) | 1,017 (-9%) | 2mo | $160,000 | $157 | 45 |
| 201 SE Rosewood Cir | 0.62mi | 2/2.0 (-1) | 1,220 (+9%) | 7mo | $187,000 | $153 | 41 |
| 187 SE Elm Loop | 0.75mi | 2/2.0 (-1) | 1,189 (+6%) | 6mo | $202,500 | $170 | 41 |
| 256 SE Pearl Ter | 0.47mi | 2/2.0 (-1) | 1,256 (+12%) | 10mo | $200,000 | $159 | 40 |
| 208 SE Elm Loop | 0.73mi | 3/2.0 | 1,230 (+10%) | 7mo | $192,500 | $157 | 40 |
| 406 SE Pearl Ter | 0.54mi | 2/2.0 (-1) | 1,288 (+15%) | 9mo | $219,000 | $170 | 34 |
Match score weights: distance 35% · size 25% · config 20% · recency 20%. Top-matched comps best support the ARV.
Projected returns pro-forma
10.0% appreciation · 3.0% rent growth · sell at horizon
- IRR
- 25.7%
- Equity multiple
- 3.05×
- Total profit
- $114,169
- Equity at exit
- $179,275
- IRR
- 22.6%
- Equity multiple
- 6.95×
- Total profit
- $331,578
- Equity at exit
- $386,613
Cash invested: $55,720 (down + closing). Projections, not guarantees.
Landlord ↔ Tenant lean methodology
- Overall (STATE)
- 87 Strongly Landlord-Friendly
- State Florida
- 87 Strongly Landlord-Friendly · R+3
- County
- — inherits STATE
- City
- — inherits STATE
ZIP-level market 32025
- Home prices YoY
- 6.8%
- Active inventory
- 143
- Price-to-rent
- 9.5×
Monthly cashflow live
- Estimated rent
- $1,744 medium interval (Pro) →
- Mortgage (P&I)
- −$1,044
- Tax from tax record
- −$160 /mo · $1,920/yr
- Insurance
- −$83
- HOA
- −$0
- Vacancy / Maint / Mgmt
- −$366
- Net cashflow
- $91
Break-even live
UW: 25.0% down · 7.5% · 30yr · 1.5% tax · 5.0% vac · 8.0% maint · 8.0% mgmt
Financing live
Cash to close
- Down payment
- $49,750
- Closing costs
- $5,970
- Reserves months
- —
- Total cash needed
- —
Loan-product check · same deal, 3 products live
Conventional
25% down · 7.5% · 30yr
- Down + closing
- —
- Monthly P&I
- —
- Monthly cashflow
- —
- DSCR
- —
- Eligible?
- —
Personal DTI + credit; lowest rate.
DSCR
20% down · 8.5% · 30yr
- Down + closing
- —
- Monthly P&I
- —
- Monthly cashflow
- —
- DSCR
- —
- Eligible?
- —
No personal income docs; deal must DSCR.
Hard money
10% down · 12.0% · 12mo
- Down + closing
- —
- Monthly P&I
- —
- Monthly cashflow
- —
- DSCR
- —
- Eligible?
- —
Short-term bridge; refi at stabilization.
Listing history 22 events
-
2026-06-19days on market $199,000 Active 57 DOM
-
2026-06-18days on market $199,000 Active 56 DOM
-
2026-06-17days on market $199,000 Active 55 DOM
-
2026-06-16days on market $199,000 Active 54 DOM
-
2026-06-15days on market $199,000 Active 53 DOM
-
2026-06-14days on market $199,000 Active 51 DOM
-
2026-06-12pricedays on market $199,000 Active 50 DOM
-
2026-06-09days on market $220,000 Active 47 DOM
-
2026-06-08days on market $220,000 Active 46 DOM
-
2026-06-07days on market $220,000 Active 45 DOM
-
2026-06-05days on market $220,000 Active 42 DOM
-
2026-06-03days on market $220,000 Active 41 DOM
-
2026-06-02days on market $220,000 Active 40 DOM
-
2026-06-01days on market $220,000 Active 39 DOM
-
2026-05-31days on market $220,000 Active 38 DOM
-
2026-05-30days on market $220,000 Active 37 DOM
-
2026-04-23$220,000 Active
-
2023-04-18soldstatus $120,000
-
2023-03-31soldstatus $120,000 Closed 267-char remark
Show marketing remark (267 chars)
Beautiful country home on over an acre of land, close to town. Large screened in veranda on front side of house. Spacious work shed partially closed off and re-done for office space or whatever you desire. Yard furnished with Pecan trees, Pear trees, and Grape Arbor.
-
2023-03-28status Active 267-char remark
Show marketing remark (267 chars)
Beautiful country home on over an acre of land, close to town. Large screened in veranda on front side of house. Spacious work shed partially closed off and re-done for office space or whatever you desire. Yard furnished with Pecan trees, Pear trees, and Grape Arbor.
-
2023-03-07$140,000 Active 267-char remark
Show marketing remark (267 chars)
Beautiful country home on over an acre of land, close to town. Large screened in veranda on front side of house. Spacious work shed partially closed off and re-done for office space or whatever you desire. Yard furnished with Pecan trees, Pear trees, and Grape Arbor.
-
2006-10-16soldstatus $110,000
ⓘ Source: listings_history table (triggers on properties + properties_extension) + one-shot
backfill from property_details.listing_events for pre-trigger history.
Tax reassessment forecast FL · Resets to sale price
- Current annual tax
- $1,920 · $160/mo
- Projected year-2 tax
- $1,920 · $160/mo
- Expected delta
- $0/yr ($0/mo · 0.0%)
ⓘ Screening estimate from a state-policy table — verify with the county assessor before closing.
Climate risk First Street
- Flood 1/10 Low FEMA zone X (unshaded) · 0% chance over 30 yrs
- Wildfire 6/10 Major
- Heat 8/10 Severe 7 d/yr ≥107°F today · 20 d/yr by 30 yrs out
- Wind 9/10 Extreme 99% chance of damaging wind over 30 yrs
- Air quality 5/10 Major 9 unhealthy d/yr today · 10 by 30 yrs out
Nearby sold comps map
Loading sold comps map…
Walkable amenities ~0.75 mi
Loading nearby amenities…
Taxation est. · year 1
- Rental income
- $20,929
- − Mortgage interest
- −$11,147
- − Property taxes
- −$1,920
- − Insurance
- −$995
- − Repairs & maintenance
- −$1,674
- − Management
- −$1,674
- − Depreciation
- −$5,789
- Taxable loss
- −$2,271
- Est. tax savings @ 24.0%
- +$545
- After-tax cash flow
- $1,641/yr
For passive investors: Depreciation is non-cash, so a rental often shows a tax loss while cash-flowing — sheltering income. Rental losses are passive: they offset passive income freely, and up to $25,000/yr can offset ordinary (W-2) income if you actively participate and your MAGI is under $100k (phasing out to $0 by $150k); unused losses carry forward. On sale, claimed depreciation is recaptured at up to 25%, and gains may owe capital-gains tax (a 1031 exchange can defer both). Figures are a year-1 estimate at your 24.0% rate — not tax advice; consult a CPA.
Schools (NCES district)
- District
- Columbia
- NCES district ID
- 1200360
- Math proficiency
- 53% ▼ -10.00%
- Reading proficiency
- 54% ▼ -3.00%
- Median HH income
- $40,053
- Composite
- 44.74/100
- National rank
- #2750
- State rank
- #25 of 73 in FL
Livability — Watertown
- Score
- 60/100
- State rank
- #798
- US rank
- #18481
Category grades
Schools grade is shown separately in the Schools card above.
Census & demographics
- Census place
- Watertown, FL
- County
- Columbia County · 40,507 people
- City population
- 40,507
- Metro
- Lake City, FL
- Population (ZIP)
- 22,948
- Household income
- $55,004
- Rent vs Own
- Severe rent burden
- 754.0
Population outlook (Columbia County) Hauer SSP2
- Today (2025)
- 68,129 people
- By 2030
- 67,501 · -0.9%
- By 2040
- 65,465 · -3.9%
- By 2050
- 63,058 · -7.4%
- By 2075
- 56,291 · -17.4%
- By 2100
- 45,243 · -33.6%
Race, ethnicity, and origin ACS 2023
- Neighborhood character
- Predominantly White (67%)
- Race & ethnicity
- White 67% Black 20% Hispanic / Latino 8% Two or more races 7%
- Hispanic origin (detail)
- Mexican 1% Puerto Rican 3% Cuban 1%
- Common ancestry
- Serbian 2% Lithuanian 2% Romanian 2%
- Foreign-born
- 3% · Canada
- Languages at home
- 91% English-only · Spanish 6% French/Haitian/Cajun 2%
Political lean MEDSL · Columbia
- 2024 margin
- Solid R (+50.2) · D 24.6% · R 74.7%
- 2008→2024 swing
- -16.4pp toward R · 2008: -33.8pp · 2024: -50.2pp
- All cycles
- 2024: R+50.2 2020: R+45.2 2016: R+44.5 2012: R+36.7 2008: R+33.8
Not yet ingested
- Civics
- —
Market trends
- HPI YoY
- ▲ 17.57%
- Current HPI
- 276.7253
- Rent YoY
- —
- Metro
- Lake City, FL
- State GDP YoY
- ▲ 3.28%
- F500 in state
- 36
Industry mix (Fortune 500 HQ in FL)
| Industry | F500 HQs | Revenue |
|---|---|---|
| Industrial Technology | 2 | $29B |
|
||
| Insurance | 2 | $17B |
|
||
| Retail | 1 | $60B |
|
||
| Technology Distribution | 1 | $58B |
|
||
| Homebuilding | 1 | $35B |
|
||
| Technology Manufacturing | 1 | $35B |
|
||
Price history
+100.0% since first listed6 events — show timeline
- 2026-04-23 Listed $220,000 NFMLS
- 2023-04-18 Sold (Public Records) $120,000 Public Records
- 2023-03-31 Sold (MLS) $120,000 NFMLS
- 2023-03-28 Relisted — NFMLS
- 2023-03-07 Listed $140,000 NFMLS
- 2006-10-16 Sold (Public Records) $110,000 Public Records
Property tax history
+6.6%/yrLatest (2025): $1,920 · +0.5% YoY. Source: county tax records.
Cash-flow waterfall
monthlySold comps — $/sqft
last 12 mo · ≤1 miLoading sold comps…