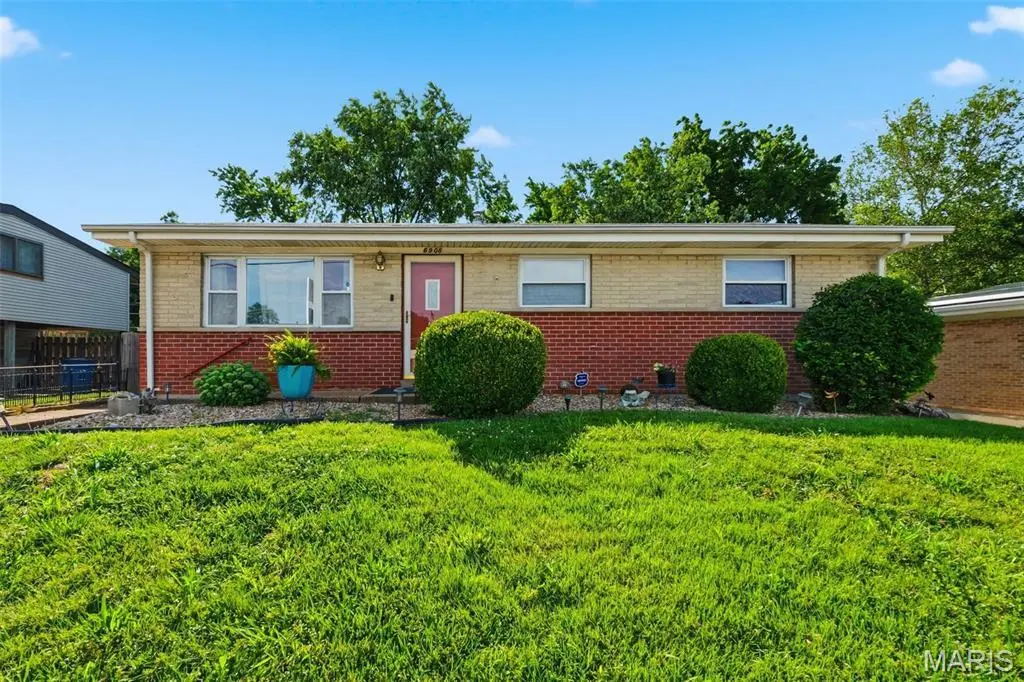
6908 Howdershell Rd · Hazelwood, MO
Flood risk 1/10 · Minimal
- FEMA flood zone
- X (unshaded)
- Chance of flooding over 30 yrs
- 0.0%
- Est. flood insurance / yr
- $473 – $860
Fire risk 1/10 · Minimal
- Est. fire insurance / yr
- $1,054 – $1,958
Heat risk 4/10 · Minor
- Hot days now (above 106°F)
- 7 days/yr
- Hot days in 30 yrs
- 21 days/yr
Wind risk 2/10 · Minimal
- Chance of severe wind over 30 yrs
- 1.0%
Air-quality risk 2/10 · Minimal
- Unhealthy air days now
- 2 days/yr
- Unhealthy air days in 30 yrs
- 2 days/yr
Risk factors via First Street. Map © Google.
Why this score? — see what drove the D grade
The composite is a weighted blend of 9 inputs, each scored 0–100. Each bar is that input's sub-score; the figure is the points it added to the 100-point composite (weight × sub-score).
- Cash flow +12.0/30.0
- ARV discount +11.4/15.0
- Rent growth +3.6/5.0
- DSCR +3.5/10.0
- 1% rule +3.1/10.0
- Livability +3.1/5.0
- Condition / age +2.5/5.0
- Schools +1.7/10.0
- Appreciation +0.0/10.0
$150,000
🖨 Deal sheet 📄 Offer letter ✓ Due diligence
Listing remarks
Don't wait stop by 6908 Howdershell Rd. This is a very well maintained 3-bedroom with 1 full bath brick home located in the Hazelwood West school district. The main level has beautiful hard wood floors throughout the main level. Kitchen is equipped with granite countertops and open space with plenty of cabinet space. Downstairs is partially finished with an office which can be used as a 4th bedroom, a bar for entertaining, and plenty of storage space. The heating and cooling system is about 7 years old with all the original receipts and paperwork and the hot water tank is about 6 months old. When you walk out to the back yard you will find a beautiful, well maintained, fenced in leveled bac
Key facts
- Hard wood floors
- Office
- Hot tub
Tags
Property features AI
Finance
- Other: Property type: Residential, single family residence
- Financial info: Lease not considered
Exterior
- Utilities: Public water; Public sewer; Electric service by Ameren; Cable available; Electricity connected; Natural gas connected; Sewer connected; Water connected
- Home design: Single family residence (attached); One level listed; living area reported as 960; Brick, frame, and vinyl siding exterior
- Construction: Brick, frame, and vinyl siding construction
- Exterior features: Front yard; Back yard
Interior
- Kitchen: Gas cooktop; Dishwasher; Refrigerator; Ice maker
- Bedrooms: 6 bedrooms total; 3 bedrooms on the main level; 3 bedrooms on the upper level
- Bathrooms: 2 full bathrooms total; 1 full bathroom on the main level; 1 full bathroom on the upper level
- Heating & cooling: Natural gas heating; Central air conditioning
- Interior features: Partially finished basement; Ice maker; Gas water heater
- Laundry & utility: Washer and dryer included
Neighborhood map
What this means for you Summary
Snapshot
- This is a 3-bed/1.0-bath single-family listed at $150k.
Deal economics
- At list price, monthly cash flow is $-36 ($-435/yr) — negative.
- To cash-flow at today's rent, offer at most $144k (4.3% below list).
- To meet the 1% rule (rent ≥ 1% of price), the offer needs to be $121k (19.4% below list).
- Recommended offer: $121k (19.4% below list) — sets the bar for 1% rule.
Location & tenants
- Location reads 62/100 on livability (#395 in MO) — a middle-class / working-renter tenant base. Strengths: cost of living A+, housing A+; Watch: crime F, amenities F, commute F.
- Hazelwood (suburban): math 11% / reading 26% proficiency, ranked #306 of 324 in MO (top 94%) — low school quality limits family demand, transient renter base, plan for 1-2y turnover.
- Zoned schools: Armstrong Elem. (math 8% / reading 22%, grade F, #982 of 1,115 statewide, top 89%, 348 students, 83% FRL); Hazelwood West High (math 16% / reading 42%, grade F, #407 of 521 statewide, top 78%, 2,042 students, 54% FRL) — zoned schools average 69% FRL vs 53% district-wide (15 pts higher); higher-poverty schools than district average — tighter screening recommended.
- Market conditions: Rents rising fast (+4.5%/yr); 68 active listings in the ZIP; 12 comparable units currently listed for rent nearby; rentals at typical pace (median 24d on market — plan ~3-4 weeks tenant-placement turnaround); 42% of comp listings sitting > 30 days — soft ceiling on asking rent; 920 units permitted in St. Louis County in 2024 (250 in 5+ unit buildings).
Forward outlook
- Local home prices are declining (-3.0%/yr); year-one equity from $1k of loan paydown is wiped out by about $4k of value loss. Plan a longer hold.
Negotiation context
- Only 1 days on market — expect competitive offers; lowballing is unlikely to land.
Risks & watch-outs
- Watch-outs: built in 1959 — expect roof / HVAC / electrical / plumbing capex.
Questions for the listing agent
- What do current leases actually rent for vs. the listed asking? Can we see a recent rent roll and the last 12 months of T-12 income?
- Built in 1959 — when were the roof, HVAC, electrical panel, plumbing, and water heater last replaced?
- Is there a deadline driving the sale (1031 exchange, divorce, estate, relocation)? That informs how much negotiation room exists.
- Schools are D-rated, which usually means shorter tenancies and higher turnover. Who's the typical renter profile here, and what's been the actual vacancy rate?
- Crime grade is F in this area — have there been break-ins, vandalism, or insurance claims at this property in the last 3 years? What carrier currently insures it and at what premium?
- The area grade is low — what's the realistic commute time and amenity access for the typical tenant pool here? Any planned neighborhood developments (good or bad) we should know about?
- What's the average days-on-market for RENTAL listings here right now (not sales)? A rising rental-DOM trend means longer vacancies and softer asking-rent achievability than the comps imply.
- What's the recent tenant-quality profile in this submarket — average credit score on applications, eviction rate, late-payment / NSF rate, and stable-employment percentage? A property-management company in the area should have these aggregated.
- How much new for-sale + rental construction is in the pipeline within 1–3 miles? Heavy new supply typically softens prices + rents 12–24 months out; constrained supply supports both.
Investment metrics
- 1% rule
- 0.81% ✗
- Cap rate
- 6.00%
- Cash-on-cash
- -1.03%
- DSCR
- 0.95
- GRM
- 10.3
CMA / ARV
- ARV (on-the-fly)
- $164,160
- Comps found
- 12
Show comp detail 12 sales within ~0.75 mi
| Address | Dist | Beds/Ba | Sqft | Sold | Price | $/sf | Match |
|---|---|---|---|---|---|---|---|
| 6902 Howdershell Rd | 0.03mi | 3/1.0 | 960 (0%) | 4mo | $150,000 | $156 | 95 |
| 845 Riderwood Dr | 0.08mi | 3/1.0 | 960 (0%) | 10mo | $149,375 | $156 | 88 |
| 6709 Village Square Dr | 0.40mi | 3/1.5 | 962 (+0%) | 1mo | $180,000 | $187 | 78 |
| 6705 Village Square Dr | 0.41mi | 3/1.0 | 962 (+0%) | 4mo | $130,000 | $135 | 77 |
| 7250 Howdershell Rd | 0.41mi | 3/1.0 | 950 (-1%) | 7mo | $109,900 | $116 | 73 |
| 6803 Cherryvale Dr | 0.51mi | 3/1.5 | 962 (+0%) | 6mo | $149,000 | $155 | 69 |
| 1890 Caposele Ln | 0.39mi | 3/1.0 | 1,025 (+7%) | 5mo | $175,000 | $171 | 67 |
| 1782 Oliveto Ln | 0.58mi | 3/2.0 | 950 (-1%) | 3mo | $209,000 | $220 | 65 |
| 608 Holiday Ave | 0.57mi | 3/1.0 | 912 (-5%) | 3mo | $165,000 | $181 | 62 |
| 7240 Howdershell | 0.40mi | 4/2.0 (+1) | 1,032 (+8%) | 4mo | $130,000 | $126 | 57 |
| 575 Candle Light Ln | 0.71mi | 3/1.5 | 987 (+3%) | 6mo | $195,000 | $198 | 55 |
| 1945 Tahoe Dr | 0.74mi | 3/1.0 | 912 (-5%) | 10mo | $159,900 | $175 | 49 |
Match score weights: distance 35% · size 25% · config 20% · recency 20%. Top-matched comps best support the ARV.
Projected returns pro-forma
-3.0% appreciation · 4.45% rent growth · sell at horizon
- IRR
- -16.5%
- Equity multiple
- 0.41×
- Total profit
- $-24,834
- Equity at exit
- $22,365
- IRR
- -5.9%
- Equity multiple
- 0.59×
- Total profit
- $-17,074
- Equity at exit
- $12,969
Cash invested: $42,000 (down + closing). Projections, not guarantees.
Landlord ↔ Tenant lean methodology
- Overall (STATE)
- 81 Strongly Landlord-Friendly
- State Missouri
- 81 Strongly Landlord-Friendly · R+10
- County
- — inherits STATE
- City
- — inherits STATE
ZIP-level market 63042
- Rents YoY
- 4.5%
- Active inventory
- 68
- Price-to-rent
- 10.3×
Monthly cashflow live
- Estimated rent
- $1,209 high interval (Pro) →
- Mortgage (P&I)
- −$787
- Tax from tax record
- −$142 /mo · $1,703/yr
- Insurance
- −$62
- HOA
- −$0
- Vacancy / Maint / Mgmt
- −$254
- Net cashflow
- $-36
Break-even live
UW: 25.0% down · 7.5% · 30yr · 1.5% tax · 5.0% vac · 8.0% maint · 8.0% mgmt
Financing live
Cash to close
- Down payment
- $37,500
- Closing costs
- $4,500
- Reserves months
- —
- Total cash needed
- —
Loan-product check · same deal, 3 products live
Conventional
25% down · 7.5% · 30yr
- Down + closing
- —
- Monthly P&I
- —
- Monthly cashflow
- —
- DSCR
- —
- Eligible?
- —
Personal DTI + credit; lowest rate.
DSCR
20% down · 8.5% · 30yr
- Down + closing
- —
- Monthly P&I
- —
- Monthly cashflow
- —
- DSCR
- —
- Eligible?
- —
No personal income docs; deal must DSCR.
Hard money
10% down · 12.0% · 12mo
- Down + closing
- —
- Monthly P&I
- —
- Monthly cashflow
- —
- DSCR
- —
- Eligible?
- —
Short-term bridge; refi at stabilization.
Rent comps 12 comps
| Address | Beds | Baths | Sqft | Rent | $/sqft | DOM | Units | Dist |
|---|---|---|---|---|---|---|---|---|
| 1052 Teson Rd Unit 1048A Hazelwood, MO | 2.0 | 1.0 | 800 | $995 | $1.24 | 43d | 1 | 0.10mi |
| 1052 Teson Rd Unit 1068D Hazelwood, MO | 2.0 | 1.0 | 800 | $1,000 | $1.25 | 16d | 1 | 0.10mi |
| 1052 Teson Rd Unit 1064D Hazelwood, MO | 2.0 | 1.0 | 800 | $1,000 | $1.25 | 43d | 1 | 0.10mi |
| 508 Saratoga Ln Hazelwood, MO | 3.0 | 1.0 | 988 | $1,306 | $1.32 | 23d | 1 | 0.76mi |
| 532 Holiday Ave Hazelwood, MO | 3.0 | 1.0 | 912 | $1,350 | $1.48 | 43d | 1 | 0.79mi |
| 7404 Olian Dr Hazelwood, MO | 2.0 | 1.0 | 870 | $925 | $1.06 | 43d | 1 | 1.09mi |
| 446 Olian Dr Hazelwood, MO | 2.0 | 1.0 | 880 | $975 | $1.11 | 2d | 1 | 1.09mi |
| 858 Hazelvalley Dr Hazelwood, MO | 3.0 | 1.5 | 912 | $1,450 | $1.59 | 43d | 1 | 1.13mi |
| 2280 Keeven Ln Florissant, MO | 1.0–3.0 | 1.0–1.5 | 805 | $1,290 | $1.60 | 1d | 14 | 1.35mi |
| 240 Chapel Ridge Dr Hazelwood, MO | 1.0–2.0 | 1.0 | 797 | $1,295 | $1.62 | 1d | 2 | 1.38mi |
| 240 Chapel Ridge Dr Unit 218A Hazelwood, MO | 2.0 | 2.0 | 960 | $1,275 | $1.33 | 23d | 1 | 1.38mi |
| 240 Chapel Ridge Dr Unit 257C Hazelwood, MO | 2.0 | 1.0 | 870 | $1,235 | $1.42 | 20d | 1 | 1.38mi |
Listing history 2 events
-
2026-06-18remarks 699-char remark
-
2026-06-18$150,000 Active 1 DOM
ⓘ Source: listings_history table (triggers on properties + properties_extension) + one-shot
backfill from property_details.listing_events for pre-trigger history.
Tax reassessment forecast MO · Resets to sale price
- Current annual tax
- $1,703 · $142/mo
- Projected year-2 tax
- $1,703 · $142/mo
- Expected delta
- $0/yr ($0/mo · -0.0%)
ⓘ Screening estimate from a state-policy table — verify with the county assessor before closing.
Climate risk First Street
- Flood 1/10 Low FEMA zone X (unshaded) · 0% chance over 30 yrs
- Wildfire 1/10 Low
- Heat 4/10 Moderate 7 d/yr ≥106°F today · 21 d/yr by 30 yrs out
- Wind 2/10 Low 100% chance of damaging wind over 30 yrs
- Air quality 2/10 Low 2 unhealthy d/yr today · 2 by 30 yrs out
Nearby sold comps map
Loading sold comps map…
Walkable amenities ~0.75 mi
Loading nearby amenities…
Taxation est. · year 1
- Rental income
- $14,504
- − Mortgage interest
- −$8,402
- − Property taxes
- −$1,703
- − Insurance
- −$750
- − Repairs & maintenance
- −$1,160
- − Management
- −$1,160
- − Depreciation
- −$4,364
- Taxable loss
- −$3,036
- Est. tax savings @ 24.0%
- +$729
- After-tax cash flow
- $294/yr
For passive investors: Depreciation is non-cash, so a rental often shows a tax loss while cash-flowing — sheltering income. Rental losses are passive: they offset passive income freely, and up to $25,000/yr can offset ordinary (W-2) income if you actively participate and your MAGI is under $100k (phasing out to $0 by $150k); unused losses carry forward. On sale, claimed depreciation is recaptured at up to 25%, and gains may owe capital-gains tax (a 1031 exchange can defer both). Figures are a year-1 estimate at your 24.0% rate — not tax advice; consult a CPA.
Schools (NCES district)
- District
- Hazelwood
- NCES district ID
- 2913830
- Math proficiency
- 11% ▼ -13.00%
- Reading proficiency
- 26% ▼ -6.00%
- Median HH income
- $51,621
- Composite
- 16.77/100
- National rank
- #9156
- State rank
- #306 of 324 in MO
Livability — Hazelwood
- Score
- 62/100
- State rank
- #395
- US rank
- #16956
Category grades
Schools grade is shown separately in the Schools card above.
Census & demographics
- Census place
- Hazelwood, MO
- County
- Saint Louis County · 888,823 people
- City population
- 17,813
- Metro
- St. Louis, MO-IL
- Population (ZIP)
- 17,813
- Household income
- $49,453
- Rent vs Own
- Severe rent burden
- 766.0
Population outlook (St. Louis County) Hauer SSP2
- Today (2025)
- 1,025,227 people
- By 2030
- 1,028,023 · +0.3%
- By 2040
- 1,020,940 · -0.4%
- By 2050
- 1,007,280 · -1.8%
- By 2075
- 987,277 · -3.7%
- By 2100
- 921,984 · -10.1%
Race, ethnicity, and origin ACS 2023
- Neighborhood character
- Diverse neighborhood (Simpson 0.64)
- Race & ethnicity
- White 46% Black 38% Two or more races 10% Hispanic / Latino 4% Asian 2%
- Common ancestry
- Lithuanian 3% Romanian 1% Italian 1%
- Foreign-born
- 5% · Canada, Vietnam
- Languages at home
- 94% English-only · Spanish 3% Vietnamese 1% Tagalog/Filipino 1%
Political lean MEDSL · St. Louis
- 2024 margin
- Strong D (+23.4) · D 60.8% · R 37.4% · Other 1.7%
- 2008→2024 swing
- +3.5pp toward D · 2008: 19.9pp · 2024: 23.4pp
- All cycles
- 2024: D+23.4 2020: D+24.0 2016: D+16.2 2012: D+13.7 2008: D+19.9
Not yet ingested
- Civics
- —
Market trends
- HPI YoY
- ▼ -204.48%
- Current HPI
- 234.7353
- Rent YoY
- ▲ 4.45%
- Metro
- St. Louis, MO-IL
- State GDP YoY
- ▲ 1.84%
- F500 in state
- 20
Industry mix (Fortune 500 HQ in MO)
| Industry | F500 HQs | Revenue |
|---|---|---|
| Healthcare | 1 | $163B |
|
||
| Insurance | 1 | $21B |
|
||
| Industrial Technology | 1 | $17B |
|
||
| Retail | 1 | $16B |
|
||
| Industrial Distribution | 1 | $10B |
|
||
| Utilities | 1 | $9B |
|
||
Price history
+11.2% since first listed4 events — show timeline
- 2026-06-18 Listed $150,000 MARIS as Distributed by MLS Grid
- 2026-06-18 Coming Soon $150,000 MARIS as Distributed by MLS Grid
- 2022-10-06 Price Changed $134,900 MARIS as Distributed by MLS Grid
- 1995-10-26 Sold (Public Records) — Public Records
Property tax history
+4.6%/yrLatest (2022): $1,703 · +1.7% YoY. Source: county tax records.
Cash-flow waterfall
monthlySold comps — $/sqft
last 12 mo · ≤1 miLoading sold comps…