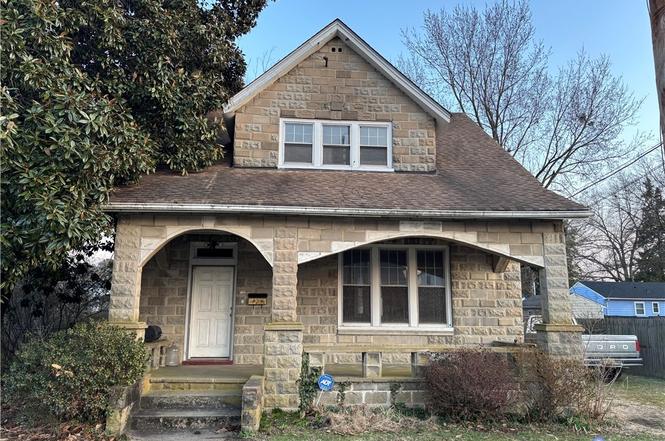
9 N Elm Ave · Highland Springs, VA
Flood risk 1/10 · Minimal
- FEMA flood zone
- X (unshaded)
- Chance of flooding over 30 yrs
- 0.0%
- Est. flood insurance / yr
- $507 – $1,088
Fire risk 2/10 · Minimal
- Est. fire insurance / yr
- $666 – $1,236
Heat risk 8/10 · Major
- Hot days now (above 106°F)
- 7 days/yr
- Hot days in 30 yrs
- 17 days/yr
Wind risk 6/10 · Moderate
- Chance of severe wind over 30 yrs
- 27.0%
Air-quality risk 2/10 · Minimal
- Unhealthy air days now
- 1 days/yr
- Unhealthy air days in 30 yrs
- 2 days/yr
Risk factors via First Street. Map © Google.
Why this score? — see what drove the C grade
The composite is a weighted blend of 9 inputs, each scored 0–100. Each bar is that input's sub-score; the figure is the points it added to the 100-point composite (weight × sub-score).
- Cash flow +19.4/30.0
- ARV discount +15.0/15.0
- DSCR +6.1/10.0
- Schools +4.9/10.0
- 1% rule +4.6/10.0
- Livability +3.6/5.0
- Rent growth +2.5/5.0
- Condition / age +2.5/5.0
- Appreciation +0.0/10.0
$199,950
🖨 Deal sheet 📄 Offer letter ✓ Due diligence
Listing remarks MLS
Impressed designs in block surrounding porch and upstairs window. Hardwood floors throughout downstairs except for ceramic tile in bathroom and kitchen. This house has all the decorative archways, door transoms, cornices and original newel posts of a historic arts and crafts house. Foreclosure, sold 'as is'.
Key facts
- Over 9 foot ceilings
- Double lot
- Florida room
Tags
Neighborhood map
What this means for you Summary
Snapshot
- This is a 3-bed/1.0-bath single-family listed at $200k.
Deal economics
- At list price, monthly cash flow is $223 ($3k/yr) — positive.
- The deal already cash-flows at list — no discount required.
- To meet the 1% rule (rent ≥ 1% of price), the offer needs to be $192k (4.2% below list).
- Recommended offer: $192k (4.2% below list) — sets the bar for 1% rule.
- Cap rate 7.6% vs local median 5.1% in Highland Springs — top-decile yield for the area; either an underpriced asset or a hidden risk that comps aren't pricing in. Stress-test before assuming the spread holds.
Location & tenants
- Location reads 72/100 on livability (#196 in VA) — a middle-class / working-renter tenant base. Strengths: commute A+, cost of living A+, housing A+; Watch: employment C-, amenities F, health & safety F.
- Henrico County Public School District (suburban): math 49% / reading 64% proficiency, ranked #68 of 131 in VA (top 52%) — acceptable for families but not a draw, mixed tenant base, ~2y average lease.
- Market conditions: 63 active listings in the ZIP; 8 comparable units currently listed for rent nearby; rentals leasing fast (median 11d on market — plan ~1-2 weeks tenant-placement turnaround); 1,826 units permitted in Henrico County in 2024 (785 in 5+ unit buildings).
- This rent runs 41% of the median local income ($56k/yr) — at the standard rent-burdened threshold; future hikes will face affordability resistance.
Forward outlook
- Local home prices are declining (-3.0%/yr); year-one equity from $1k of loan paydown is wiped out by about $6k of value loss. Plan a longer hold.
- Henrico County population projected at +21% by 2050 — long-run rental-demand tailwind backs the buy-and-hold thesis.
Negotiation context
- Only 14 days on market — expect competitive offers; lowballing is unlikely to land.
- 6 sale attempts since 20y ago with the ask held roughly flat each time — persistent listings suggest the price (not the market) is what's stuck; bring a comps-based counter.
- Current owner paid $106k; list at $200k implies a 89% gain — meaningful room to come down on a strong offer.
Risks & watch-outs
- Watch-outs: built in 1939 — expect roof / HVAC / electrical / plumbing capex.
- Climate carrying-cost: major wind risk, 27% chance of damaging wind over 30y; extreme-heat days projected 7→17/yr by 2055 (HVAC capex compounding) — expect insurance premiums to compound above CPI over the hold.
Questions for the listing agent
- Built in 1939 — when were the roof, HVAC, electrical panel, plumbing, and water heater last replaced?
- Is there a deadline driving the sale (1031 exchange, divorce, estate, relocation)? That informs how much negotiation room exists.
- What's the average days-on-market for RENTAL listings here right now (not sales)? A rising rental-DOM trend means longer vacancies and softer asking-rent achievability than the comps imply.
- What's the recent tenant-quality profile in this submarket — average credit score on applications, eviction rate, late-payment / NSF rate, and stable-employment percentage? A property-management company in the area should have these aggregated.
- How much new for-sale + rental construction is in the pipeline within 1–3 miles? Heavy new supply typically softens prices + rents 12–24 months out; constrained supply supports both.
Investment metrics
- 1% rule
- 0.96% ✗
- Cap rate
- 7.63%
- Cash-on-cash
- 4.79%
- DSCR
- 1.21
- GRM
- 8.7
CMA / ARV
- ARV (on-the-fly)
- $299,145
- Comps found
- 12
Show comp detail 12 sales within ~0.75 mi
| Address | Dist | Beds/Ba | Sqft | Sold | Price | $/sf | Match |
|---|---|---|---|---|---|---|---|
| 9 N Elm Ave | 0.00mi | 3/1.5 | 1,617 (0%) | 0mo | $195,000 | $121 | 98 |
| 4 N Elm Ave | 0.04mi | 3/1.5 | 1,608 (-1%) | 7mo | $190,000 | $118 | 89 |
| 24 S Grove Ave | 0.22mi | 3/2.0 | 1,660 (+3%) | 5mo | $270,000 | $163 | 77 |
| 10 S Beech Ave | 0.22mi | 3/1.0 | 1,743 (+8%) | 1mo | $285,000 | $164 | 76 |
| 213 S Holly Ave | 0.37mi | 3/1.0 | 1,722 (+6%) | 2mo | $164,450 | $95 | 70 |
| 5 N Oak Ave | 0.54mi | 3/1.0 | 1,524 (-6%) | 1mo | $260,000 | $171 | 65 |
| 207 E Read St | 0.36mi | 3/2.0 | 1,480 (-8%) | 2mo | $337,500 | $228 | 64 |
| 107 Quince | 0.64mi | 3/2.0 | 1,568 (-3%) | 2mo | $343,500 | $219 | 60 |
| 107 N Linden Ave | 0.40mi | 3/1.5 | 1,406 (-13%) | 0mo | $315,000 | $224 | 57 |
| 500 Highland Dr | 0.46mi | 3/1.0 | 1,403 (-13%) | 1mo | $260,000 | $185 | 56 |
| 500 N Daisy Ave | 0.54mi | 3/1.5 | 1,507 (-7%) | 8mo | $300,000 | $199 | 55 |
| 307 N Lake Ave | 0.65mi | 3/2.5 | 1,392 (-14%) | 6mo | $290,000 | $208 | 36 |
Match score weights: distance 35% · size 25% · config 20% · recency 20%. Top-matched comps best support the ARV.
Projected returns pro-forma
-3.0% appreciation · 3.0% rent growth · sell at horizon
- IRR
- -8.9%
- Equity multiple
- 0.67×
- Total profit
- $-18,198
- Equity at exit
- $29,813
- IRR
- 0.6%
- Equity multiple
- 1.04×
- Total profit
- $2,365
- Equity at exit
- $17,288
Cash invested: $55,986 (down + closing). Projections, not guarantees.
Landlord ↔ Tenant lean methodology
- Overall (STATE)
- 55 Moderately Landlord-Leaning
- State Virginia
- 55 Moderately Landlord-Leaning · D+2
- County
- — inherits STATE
- City
- — inherits STATE
ZIP-level market 23075
- Home prices YoY
- -13.6%
- Active inventory
- 63
- Price-to-rent
- 8.7×
Monthly cashflow live
- Estimated rent
- $1,916 high interval (Pro) →
- Mortgage (P&I)
- −$1,049
- Tax from tax record
- −$158 /mo · $1,897/yr
- Insurance
- −$83
- HOA
- −$0
- Vacancy / Maint / Mgmt
- −$402
- Net cashflow
- $223
Break-even live
UW: 25.0% down · 7.5% · 30yr · 1.5% tax · 5.0% vac · 8.0% maint · 8.0% mgmt
Financing live
Cash to close
- Down payment
- $49,988
- Closing costs
- $5,998
- Reserves months
- —
- Total cash needed
- —
Loan-product check · same deal, 3 products live
Conventional
25% down · 7.5% · 30yr
- Down + closing
- —
- Monthly P&I
- —
- Monthly cashflow
- —
- DSCR
- —
- Eligible?
- —
Personal DTI + credit; lowest rate.
DSCR
20% down · 8.5% · 30yr
- Down + closing
- —
- Monthly P&I
- —
- Monthly cashflow
- —
- DSCR
- —
- Eligible?
- —
No personal income docs; deal must DSCR.
Hard money
10% down · 12.0% · 12mo
- Down + closing
- —
- Monthly P&I
- —
- Monthly cashflow
- —
- DSCR
- —
- Eligible?
- —
Short-term bridge; refi at stabilization.
Rent comps 8 comps
| Address | Beds | Baths | Sqft | Rent | $/sqft | DOM | Units | Dist |
|---|---|---|---|---|---|---|---|---|
| 118 N Linden Ave Henrico, VA | 3.0 | 1.5 | 1080 | $1,795 | $1.66 | 43d | 1 | 0.36mi |
| 205 Bridge St Henrico, VA | 3.0 | 2.0 | 1242 | $1,850 | $1.49 | 10d | 1 | 0.37mi |
| 5 N Oak Ave Henrico, VA | 2.0 | 1.0 | 1524 | $1,895 | $1.24 | 17d | 1 | 0.51mi |
| 5951 Tiger Lily Ln Richmond, VA | 2.0–3.0 | 2.0 | 1080 | $1,592 | $1.47 | 1d | 12 | 0.82mi |
| 120 Barker Ave Richmond, VA | 3.0 | 1.0 | 1064 | $1,597 | $1.50 | 3d | 1 | 0.91mi |
| 339 E Jerald St Henrico, VA | 3.0 | 1.5 | 1160 | $1,950 | $1.68 | 43d | 1 | 0.92mi |
| 6001 Yates Ln Richmond, VA | 4.0 | 1.5 | 1556 | $2,450 | $1.57 | 1d | 1 | 1.28mi |
| 419 Roxana Rd Henrico, VA | 3.0 | 1.5 | 1085 | $2,050 | $1.89 | 3d | 1 | 1.29mi |
Listing history 15 events
-
2026-03-16status Pending
-
2026-03-10status Active
-
2026-03-06status Pending
-
2026-02-25$199,950 Active
-
2009-03-03soldstatus $105,900 309-char remark
Show marketing remark (309 chars)
Impressed designs in block surrounding porch and upstairs window. Hardwood floors throughout downstairs except for ceramic tile in bathroom and kitchen. This house has all the decorative archways, door transoms, cornices and original newel posts of a historic arts and crafts house. Foreclosure, sold 'as is'.
-
2009-01-05$104,900 309-char remark
Show marketing remark (309 chars)
Impressed designs in block surrounding porch and upstairs window. Hardwood floors throughout downstairs except for ceramic tile in bathroom and kitchen. This house has all the decorative archways, door transoms, cornices and original newel posts of a historic arts and crafts house. Foreclosure, sold 'as is'.
-
2006-06-30soldstatus $150,000
-
2006-06-30soldstatus $150,000
-
2006-06-30soldstatus $150,000
-
2006-04-13$152,950
-
2006-04-13$152,950
-
1994-05-01soldstatus $48,677
-
1993-11-01soldstatus $62,000
ⓘ Source: listings_history table (triggers on properties + properties_extension) + one-shot
backfill from property_details.listing_events for pre-trigger history.
Tax reassessment forecast VA · Resets to sale price
- Current annual tax
- $1,897 · $158/mo
- Projected year-2 tax
- $1,897 · $158/mo
- Expected delta
- $0/yr ($0/mo · 0.0%)
ⓘ Screening estimate from a state-policy table — verify with the county assessor before closing.
Climate risk First Street
- Flood 1/10 Low FEMA zone X (unshaded) · 0% chance over 30 yrs
- Wildfire 2/10 Low
- Heat 8/10 Severe 7 d/yr ≥106°F today · 17 d/yr by 30 yrs out
- Wind 6/10 Major 27% chance of damaging wind over 30 yrs
- Air quality 2/10 Low 1 unhealthy d/yr today · 2 by 30 yrs out
Nearby sold comps map
Loading sold comps map…
Walkable amenities ~0.75 mi
Loading nearby amenities…
Taxation est. · year 1
- Rental income
- $22,988
- − Mortgage interest
- −$11,200
- − Property taxes
- −$1,897
- − Insurance
- −$1,000
- − Repairs & maintenance
- −$1,839
- − Management
- −$1,839
- − Depreciation
- −$5,817
- Taxable loss
- −$604
- Est. tax savings @ 24.0%
- +$145
- After-tax cash flow
- $2,826/yr
For passive investors: Depreciation is non-cash, so a rental often shows a tax loss while cash-flowing — sheltering income. Rental losses are passive: they offset passive income freely, and up to $25,000/yr can offset ordinary (W-2) income if you actively participate and your MAGI is under $100k (phasing out to $0 by $150k); unused losses carry forward. On sale, claimed depreciation is recaptured at up to 25%, and gains may owe capital-gains tax (a 1031 exchange can defer both). Figures are a year-1 estimate at your 24.0% rate — not tax advice; consult a CPA.
Schools (NCES district)
- District
- Henrico County Public School District
- NCES district ID
- 5101890
- Math proficiency
- 49% ▼ -32.00%
- Reading proficiency
- 64% ▼ -12.00%
- Median HH income
- $61,854
- Composite
- 49.25/100
- National rank
- #2031
- State rank
- #68 of 131 in VA
Livability — Highland Springs
- Score
- 72/100
- State rank
- #196
- US rank
- #6085
Category grades
Schools grade is shown separately in the Schools card above.
Census & demographics
- Census place
- Highland Springs, VA
- County
- Henrico County · 334,490 people
- City population
- 8,347
- Metro
- Richmond, VA
- Population (ZIP)
- 8,347
- Household income
- $55,567
- Rent vs Own
- Severe rent burden
- 283.0
Population outlook (Henrico County) Hauer SSP2
- Today (2025)
- 365,885 people
- By 2030
- 384,255 · +5.0%
- By 2040
- 416,688 · +13.9%
- By 2050
- 442,376 · +20.9%
- By 2075
- 488,037 · +33.4%
- By 2100
- 487,430 · +33.2%
Race, ethnicity, and origin ACS 2023
- Neighborhood character
- Majority Black (62%)
- Race & ethnicity
- Black 62% White 29% Two or more races 6% Hispanic / Latino 2%
- Common ancestry
- Slovak 2% Lithuanian 1% Romanian 1%
- Foreign-born
- 7% · Canada
- Languages at home
- 97% English-only · French/Haitian/Cajun 2% Spanish 1%
Political lean MEDSL · Henrico
- 2024 margin
- Strong D (+28.9) · D 63.7% · R 34.8% · Other 1.5%
- 2008→2024 swing
- +16.6pp toward D · 2008: 12.2pp · 2024: 28.9pp
- All cycles
- 2024: D+28.9 2020: D+29.0 2016: D+21.0 2012: D+11.7 2008: D+12.2
Not yet ingested
- Civics
- —
Market trends
- HPI YoY
- ▼ -72.15%
- Current HPI
- 458.732
- Rent YoY
- —
- Metro
- Richmond, VA
- State GDP YoY
- ▲ 2.40%
- F500 in state
- 50
Industry mix (Fortune 500 HQ in VA)
| Industry | F500 HQs | Revenue |
|---|---|---|
| Aerospace / Defense | 4 | $236B |
|
||
| Technology / Defense | 3 | $32B |
|
||
| Financial Services | 2 | $176B |
|
||
| Utilities | 2 | $27B |
|
||
| Insurance | 2 | $25B |
|
||
| Technology | 2 | $15B |
|
||
Price history
+222.5% since first listed15 events — show timeline
- 2026-03-16 Pending — CVRMLS
- 2026-03-10 Relisted — CVRMLS
- 2026-03-06 Pending — CVRMLS
- 2026-02-25 Listed $199,950 CVRMLS
- 2009-03-03 Sold (MLS) $105,900 CVRMLS
- 2009-03-03 Sold (MLS) $105,900 CVRMLS
- 2009-01-05 Listed $104,900 CVRMLS
- 2009-01-05 Listed $104,900 CVRMLS
- 2006-06-30 Sold (Public Records) $150,000 Public Records
- 2006-06-30 Sold (MLS) $150,000 CVRMLS
- 2006-06-30 Sold (MLS) $150,000 CVRMLS
- 2006-04-13 Listed $152,950 CVRMLS
- 2006-04-13 Listed $152,950 CVRMLS
- 1994-05-01 Sold (Public Records) $48,677 Public Records
- 1993-11-01 Sold (Public Records) $62,000 Public Records
Property tax history
+5.9%/yrLatest (2025): $1,897 · +8.3% YoY. Source: county tax records.
Cash-flow waterfall
monthlySold comps — $/sqft
last 12 mo · ≤1 miLoading sold comps…