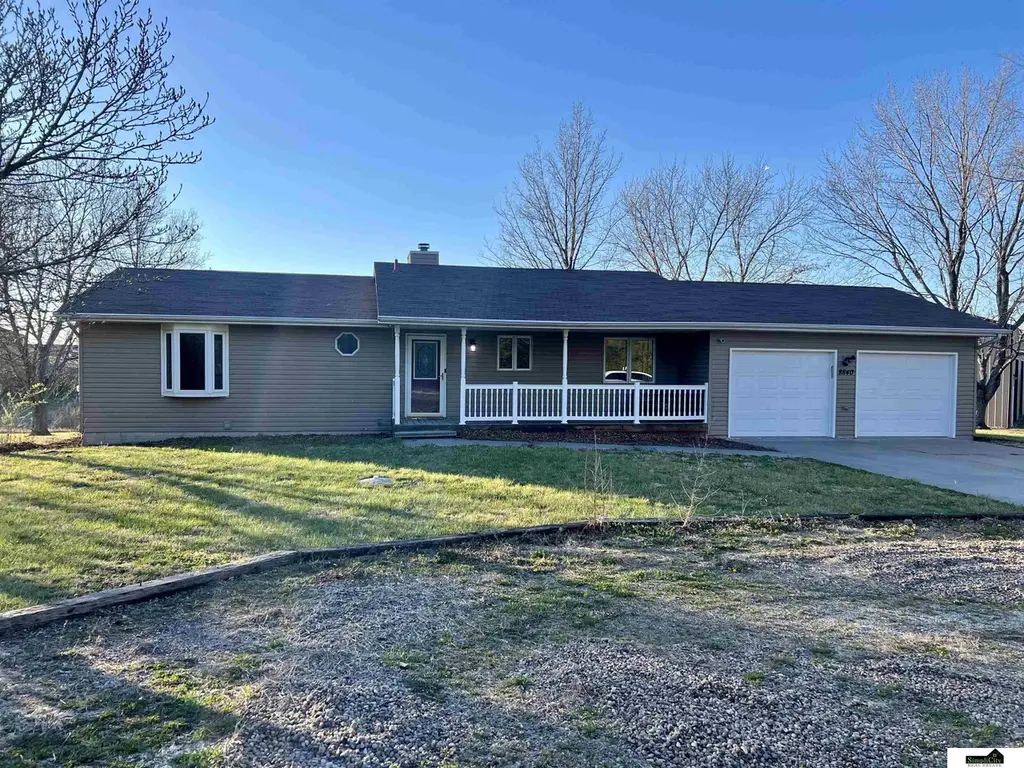
8840 Holdrege St · Lincoln, NE
Flood risk 1/10 · Minimal
- FEMA flood zone
- X (unshaded)
- Chance of flooding over 30 yrs
- 0.0%
- Est. flood insurance / yr
- $473 – $860
Fire risk 2/10 · Minimal
- Est. fire insurance / yr
- $1,161 – $2,155
Heat risk 3/10 · Minor
- Hot days now (above 104°F)
- 7 days/yr
- Hot days in 30 yrs
- 16 days/yr
Wind risk 2/10 · Minimal
- Chance of severe wind over 30 yrs
- —
Air-quality risk 1/10 · Minimal
- Unhealthy air days now
- 0 days/yr
- Unhealthy air days in 30 yrs
- 0 days/yr
Risk factors via First Street. Map © Google.
Why this score? — see what drove the D+ grade
The composite is a weighted blend of 9 inputs, each scored 0–100. Each bar is that input's sub-score; the figure is the points it added to the 100-point composite (weight × sub-score).
- Cash flow +15.0/30.0
- ARV discount +7.5/15.0
- 1% rule +5.0/10.0
- DSCR +5.0/10.0
- Schools +4.8/10.0
- Livability +4.2/5.0
- Rent growth +3.5/5.0
- Condition / age +2.5/5.0
- Appreciation +0.0/10.0
$25,000
🖨 Deal sheet 📄 Offer letter ✓ Due diligence
Listing remarks
* HOUSE ONLY – MUST BE MOVED - NO LAND INCLUDED * Please read full listing before inquiring. Excellent opportunity for investors or buyers who already own land and are ready to take on a relocation project! This 3-bed, 2-bath 1250 sq ft home MUST BE RELOCATED from the seller’s property. The property includes all existing fixtures, appliances & HVAC system and is being SOLD AS-IS. Due to the nature of the sale, cash only sale. Buyer is fully responsible for all aspects of the relocation process, including but not limited to: Securing permits, Coordinating transportation logistics and Managing any required street closures. The home offers a functional layout featuring a 2-s
Key facts
- 2 garage spots
- Built 1990
- Listed 19 days
Property features AI
Exterior
- Parking: Attached garage with 2 covered spaces (2 total parking)
- Utilities: No public sewer
- Home design: Single-family residence; Residential property; Not new / not a model; One-story (main floor living); Built in 1990
- Construction: Concrete perimeter foundation
- Exterior features: Porch; Deck
Interior
- Bedrooms: Master bedroom on the main floor; Second bedroom on the main floor; Third bedroom on the main floor
- Bathrooms: Two bathrooms total: one full and one three-quarter, both on the main level
- Heating & cooling: Electric forced-air heating; Central air conditioning
- Interior features: Fireplace (1)
Neighborhood map
What this means for you Summary
Snapshot
- This is a 3-bed/2.0-bath single-family listed at $25k.
Deal economics
- At list price, monthly cash flow is $1k ($15k/yr) — positive.
- The deal already cash-flows at list — no discount required.
- Meets the 1% rule at list price ($2k rent vs $25k).
- Recommended offer: $25k (1.5% below list) — sets the bar for market timing.
- Cap rate 66.5% vs local median 3.0% in Lincoln — top-decile yield for the area; either an underpriced asset or a hidden risk that comps aren't pricing in. Stress-test before assuming the spread holds.
Location & tenants
- Location reads 85/100 on livability (#5 in NE, #545 nationally) — a professional / high-income tenant draw. Strengths: amenities A+, cost of living A+, housing A+; Watch: crime D+.
- Waverly School District 145 (rural): math 54% / reading 52% proficiency, ranked #31 of 111 in NE (top 28%) — acceptable for families but not a draw, mixed tenant base, ~2y average lease; only 14% free/reduced lunch — higher-income household profile.
- Zoned schools: Evelyn Hamlow Elementary (316 students, 16% FRL); Waverly Middle School (math 51% / reading 48%, grade C, #51 of 128 statewide, top 43%, 532 students, 20% FRL); Waverly High School (math 57% / reading 47%, grade D+, #98 of 261 statewide, top 40%, 682 students, 19% FRL) — zoned schools at 18% FRL track the district average.
- Market conditions: Rents rising (+3.8%/yr); 78 active listings in the ZIP; 8 comparable units currently listed for rent nearby; rentals leasing fast (median 14d on market — plan ~1-2 weeks tenant-placement turnaround); solid renter incomes; 1,940 units permitted in Lancaster County in 2024 (895 in 5+ unit buildings).
Forward outlook
- Local home prices are declining (-3.0%/yr); year-one equity from $173 of loan paydown is wiped out by about $750 of value loss. Plan a longer hold.
- Lancaster County population projected at +37% by 2050 — long-run rental-demand tailwind backs the buy-and-hold thesis.
- At projected returns (-3.0% appreciation + 3.8% rent growth), your $7k cash investment doubles in ~1 year — after that, you're playing with house money.
Negotiation context
- It's been on market 19 days — a 2% lower offer ($25k) is reasonable based on typical stale-listing flexibility.
- 3 sale attempts; this cycle's ask has dropped $10k (29%) from the opening price — seller is motivated, your offer sets the floor, not the list.
Questions for the listing agent
- Is there a deadline driving the sale (1031 exchange, divorce, estate, relocation)? That informs how much negotiation room exists.
- Schools are A-rated — typically a magnet for longer-tenancy family renters. What's the average tenant stay here, and is there a school-zone premium baked into asking?
- Crime grade is D in this area — have there been break-ins, vandalism, or insurance claims at this property in the last 3 years? What carrier currently insures it and at what premium?
- The area grade is low — what's the realistic commute time and amenity access for the typical tenant pool here? Any planned neighborhood developments (good or bad) we should know about?
- What's the average days-on-market for RENTAL listings here right now (not sales)? A rising rental-DOM trend means longer vacancies and softer asking-rent achievability than the comps imply.
- What's the recent tenant-quality profile in this submarket — average credit score on applications, eviction rate, late-payment / NSF rate, and stable-employment percentage? A property-management company in the area should have these aggregated.
- How much new for-sale + rental construction is in the pipeline within 1–3 miles? Heavy new supply typically softens prices + rents 12–24 months out; constrained supply supports both.
Investment metrics
- 1% rule
- 7.22% ✓
- Cap rate
- 66.49%
- Cash-on-cash
- 214.99%
- DSCR
- 10.57
- GRM
- 1.2
CMA / ARV
- ARV (median comp)
- $344,149
- List price
- $25,000
- Delta
- -89.83%
- Verdict
- UNDERPRICED
- Comps
- 19 within 1.0 mi
Show comp detail 12 sales within ~0.75 mi
| Address | Dist | Beds/Ba | Sqft | Sold | Price | $/sf | Match |
|---|---|---|---|---|---|---|---|
| 2660 N 91st St | 0.56mi | 3/3.0 | 1,758 (-5%) | 1mo | $413,199 | $235 | 61 |
| 9040 Garland St | 0.27mi | 3/2.5 | 1,617 (-12%) | 7mo | $355,000 | $220 | 59 |
| 8321 Elizabeth Dr | 0.68mi | 3/2.0 | 1,754 (-5%) | 1mo | $260,000 | $148 | 59 |
| 2833 N 90th St | 0.64mi | 3/3.5 | 1,928 (+4%) | 1mo | $431,000 | $224 | 56 |
| 2827 N 90th St | 0.64mi | 3/3.0 | 1,980 (+7%) | 1mo | $422,125 | $213 | 53 |
| 9001 Kinzie St | 0.55mi | 3/3.0 | 1,946 (+5%) | 11mo | $370,871 | $191 | 52 |
| 927 N 86th St | 0.67mi | 3/3.0 | 1,952 (+6%) | 6mo | $322,500 | $165 | 50 |
| 8928 Kinzie St | 0.57mi | 4/3.0 (+1) | 1,916 (+4%) | 10mo | $481,740 | $251 | 50 |
| 8760 Garland St | 0.25mi | 3/3.5 | 2,108 (+14%) | 13mo | $349,900 | $166 | 48 |
| 7959 Medicine Hat Rd | 0.68mi | 4/3.0 (+1) | 2,015 (+9%) | 9mo | $390,000 | $194 | 37 |
| 803 N 86th St | 0.73mi | 4/2.5 (+1) | 2,088 (+13%) | 1mo | $331,000 | $159 | 36 |
| 2720 N 89th St | 0.58mi | 3/3.5 | 2,078 (+12%) | 12mo | $404,769 | $195 | 36 |
Match score weights: distance 35% · size 25% · config 20% · recency 20%. Top-matched comps best support the ARV.
Projected returns pro-forma
-3.0% appreciation · 3.81% rent growth · sell at horizon
- IRR
- —
- Equity multiple
- 12.05×
- Total profit
- $77,336
- Equity at exit
- $3,728
- IRR
- —
- Equity multiple
- 26.21×
- Total profit
- $176,496
- Equity at exit
- $2,162
Cash invested: $7,000 (down + closing). Projections, not guarantees.
Landlord ↔ Tenant lean methodology
- Overall (STATE)
- 83 Strongly Landlord-Friendly
- State Nebraska
- 83 Strongly Landlord-Friendly · R+13
- County
- — inherits STATE
- City
- — inherits STATE
ZIP-level market 68505
- Rents YoY
- 3.8%
- Active inventory
- 78
- Price-to-rent
- 1.2×
Monthly cashflow live
- Estimated rent
- $1,806 high interval (Pro) →
- Mortgage (P&I)
- −$131
- Tax est. 1.5%
- −$31 /mo · $375/yr
- Insurance
- −$10
- HOA
- −$0
- Vacancy / Maint / Mgmt
- −$379
- Net cashflow
- $1,254
Break-even live
UW: 25.0% down · 7.5% · 30yr · 1.5% tax · 5.0% vac · 8.0% maint · 8.0% mgmt
Financing live
Cash to close
- Down payment
- $6,250
- Closing costs
- $750
- Reserves months
- —
- Total cash needed
- —
Loan-product check · same deal, 3 products live
Conventional
25% down · 7.5% · 30yr
- Down + closing
- —
- Monthly P&I
- —
- Monthly cashflow
- —
- DSCR
- —
- Eligible?
- —
Personal DTI + credit; lowest rate.
DSCR
20% down · 8.5% · 30yr
- Down + closing
- —
- Monthly P&I
- —
- Monthly cashflow
- —
- DSCR
- —
- Eligible?
- —
No personal income docs; deal must DSCR.
Hard money
10% down · 12.0% · 12mo
- Down + closing
- —
- Monthly P&I
- —
- Monthly cashflow
- —
- DSCR
- —
- Eligible?
- —
Short-term bridge; refi at stabilization.
Rent comps 8 comps
| Address | Beds | Baths | Sqft | Rent | $/sqft | DOM | Units | Dist |
|---|---|---|---|---|---|---|---|---|
| 1436 Cedar Cove Rd Unit 1 Lincoln, NE | 3.0 | 2.5 | 1739 | $2,000 | $1.15 | 44d | 1 | 0.32mi |
| 8600 Leighton Ave Lincoln, NE | 1.0–3.0 | 1.0–2.0 | 1144 | $1,300 | $1.14 | 1d | 1 | 0.36mi |
| 1648 Sawyer St Lincoln, NE | 3.0 | 2.5 | 1547 | $1,899 | $1.23 | 44d | 1 | 0.49mi |
| 8229 Northwoods Dr Lincoln, NE | 1.0–2.0 | 1.0–2.0 | 935 | $1,649 | $1.76 | 3d | 5 | 0.56mi |
| 9411 Adams St Unit 9411-08 Lincoln, NE | 2.0 | 2.5 | 1240 | $1,745 | $1.41 | 44d | 1 | 0.91mi |
| 9411 Adams St Lincoln, NE | 1.0–2.0 | 1.0–2.5 | 1066 | $1,745 | $1.64 | 1d | 1 | 0.91mi |
| 111 S 90th St Lincoln, NE | 3.0 | 1.0–2.0 | 976 | $2,175 | $2.23 | 13d | 22 | 1.25mi |
| 8430 Fremont St Lincoln, NE | 1.0–3.0 | 1.0–2.0 | 1050 | $2,380 | $2.27 | 1d | 22 | 1.37mi |
Listing history 19 events
-
2026-06-18days on market $25,000 Active 19 DOM
-
2026-06-17days on market $25,000 Active 18 DOM
-
2026-06-16days on market $25,000 Active 17 DOM
-
2026-06-15days on market $25,000 Active 16 DOM
-
2026-06-14days on market $25,000 Active 14 DOM
-
2026-06-13days on market $25,000 Active 13 DOM
-
2026-06-10days on market $25,000 Active 11 DOM
-
2026-06-09days on market $25,000 Active 10 DOM
-
2026-06-08days on market $25,000 Active 9 DOM
-
2026-06-07statusdays on market $25,000 Active 8 DOM
-
2026-06-03days on market $25,000 New 4 DOM
-
2026-06-02days on market $25,000 New 3 DOM
-
2026-06-01days on market $25,000 New 2 DOM
-
2026-05-31pricestatusdays on market $25,000 New 1 DOM
-
2026-05-30days on market $35,000 Active 33 DOM
-
2026-04-27$35,000 New 991-char remark
-
2026-04-27historical
-
2026-04-06$35,000 New
-
2024-02-27soldstatus $470,000
ⓘ Source: listings_history table (triggers on properties + properties_extension) + one-shot
backfill from property_details.listing_events for pre-trigger history.
Climate risk First Street
- Flood 1/10 Low FEMA zone X (unshaded) · 0% chance over 30 yrs
- Wildfire 2/10 Low
- Heat 3/10 Moderate 7 d/yr ≥104°F today · 16 d/yr by 30 yrs out
- Wind 2/10 Low
- Air quality 1/10 Low 0 unhealthy d/yr today · 0 by 30 yrs out
Nearby sold comps map
Loading sold comps map…
Walkable amenities ~0.75 mi
Loading nearby amenities…
Taxation est. · year 1
- Rental income
- $21,674
- − Mortgage interest
- −$1,400
- − Property taxes
- −$375
- − Insurance
- −$125
- − Repairs & maintenance
- −$1,734
- − Management
- −$1,734
- − Depreciation
- −$727
- Taxable income
- $15,579
- Est. tax owed @ 24.0%
- −$3,739
- After-tax cash flow
- $11,311/yr
For passive investors: Depreciation is non-cash, so a rental often shows a tax loss while cash-flowing — sheltering income. Rental losses are passive: they offset passive income freely, and up to $25,000/yr can offset ordinary (W-2) income if you actively participate and your MAGI is under $100k (phasing out to $0 by $150k); unused losses carry forward. On sale, claimed depreciation is recaptured at up to 25%, and gains may owe capital-gains tax (a 1031 exchange can defer both). Figures are a year-1 estimate at your 24.0% rate — not tax advice; consult a CPA.
Schools (NCES district)
- District
- Waverly School District 145
- NCES district ID
- 3100021
- Math proficiency
- 54% ▼ -4.00%
- Reading proficiency
- 52% ▬ 0.00%
- Median HH income
- $81,839
- Composite
- 48.33/100
- National rank
- #2148
- State rank
- #31 of 111 in NE
Livability — Lincoln
- Score
- 85/100
- State rank
- #5
- US rank
- #545
Category grades
Schools grade is shown separately in the Schools card above.
Census & demographics
- County
- Lancaster County · 291,509 people
- City population
- 291,509
- Metro
- Lincoln, NE
- Population (ZIP)
- 18,834
- Household income
- $75,980
- Rent vs Own
- Severe rent burden
- 436.0
Population outlook (Lancaster County) Hauer SSP2
- Today (2025)
- 352,806 people
- By 2030
- 377,899 · +7.1%
- By 2040
- 428,582 · +21.5%
- By 2050
- 483,103 · +36.9%
- By 2075
- 632,390 · +79.2%
- By 2100
- 759,513 · +115.3%
Race, ethnicity, and origin ACS 2023
- Neighborhood character
- Predominantly White (82%)
- Race & ethnicity
- White 82% Two or more races 7% Hispanic / Latino 6% Asian 4% Black 3% Native American 1%
- Hispanic origin (detail)
- Mexican 4%
- Common ancestry
- Romanian 2% Lithuanian 2% Iranian 1%
- Foreign-born
- 7% · Canada, Vietnam, China
- Languages at home
- 89% English-only · Spanish 3% Arabic 2% Vietnamese 2%
Political lean MEDSL · Lancaster
- 2024 margin
- Toss-up / Even · D 51.4% · R 47.1% · Other 1.5%
- 2008→2024 swing
- -0.7pp no change · 2008: 5.0pp · 2024: 4.3pp
- All cycles
- 2024: D+4.3 2020: D+7.8 2016: D+0.1 2012: R+1.0 2008: D+5.0
Not yet ingested
- Civics
- —
Market trends
- HPI YoY
- ▼ -160.23%
- Current HPI
- 246.1127
- Rent YoY
- ▲ 3.81%
- Metro
- Lincoln, NE
- State GDP YoY
- ▲ 0.68%
- F500 in state
- 2
Industry mix (Fortune 500 HQ in NE)
| Industry | F500 HQs | Revenue |
|---|---|---|
| Conglomerate | 1 | $371B |
|
||
Price history
-92.6% since first listed6 events — show timeline
- 2026-05-30 Listing Removed — GPRMLS
- 2026-04-27 Listing Removed — GPRMLS
- 2026-04-27 Listed $35,000 GPRMLS
- 2026-04-06 Listed $35,000 GPRMLS
- 2026-04-06 Listed $25,000 GPRMLS
- 2024-02-27 Sold (Public Records) $470,000 Public Records
Property tax history
-1.2%/yrLatest (2025): $3,779 · -0.1% YoY. Source: county tax records.
Cash-flow waterfall
monthlySold comps — $/sqft
last 12 mo · ≤1 miLoading sold comps…