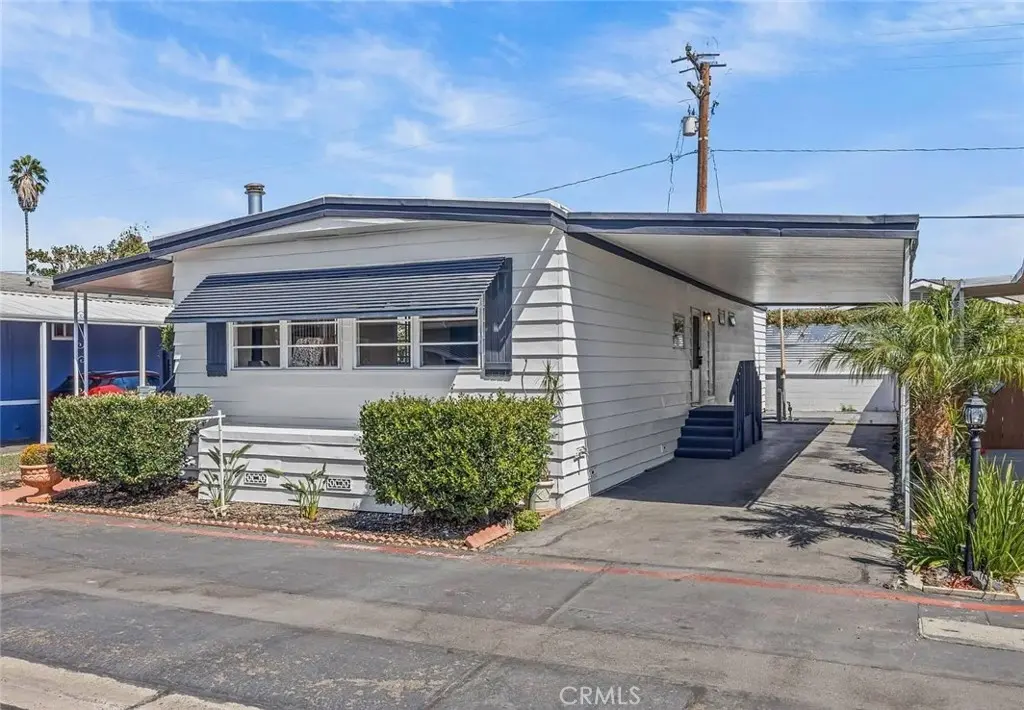
16444 Bolsa Chica #26 · Huntington Beach, CA
Flood risk 1/10 · Minimal
- FEMA flood zone
- X (shaded)
- Chance of flooding over 30 yrs
- 0.0%
- Est. flood insurance / yr
- $507 – $1,088
Fire risk 4/10 · Minor
- Est. fire insurance / yr
- $659 – $1,223
Heat risk 5/10 · Moderate
- Hot days now (above 85°F)
- 7 days/yr
- Hot days in 30 yrs
- 22 days/yr
Wind risk 1/10 · Minimal
- Chance of severe wind over 30 yrs
- —
Air-quality risk 4/10 · Minor
- Unhealthy air days now
- 5 days/yr
- Unhealthy air days in 30 yrs
- 7 days/yr
Risk factors via First Street. Map © Google.
Why this score? — see what drove the C+ grade
The composite is a weighted blend of 9 inputs, each scored 0–100. Each bar is that input's sub-score; the figure is the points it added to the 100-point composite (weight × sub-score).
- Cash flow +30.0/30.0
- 1% rule +10.0/10.0
- DSCR +10.0/10.0
- Schools +5.5/10.0
- Livability +3.4/5.0
- Rent growth +3.0/5.0
- Condition / age +2.5/5.0
- ARV discount +0.1/15.0
- Appreciation +0.0/10.0
$169,900
🖨 Deal sheet 📄 Offer letter ✓ Due diligence
Listing remarks MLS
Senior Park 55+/35+ 2295.00 space rent 2 bed 2 bath, 4 year old roof and furnace Newer Piers and Recent Leveling Serial #s0626XX/U
Key facts
- Upgraded baths
- Community amenities
- Open layout
Tags
Property features AI
Finance
- Other: Manager approval required for the park; Pets allowed (dogs and cats allowed with size and number limits)
- Financial info: Land lease applies
- HOA & community: Senior community; Park name: Scandia Country Club
Exterior
- Parking: Carport (2 spaces); 1-car garage; Total of 3 parking spaces; Has parking
- Utilities: Standard electric service; Natural gas connected; Sewer connected (private sewer); Water connected (district/public); Electricity connected
- Home design: Mobile home (20' x 50') remains on site; Double body type; Single-story; Entry at street level; Access via paved city streets; Located in Scandia Country Club (senior community, urban setting)
- Construction: Vinyl siding; Drywall walls; Asphalt roof; Pillar/post/pier foundation; Year built per public records
- Exterior features: Covered and screened front porch; Front porch and additional porch areas; Enclosed glass porch; Enclosed patio; Open patio; Deck; Has patio; Community pool
Interior
- Kitchen: Kitchen open to family room; Kitchen island; Quartz counters; Pots & pan drawers; Self-closing cabinet doors and drawers; Remodeled kitchen; Garbage disposal; Microwave; Self-cleaning oven; Free-standing range; Ice maker; Water line to refrigerator; Dishwasher
- Bedrooms: Primary bedroom on main floor; All bedrooms on main floor; Primary suite
- Flooring: Vinyl flooring
- Bathrooms: Remodeled bathrooms; Quartz counters in bathrooms; Shower; Shower in tub; Bathtub; Exhaust fan(s); Vanity area
- Heating & cooling: Central furnace; Fireplace (heating source)
- Interior features: Quartz counters throughout; Built-in storage; Ceiling fan; Living room deck attached; Recessed lighting; Open floor plan; Bay window; Sliding glass door(s); One level (single-story); Community spa
- Laundry & utility: Washer hookup; Has laundry
Neighborhood map
What this means for you Summary
Snapshot
- This is a 2-bed/2.0-bath manufactured listed at $170k.
Deal economics
- At list price, monthly cash flow is $1k ($15k/yr) — positive.
- The deal already cash-flows at list — no discount required.
- Meets the 1% rule at list price ($3k rent vs $170k).
- Recommended offer: $160k (6.0% below list) — sets the bar for market timing.
- Cap rate 15.3% vs local median 1.6% in Huntington Beach — top-decile yield for the area; either an underpriced asset or a hidden risk that comps aren't pricing in. Stress-test before assuming the spread holds.
Location & tenants
- Location reads 67/100 on livability (#306 in CA) — a middle-class / working-renter tenant base. Strengths: employment A+, commute A-, schools B+; Watch: amenities C-, cost of living F, health & safety F.
- Ocean View (suburban): math 57% / reading 63% proficiency, ranked #207 of 1,400 in CA (top 15%) — acceptable for families but not a draw, mixed tenant base, ~2y average lease.
- Market conditions: Rents rising (+2.2%/yr); 83 active listings in the ZIP; 40 comparable units currently listed for rent nearby; rentals leasing fast (median 3d on market — plan ~1-2 weeks tenant-placement turnaround); high-income renter base; 6,974 units permitted in Orange County in 2024 (3,839 in 5+ unit buildings).
- This rent runs 30% of the median local income ($123k/yr) — at the standard rent-burdened threshold; future hikes will face affordability resistance.
Forward outlook
- Local home prices are declining (-3.0%/yr); year-one equity from $1k of loan paydown is wiped out by about $5k of value loss. Plan a longer hold.
- Orange County population projected at +14% by 2050 — modest demand growth; plan on rents tracking national, not racing it.
- At projected returns (-3.0% appreciation + 2.2% rent growth), your $48k cash investment doubles in ~4 years — after that, you're playing with house money.
Negotiation context
- It's been on market 62 days — a 6% lower offer ($160k) is reasonable based on typical stale-listing flexibility.
- 4 sale attempts since 3y ago with the ask held roughly flat each time — persistent listings suggest the price (not the market) is what's stuck; bring a comps-based counter.
- Current owner paid $45k; list at $170k implies a 278% gain — meaningful room to come down on a strong offer.
Risks & watch-outs
- Climate carrying-cost: extreme-heat days projected 7→22/yr by 2055 (HVAC capex compounding) — expect insurance premiums to compound above CPI over the hold.
Questions for the listing agent
- It's been on market 62 days. Have you received any prior offers? Is the seller open to a 6% concession, seller financing, or rate buy-down credit?
- Built in 1966 — when were the roof, HVAC, electrical panel, plumbing, and water heater last replaced?
- Why hasn't it sold? Are there any deal-killer items the seller is aware of (foundation, flood, title, zoning, code violations)?
- Is there a deadline driving the sale (1031 exchange, divorce, estate, relocation)? That informs how much negotiation room exists.
- Schools are B-rated — typically a magnet for longer-tenancy family renters. What's the average tenant stay here, and is there a school-zone premium baked into asking?
- What's the average days-on-market for RENTAL listings here right now (not sales)? A rising rental-DOM trend means longer vacancies and softer asking-rent achievability than the comps imply.
- What's the recent tenant-quality profile in this submarket — average credit score on applications, eviction rate, late-payment / NSF rate, and stable-employment percentage? A property-management company in the area should have these aggregated.
- How much new for-sale + rental construction is in the pipeline within 1–3 miles? Heavy new supply typically softens prices + rents 12–24 months out; constrained supply supports both.
Investment metrics
- 1% rule
- 1.82% ✓
- Cap rate
- 15.29%
- Cash-on-cash
- 32.14%
- DSCR
- 2.43
- GRM
- 4.6
CMA / ARV
- ARV (on-the-fly)
- $146,000
- Comps found
- 6
Show comp detail 6 sales within ~0.75 mi
| Address | Dist | Beds/Ba | Sqft | Sold | Price | $/sf | Match |
|---|---|---|---|---|---|---|---|
| 5200 Heil Ave #8 | 0.15mi | 2/2.0 | 978 (-2%) | 7mo | $143,000 | $146 | 83 |
| 5200 Heil Ave #18 | 0.15mi | 2/2.0 | 960 (-4%) | 6mo | $160,000 | $167 | 82 |
| 5200 Heil #25 | 0.15mi | 2/2.0 | 1,040 (+4%) | 9mo | $150,000 | $144 | 79 |
| 5200 Heil Ave #7 | 0.15mi | 2/2.0 | 1,080 (+8%) | 1mo | $125,000 | $116 | 79 |
| 5200 Heil Ave #64 | 0.15mi | 2/2.0 | 1,117 (+12%) | 1mo | $250,301 | $224 | 73 |
| 5200 Heil Ave #53 | 0.18mi | 2/2.0 | 1,128 (+13%) | 10mo | $119,500 | $106 | 62 |
Match score weights: distance 35% · size 25% · config 20% · recency 20%. Top-matched comps best support the ARV.
Projected returns pro-forma
-3.0% appreciation · 2.17% rent growth · sell at horizon
- IRR
- 26.2%
- Equity multiple
- 2.07×
- Total profit
- $51,111
- Equity at exit
- $25,333
- IRR
- 33.4%
- Equity multiple
- 3.92×
- Total profit
- $138,847
- Equity at exit
- $14,690
Cash invested: $47,572 (down + closing). Projections, not guarantees.
Landlord ↔ Tenant lean methodology
- Overall (STATE)
- 18 Strongly Tenant-Friendly
- State California
- 18 Strongly Tenant-Friendly · D+13
- County
- — inherits STATE
- City
- — inherits STATE
ZIP-level market 92649
- Rents YoY
- 2.2%
- Active inventory
- 83
- Price-to-rent
- 4.6×
Monthly cashflow live
- Estimated rent
- $3,099 high interval (Pro) →
- Mortgage (P&I)
- −$891
- Tax est. 1.5%
- −$212 /mo · $2,548/yr
- Insurance
- −$71
- HOA
- −$0
- Vacancy / Maint / Mgmt
- −$651
- Net cashflow
- $1,274
Break-even live
UW: 25.0% down · 7.5% · 30yr · 1.5% tax · 5.0% vac · 8.0% maint · 8.0% mgmt
Financing live
Cash to close
- Down payment
- $42,475
- Closing costs
- $5,097
- Reserves months
- —
- Total cash needed
- —
Loan-product check · same deal, 3 products live
Conventional
25% down · 7.5% · 30yr
- Down + closing
- —
- Monthly P&I
- —
- Monthly cashflow
- —
- DSCR
- —
- Eligible?
- —
Personal DTI + credit; lowest rate.
DSCR
20% down · 8.5% · 30yr
- Down + closing
- —
- Monthly P&I
- —
- Monthly cashflow
- —
- DSCR
- —
- Eligible?
- —
No personal income docs; deal must DSCR.
Hard money
10% down · 12.0% · 12mo
- Down + closing
- —
- Monthly P&I
- —
- Monthly cashflow
- —
- DSCR
- —
- Eligible?
- —
Short-term bridge; refi at stabilization.
Rent comps 40 comps
| Address | Beds | Baths | Sqft | Rent | $/sqft | DOM | Units | Dist |
|---|---|---|---|---|---|---|---|---|
| 4901 Heil Ave Huntington Beach, CA | 1.0 | 1.0 | 675 | $2,112 | $3.13 | 1d | 4 | 0.17mi |
| 16592 Jib Cir Unit B Huntington Beach, CA | 3.0 | 2.5 | 1500 | $4,300 | $2.87 | 1d | 1 | 0.21mi |
| 4881 Vista Dr Unit 3 Huntington Beach, CA | 2.0 | 2.0 | 902 | $3,200 | $3.55 | 1d | 1 | 0.25mi |
| 5141 Cheryl Dr Huntington Beach, CA | 3.0 | 1.5 | 1120 | $4,200 | $3.75 | 16d | 1 | 0.33mi |
| 4862 Kona Dr Unit C Huntington Beach, CA | 3.0 | 2.5 | 1200 | $2,895 | $2.41 | 13d | 1 | 0.38mi |
| 4862 Kona Dr Unit C Huntington Beach, CA | 3.0 | 2.5 | 1200 | $2,895 | $2.41 | 15d | 1 | 0.38mi |
| 4862 Kona Dr Unit C Huntington Beach, CA | 3.0 | 2.5 | 1200 | $2,895 | $2.41 | 1d | 1 | 0.38mi |
| 4881 Kona Dr Unit A Huntington Beach, CA | 3.0 | 2.5 | 1300 | $3,295 | $2.53 | 10d | 1 | 0.40mi |
| 16701 Lynn Ln Apt C Huntington Beach, CA | 2.0 | 2.0 | 1000 | $2,600 | $2.60 | 10d | 1 | 0.43mi |
| 16082 Schryer Ln Huntington Beach, CA | 3.0 | 2.0 | 1214 | $8,000 | $6.59 | 2d | 1 | 0.44mi |
| 16752 Lynn Ln Apt C Huntington Beach, CA | 1.0 | 1.0 | 800 | $2,350 | $2.94 | 2d | 1 | 0.44mi |
| 16842 Hoskins Ln Unit A Huntington Beach, CA | 3.0 | 2.0 | 1072 | $3,195 | $2.98 | 2d | 1 | 0.45mi |
| 5082 Edinger Ave Huntington Beach, CA | 3.0 | 2.0 | 1278 | $4,500 | $3.52 | 1d | 1 | 0.45mi |
| 4922 Edinger Ave Huntington Beach, CA | 2.0 | 2.0 | 1000 | $2,800 | $2.80 | 10d | 1 | 0.47mi |
| 16581 Le Grande Ln Unit B Huntington Beach, CA | 1.0 | 1.0 | 700 | $2,075 | $2.96 | 1d | 1 | 0.49mi |
| 4608 Via Vista Cir #4 Huntington Beach, CA | 2.0 | 1.0 | 855 | $2,899 | $3.39 | 10d | 1 | 0.49mi |
| 4562 Heil Ave Unit 1 Huntington Beach, CA | 3.0 | 2.0 | 1250 | $3,750 | $3.00 | 2d | 1 | 0.52mi |
| 16862 Lynn Ln Apt E Huntington Beach, CA | 2.0 | 1.0 | 970 | $2,625 | $2.71 | 19d | 1 | 0.52mi |
| 16862 Lynn Ln Unit F Huntington Beach, CA | 1.0 | 1.0 | 820 | $2,195 | $2.68 | 19d | 1 | 0.52mi |
| 16872 Lynn Ln Unit 72B Huntington Beach, CA | 1.0 | 1.0 | 820 | $2,195 | $2.68 | 19d | 1 | 0.53mi |
| 16941 Hoskins Ln Apt 1 Huntington Beach, CA | 2.0 | 2.0 | 1255 | $3,000 | $2.39 | 21d | 1 | 0.56mi |
| 17052 Green Ln Huntington Beach, CA | 1.0 | 1.0 | 731 | $2,395 | $3.28 | 1d | 3 | 0.58mi |
| 16862 Coach Ln Huntington Beach, CA | 2.0 | 1.0 | 1000 | $3,500 | $3.50 | 1d | 1 | 0.59mi |
| 16682 Algonquin St Apt C Huntington Beach, CA | 2.0 | 2.0 | 800 | $2,695 | $3.37 | 10d | 1 | 0.61mi |
| 16682 Algonquin St Huntington Beach, CA | 2.0 | 2.0 | 1000 | $2,695 | $2.69 | 19d | 1 | 0.61mi |
| 5192 Robinwood Dr Huntington Beach, CA | 3.0 | 2.0 | 1232 | $5,000 | $4.06 | 1d | 1 | 0.62mi |
| 4675 Twintree Dr Huntington Beach, CA | 2.0 | 1.5 | 960 | $3,495 | $3.64 | 1d | 1 | 0.62mi |
| 4701 Warner Ave Huntington Beach, CA | 1.0–2.0 | 1.0 | 870 | $2,895 | $3.33 | 1d | 4 | 0.62mi |
| 5681 Mangrum Dr Huntington Beach, CA | 3.0 | 2.0 | 1132 | $4,995 | $4.41 | 1d | 1 | 0.72mi |
| 16700 Saybrook Ln Huntington Beach, CA | 1.0–2.0 | 1.0–2.0 | 1082 | $3,670 | $3.39 | 1d | 10 | 0.75mi |
| 5952 Par Cir Huntington Beach, CA | 3.0 | 2.0 | 1437 | $5,400 | $3.76 | 13d | 1 | 0.90mi |
| 5641 Tilburg Dr Huntington Beach, CA | 3.0 | 2.0 | 1188 | $4,495 | $3.78 | 1d | 1 | 1.03mi |
| 16102 Springdale St Huntington Beach, CA | 1.0 | 1.0 | 684 | $2,061 | $3.01 | 1d | 6 | 1.03mi |
| 17101 Springdale St Huntington Beach, CA | 1.0 | 1.0 | 780 | $2,640 | $3.38 | 1d | 1 | 1.04mi |
| 17101 Springdale St Huntington Beach, CA | 1.0 | 1.0 | 780 | $2,640 | $3.38 | 13d | 1 | 1.04mi |
| 6100 Edinger Ave Unit 509 Huntington Beach, CA | 2.0 | 2.0 | 950 | $3,500 | $3.68 | 3d | 1 | 1.11mi |
| 6100 Edinger Ave Apt 726 Huntington Beach, CA | 1.0 | 1.0 | 720 | $2,000 | $2.78 | 1d | 1 | 1.12mi |
| 6100 Edinger Ave Apt 602 Huntington Beach, CA | 2.0 | 2.0 | 950 | $2,800 | $2.95 | 1d | 1 | 1.12mi |
| 6002 Welde Cir Huntington Beach, CA | 3.0 | 2.0 | 1284 | $3,650 | $2.84 | 10d | 1 | 1.13mi |
| 6100 Edinger Ave Apt 327 Huntington Beach, CA | 1.0 | 1.0 | 720 | $2,250 | $3.12 | 1d | 1 | 1.15mi |
Listing history 27 events
-
2026-06-18days on market $169,900 Active 62 DOM
-
2026-06-17days on market $169,900 Active 61 DOM
-
2026-06-16days on market $169,900 Active 60 DOM
-
2026-06-15days on market $169,900 Active 59 DOM
-
2026-06-13days on market $169,900 Active 57 DOM
-
2026-06-13days on market $169,900 Active 56 DOM
-
2026-06-10days on market $169,900 Active 54 DOM
-
2026-06-09days on market $169,900 Active 53 DOM
-
2026-06-08days on market $169,900 Active 52 DOM
-
2026-06-07days on market $169,900 Active 51 DOM
-
2026-06-04days on market $169,900 Active 48 DOM
-
2026-06-03days on market $169,900 Active 47 DOM
-
2026-06-02days on market $169,900 Active 46 DOM
-
2026-06-01days on market $169,900 Active 45 DOM
-
2026-05-31days on market $169,900 Active 44 DOM
-
2026-05-05price $169,900
-
2026-04-27status Active
-
2026-04-26historical
-
2026-04-17$175,500 Active
-
2025-01-14historical
-
2024-11-11price $67,000
-
2024-10-03price $79,900
-
2024-07-22$89,000 Active
-
2023-06-01soldstatus $45,000 Closed Sale 133-char remark
Show marketing remark (133 chars)
Senior Park 55+/35+ 2295.00 space rent 2 bed 2 bath, 4 year old roof and furnace Newer Piers and Recent Leveling Serial #s0626XX/U
-
2023-05-05status Pending Sale 133-char remark
Show marketing remark (133 chars)
Senior Park 55+/35+ 2295.00 space rent 2 bed 2 bath, 4 year old roof and furnace Newer Piers and Recent Leveling Serial #s0626XX/U
-
2023-03-01price $49,000 133-char remark
Show marketing remark (133 chars)
Senior Park 55+/35+ 2295.00 space rent 2 bed 2 bath, 4 year old roof and furnace Newer Piers and Recent Leveling Serial #s0626XX/U
-
2023-01-23$59,000 Active 133-char remark
Show marketing remark (133 chars)
Senior Park 55+/35+ 2295.00 space rent 2 bed 2 bath, 4 year old roof and furnace Newer Piers and Recent Leveling Serial #s0626XX/U
ⓘ Source: listings_history table (triggers on properties + properties_extension) + one-shot
backfill from property_details.listing_events for pre-trigger history.
Climate risk First Street
- Flood 1/10 Low FEMA zone X (shaded) · 0% chance over 30 yrs
- Wildfire 4/10 Moderate
- Heat 5/10 Major 7 d/yr ≥85°F today · 22 d/yr by 30 yrs out
- Wind 1/10 Low
- Air quality 4/10 Moderate 5 unhealthy d/yr today · 7 by 30 yrs out
Nearby sold comps map
Loading sold comps map…
Walkable amenities ~0.75 mi
Loading nearby amenities…
Taxation est. · year 1
- Rental income
- $37,192
- − Mortgage interest
- −$9,517
- − Property taxes
- −$2,548
- − Insurance
- −$850
- − Repairs & maintenance
- −$2,975
- − Management
- −$2,975
- − Depreciation
- −$4,943
- Taxable income
- $13,384
- Est. tax owed @ 24.0%
- −$3,212
- After-tax cash flow
- $12,080/yr
For passive investors: Depreciation is non-cash, so a rental often shows a tax loss while cash-flowing — sheltering income. Rental losses are passive: they offset passive income freely, and up to $25,000/yr can offset ordinary (W-2) income if you actively participate and your MAGI is under $100k (phasing out to $0 by $150k); unused losses carry forward. On sale, claimed depreciation is recaptured at up to 25%, and gains may owe capital-gains tax (a 1031 exchange can defer both). Figures are a year-1 estimate at your 24.0% rate — not tax advice; consult a CPA.
Schools (NCES district)
- District
- Ocean View
- NCES district ID
- 0628140
- Math proficiency
- 57% ▬ 0.00%
- Reading proficiency
- 63% ▼ -1.00%
- Median HH income
- $77,469
- Composite
- 55.3/100
- National rank
- #2725
- State rank
- #207 of 1400 in CA
Livability — Huntington Beach
- Score
- 67/100
- State rank
- #306
- US rank
- #10298
Category grades
Schools grade is shown separately in the Schools card above.
Census & demographics
- Census place
- Huntington Beach, CA
- County
- Orange County · 3,096,323 people
- City population
- 194,835
- Metro
- Los Angeles-Long Beach-Anaheim, CA
- Population (ZIP)
- 35,346
- Household income
- $123,257
- Rent vs Own
- Severe rent burden
- 1504.0
Population outlook (Orange County) Hauer SSP2
- Today (2025)
- 3,477,456 people
- By 2030
- 3,613,117 · +3.9%
- By 2040
- 3,835,945 · +10.3%
- By 2050
- 3,968,736 · +14.1%
- By 2075
- 4,097,053 · +17.8%
- By 2100
- 3,903,633 · +12.3%
Race, ethnicity, and origin ACS 2023
- Neighborhood character
- Majority White (64%)
- Race & ethnicity
- White 64% Hispanic / Latino 16% Two or more races 14% Asian 10%
- Hispanic origin (detail)
- Mexican 11%
- Common ancestry
- Lithuanian 3% Italian 2% Romanian 2%
- Foreign-born
- 14% · Canada, Vietnam, China
- Languages at home
- 81% English-only · Spanish 6% Other Asian/Pacific 3% Vietnamese 2%
Political lean MEDSL · Orange
- 2024 margin
- Toss-up / Even · D 49.7% · R 47.1% · Other 3.2%
- 2008→2024 swing
- +5.2pp toward D · 2008: -2.6pp · 2024: 2.6pp
- All cycles
- 2024: D+2.6 2020: D+9.0 2016: D+7.7 2012: R+8.3 2008: R+2.6
Not yet ingested
- Civics
- —
Market trends
- HPI YoY
- ▼ -1153.55%
- Current HPI
- 330.6956
- Rent YoY
- ▲ 2.17%
- Metro
- Los Angeles-Long Beach-Anaheim, CA
- State GDP YoY
- ▲ 3.21%
- F500 in state
- 116
Industry mix (Fortune 500 HQ in CA)
| Industry | F500 HQs | Revenue |
|---|---|---|
| Technology | 27 | $1,492B |
|
||
| Financial Services | 3 | $174B |
|
||
| Retail | 3 | $44B |
|
||
| Insurance | 3 | $26B |
|
||
| Media / Entertainment | 2 | $115B |
|
||
| Pharmaceuticals / Biotech | 2 | $62B |
|
||
Price history
+188.0% since first listed12 events — show timeline
- 2026-05-05 Price Changed $169,900 CRMLS
- 2026-04-27 Relisted — CRMLS
- 2026-04-26 Listing Removed — CRMLS
- 2026-04-17 Listed $175,500 CRMLS
- 2025-01-14 Listing Removed — CRMLS
- 2024-11-11 Price Changed $67,000 CRMLS
- 2024-10-03 Price Changed $79,900 CRMLS
- 2024-07-22 Listed $89,000 CRMLS
- 2023-06-01 Sold (MLS) $45,000 CRMLS
- 2023-05-05 Pending — CRMLS
- 2023-03-01 Price Changed $49,000 CRMLS
- 2023-01-23 Listed $59,000 CRMLS
Cash-flow waterfall
monthlySold comps — $/sqft
last 12 mo · ≤1 miLoading sold comps…