 Duplex
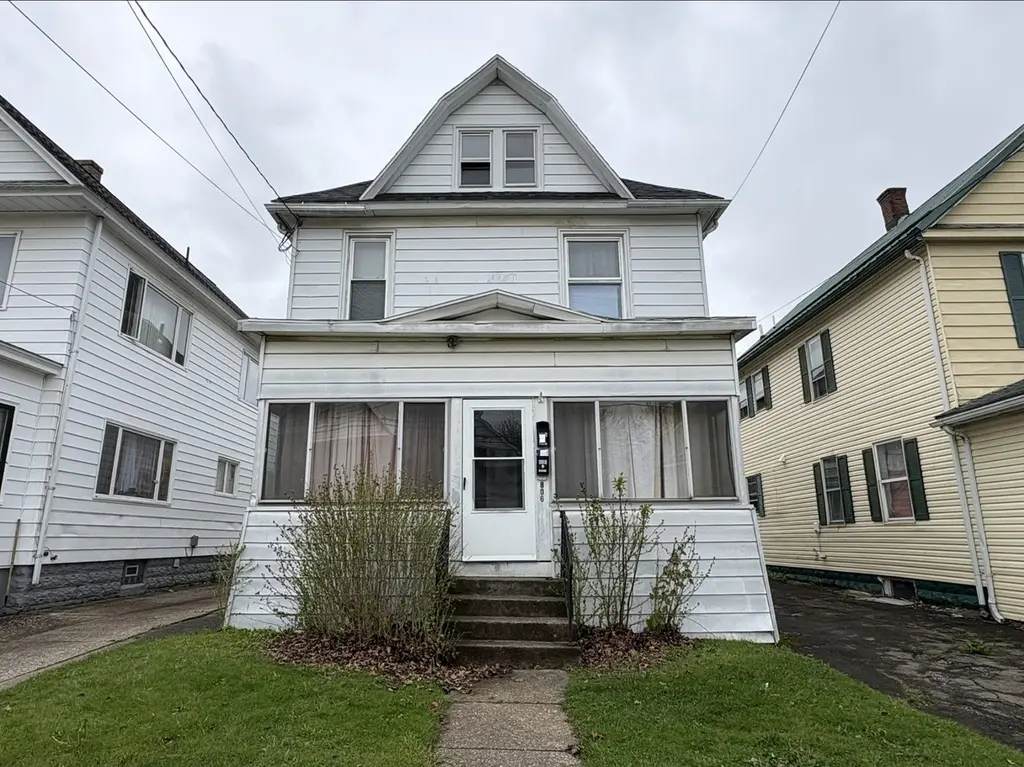
806 Hess Ave · Erie, PA
Flood risk 1/10 · Minimal
- FEMA flood zone
- X (unshaded)
- Chance of flooding over 30 yrs
- 0.0%
- Est. flood insurance / yr
- $473 – $860
Fire risk 1/10 · Minimal
- Est. fire insurance / yr
- $511 – $949
Heat risk 3/10 · Minor
- Hot days now (above 90°F)
- 7 days/yr
- Hot days in 30 yrs
- 17 days/yr
Wind risk 1/10 · Minimal
- Chance of severe wind over 30 yrs
- —
Air-quality risk 2/10 · Minimal
- Unhealthy air days now
- 1 days/yr
- Unhealthy air days in 30 yrs
- 3 days/yr
Risk factors via First Street. Map © Google.
Why this score? — see what drove the B- grade
The composite is a weighted blend of 9 inputs, each scored 0–100. Each bar is that input's sub-score; the figure is the points it added to the 100-point composite (weight × sub-score).
- Cash flow +30.0/30.0
- 1% rule +10.0/10.0
- DSCR +10.0/10.0
- Appreciation +7.9/10.0
- Livability +4.2/5.0
- Rent growth +2.5/5.0
- Condition / age +2.5/5.0
- Schools +1.3/10.0
- ARV discount +0.0/15.0
$89,900
🖨 Deal sheet 📄 Offer letter ✓ Due diligence
Multi-family units
County records classify this as Multi-Family (2-4 Unit). Listing-text estimate: 2 units. confirmed
Listing remarks MLS
Nice 2 unit . First floor remodeled in 2017 (could be for owner occupied) has new carpeting, repainted walls, new cabinets & counter tops, new doors, remodeled bath, newer windows both floors- 2006. Separate gas and electric. rewired in 2002
Key facts
- Off street parking
- Fenced yard
- 4,082 sq ft lot
Tags
Property features AI
Finance
- Financial info: Basement unit currently rents for $850; Second unit currently rents for $750
Exterior
- Parking: 2 parking spaces
- Utilities: Public water; Public sewer
- Home design: Multi-family residential property; Two-story building
- Construction: Aluminum siding; Composition roof
- Exterior features: Level lot; Paved road access
Interior
- Bedrooms: Two bedrooms in one unit; Two bedrooms in second unit
- Bathrooms: One bathroom in each unit
- Heating & cooling: Forced air heating; No central cooling
- Interior features: Basement tenant use
Neighborhood map
What this means for you Summary
Snapshot
- This is a 2 × 2-bed/1.0-bath units multifamily listed at $90k.
Deal economics
- At list price, monthly cash flow is $678 ($8k/yr) — positive. Per door: $339/mo.
- The deal already cash-flows at list — no discount required.
- Meets the 1% rule at list price ($2k rent vs $90k).
- Cap rate 15.3% vs local median 5.2% in Erie — top-decile yield for the area; either an underpriced asset or a hidden risk that comps aren't pricing in. Stress-test before assuming the spread holds.
Location & tenants
- Location reads 83/100 on livability (#109 in PA, #840 nationally) — a professional / high-income tenant draw. Strengths: amenities A+, commute A+, cost of living A+; Watch: crime D+, employment F.
- Erie City SD (urban): math 12% / reading 19% proficiency, ranked #510 of 539 in PA (top 95%) — low school quality limits family demand, transient renter base, plan for 1-2y turnover; 81% free/reduced lunch — lower-income household profile, screen leases tightly.
- Market conditions: 47 active listings in the ZIP; 3 comparable units currently listed for rent nearby; rentals lingering (median 44d on market — plan ~5-8 weeks vacancy on turnover, expect pricing pressure); 100% of comp listings sitting > 30 days — soft ceiling on asking rent; 364 units permitted in Erie County in 2024 (188 in 5+ unit buildings).
Forward outlook
- In year one you build about $6k of equity ($622 loan paydown + $5k appreciation (5.7% local appreciation)).
- Erie County population projected at -14% by 2050 — secular population decline; favor cash flow + early exit over multi-decade hold.
- At projected returns (5.7% appreciation + 3.0% rent growth), your $25k cash investment doubles in ~2 years — after that, you're playing with house money.
- By year 6, paydown + projected appreciation supports a ~$31k cash-out refi (75% LTV) — recoverable capital for the next deal without selling this one.
Negotiation context
- Only 13 days on market — expect competitive offers; lowballing is unlikely to land.
- 2 sale attempts since 8y ago with the ask held roughly flat each time — persistent listings suggest the price (not the market) is what's stuck; bring a comps-based counter.
- Current owner paid $30k; list at $90k implies a 200% gain — meaningful room to come down on a strong offer.
Risks & watch-outs
- Watch-outs: built in 1913 — expect roof / HVAC / electrical / plumbing capex.
Questions for the listing agent
- Can we see the unit-by-unit rent roll, current vacancy, and any below-market leases? What's the average tenancy length?
- What capital expenditures (roof, boiler, parking lot, exteriors) have been made in the last 5 years, and what's planned in the next 2?
- Built in 1913 — when were the roof, HVAC, electrical panel, plumbing, and water heater last replaced?
- Is there a deadline driving the sale (1031 exchange, divorce, estate, relocation)? That informs how much negotiation room exists.
- Crime grade is D in this area — have there been break-ins, vandalism, or insurance claims at this property in the last 3 years? What carrier currently insures it and at what premium?
- What's the average days-on-market for RENTAL listings here right now (not sales)? A rising rental-DOM trend means longer vacancies and softer asking-rent achievability than the comps imply.
- What's the recent tenant-quality profile in this submarket — average credit score on applications, eviction rate, late-payment / NSF rate, and stable-employment percentage? A property-management company in the area should have these aggregated.
- How much new apartment / multifamily construction is in the pipeline within 1–3 miles? Heavy new supply (>2% of stock underway) typically softens rents 12–24 months out; light construction supports rent growth.
Investment metrics
- 1% rule
- 1.84% ✓
- Cap rate
- 15.34%
- Cash-on-cash
- 32.31%
- DSCR
- 2.44
- GRM
- 4.5
CMA / ARV
- ARV (median comp)
- $71,239
- List price
- $89,900
- Delta
- 26.19%
- Verdict
- OVERPRICED
- Comps
- 20 within 1.0 mi
Show comp detail 7 sales within ~0.75 mi
| Address | Dist | Beds/Ba | Sqft | Sold | Price | $/sf | Match |
|---|---|---|---|---|---|---|---|
| 1005 Hess Ave | 0.12mi | 4/2.0 | 1,408 (-11%) | 10mo | $46,000 | $33 | 68 |
| 1101 Pennsylvania Ave | 0.25mi | 4/2.0 | 1,544 (-2%) | 20mo | $48,000 | $31 | 67 |
| 1404 E Lake Rd | 0.29mi | 5/2.0 (+1) | 1,640 (+4%) | 14mo | $75,000 | $46 | 64 |
| 820 Wayne St | 0.57mi | 4/2.0 | 1,584 (0%) | 13mo | $42,500 | $27 | 62 |
| 941 E 11th St | 0.40mi | 3/2.0 (-1) | 1,520 (-4%) | 9mo | $58,000 | $38 | 62 |
| 1349 E 8th St | 0.11mi | 4/2.0 | 1,800 (+14%) | 19mo | $73,000 | $41 | 56 |
| 1015 E 5th St | 0.38mi | 4/2.0 | 1,696 (+7%) | 22mo | $45,000 | $27 | 52 |
Match score weights: distance 35% · size 25% · config 20% · recency 20%. Top-matched comps best support the ARV.
Projected returns pro-forma
5.73% appreciation · 3.0% rent growth · sell at horizon
- IRR
- 42.5%
- Equity multiple
- 3.69×
- Total profit
- $67,712
- Equity at exit
- $54,988
- IRR
- 39.8%
- Equity multiple
- 7.59×
- Total profit
- $165,834
- Equity at exit
- $98,426
Cash invested: $25,172 (down + closing). Projections, not guarantees.
Landlord ↔ Tenant lean methodology
- Overall (STATE)
- 62 Landlord-Friendly
- State Pennsylvania
- 62 Landlord-Friendly · EVEN
- County
- — inherits STATE
- City
- — inherits STATE
ZIP-level market 16503
- Home prices YoY
- 4.4%
- Active inventory
- 47
- Price-to-rent
- 9.1×
Monthly cashflow live
- Estimated rent
- $1,652 high interval (Pro) →
- Mortgage (P&I)
- −$471
- Tax from tax record
- −$118 /mo · $1,422/yr
- Insurance
- −$37
- HOA
- −$0
- Vacancy / Maint / Mgmt
- −$347
- Net cashflow
- $678
Break-even live
2-unit breakdown (identical units grouped — click to expand)
| Units | Beds | Baths | Est. rent |
|---|---|---|---|
| 2× units | 2 | 1 | $1,652 |
| #1 | 2 | 1 | $826 |
| #2 | 2 | 1 | $826 |
| Total (2 units) | $1,652 | ||
UW: 25.0% down · 7.5% · 30yr · 1.5% tax · 5.0% vac · 8.0% maint · 8.0% mgmt
Financing live
Cash to close
- Down payment
- $22,475
- Closing costs
- $2,697
- Reserves months
- —
- Total cash needed
- —
Loan-product check · same deal, 3 products live
Conventional
25% down · 7.5% · 30yr
- Down + closing
- —
- Monthly P&I
- —
- Monthly cashflow
- —
- DSCR
- —
- Eligible?
- —
Personal DTI + credit; lowest rate.
DSCR
20% down · 8.5% · 30yr
- Down + closing
- —
- Monthly P&I
- —
- Monthly cashflow
- —
- DSCR
- —
- Eligible?
- —
No personal income docs; deal must DSCR.
Hard money
10% down · 12.0% · 12mo
- Down + closing
- —
- Monthly P&I
- —
- Monthly cashflow
- —
- DSCR
- —
- Eligible?
- —
Short-term bridge; refi at stabilization.
Rent comps 3 comps
| Address | Beds | Baths | Sqft | Rent | $/sqft | DOM | Units | Dist |
|---|---|---|---|---|---|---|---|---|
| 622 E 4th St Erie, PA | 3.0 | 1.0 | 1500 | $1,250 | $0.83 | 44d | 1 | 0.85mi |
| 614 E 22nd St Unit 1 Erie, PA | 3.0 | 1.0 | 1300 | $1,000 | $0.77 | 44d | 1 | 1.18mi |
| 100 Erie Insurance Pl Erie, PA | 3.0 | 1.0 | 1120 | $1,425 | $1.27 | 44d | 1 | 1.50mi |
Listing history 3 events
-
2026-05-08$89,900 Active 1016-char remark
-
2018-04-16soldstatus $30,000 247-char remark
Show marketing remark (247 chars)
Nice 2 unit . First floor remodeled in 2017 (could be for owner occupied) has new carpeting, repainted walls, new cabinets & counter tops, new doors, remodeled bath, newer windows both floors- 2006. Separate gas and electric. rewired in 2002
-
2018-02-24$39,900 247-char remark
Show marketing remark (247 chars)
Nice 2 unit . First floor remodeled in 2017 (could be for owner occupied) has new carpeting, repainted walls, new cabinets & counter tops, new doors, remodeled bath, newer windows both floors- 2006. Separate gas and electric. rewired in 2002
ⓘ Source: listings_history table (triggers on properties + properties_extension) + one-shot
backfill from property_details.listing_events for pre-trigger history.
Tax reassessment forecast PA · Partial reset (capped growth)
- Current annual tax
- $1,422 · $118/mo
- Projected year-2 tax
- $1,422 · $118/mo
- Expected delta
- $0/yr ($0/mo · 0.0%)
ⓘ Screening estimate from a state-policy table — verify with the county assessor before closing.
Climate risk First Street
- Flood 1/10 Low FEMA zone X (unshaded) · 0% chance over 30 yrs
- Wildfire 1/10 Low
- Heat 3/10 Moderate 7 d/yr ≥90°F today · 17 d/yr by 30 yrs out
- Wind 1/10 Low
- Air quality 2/10 Low 1 unhealthy d/yr today · 3 by 30 yrs out
Nearby sold comps map
Loading sold comps map…
Walkable amenities ~0.75 mi
Loading nearby amenities…
Taxation est. · year 1
- Rental income
- $19,824
- − Mortgage interest
- −$5,036
- − Property taxes
- −$1,422
- − Insurance
- −$450
- − Repairs & maintenance
- −$1,586
- − Management
- −$1,586
- − Depreciation
- −$2,615
- Taxable income
- $7,130
- Est. tax owed @ 24.0%
- −$1,711
- After-tax cash flow
- $6,421/yr
For passive investors: Depreciation is non-cash, so a rental often shows a tax loss while cash-flowing — sheltering income. Rental losses are passive: they offset passive income freely, and up to $25,000/yr can offset ordinary (W-2) income if you actively participate and your MAGI is under $100k (phasing out to $0 by $150k); unused losses carry forward. On sale, claimed depreciation is recaptured at up to 25%, and gains may owe capital-gains tax (a 1031 exchange can defer both). Figures are a year-1 estimate at your 24.0% rate — not tax advice; consult a CPA.
Schools (NCES district)
- District
- Erie City SD
- NCES district ID
- 4209300
- Math proficiency
- 12% ▼ -11.00%
- Reading proficiency
- 19% ▼ -16.00%
- Median HH income
- $33,625
- Composite
- 12.59/100
- National rank
- #9617
- State rank
- #510 of 539 in PA
Livability — Erie
- Score
- 83/100
- State rank
- #109
- US rank
- #840
Category grades
Schools grade is shown separately in the Schools card above.
Census & demographics
- Census place
- Erie, PA
- City population
- 92,215
- Population (ZIP)
- 15,204
Population outlook (Erie County) Hauer SSP2
- Today (2025)
- 272,159 people
- By 2030
- 266,299 · -2.2%
- By 2040
- 250,987 · -7.8%
- By 2050
- 234,925 · -13.7%
- By 2075
- 199,164 · -26.8%
- By 2100
- 162,985 · -40.1%
Race, ethnicity, and origin ACS 2023
- Neighborhood character
- Diverse neighborhood (Simpson 0.65)
- Race & ethnicity
- White 45% Black 37% Hispanic / Latino 10% Two or more races 8% Asian 2%
- Hispanic origin (detail)
- Mexican 2% Puerto Rican 7%
- Common ancestry
- Romanian 6% Scotch-Irish 1% Lithuanian 1%
- Foreign-born
- 6% · India, Canada
- Languages at home
- 90% English-only · Spanish 4% Arabic 2% Other Indo-European 2%
Political lean MEDSL · Erie
- 2024 margin
- Toss-up / Even · D 49.0% · R 50.0%
- 2008→2024 swing
- -20.9pp toward R · 2008: 19.9pp · 2024: -1.0pp
- All cycles
- 2024: R+1.0 2020: D+1.0 2016: R+2.0 2012: D+16.9 2008: D+19.9
Not yet ingested
- Civics
- —
Market trends
- HPI YoY
- ▲ 5.73%
- Current HPI
- 135.5955
- Rent YoY
- —
- Metro
- —
- State GDP YoY
- ▲ 1.68%
- F500 in state
- 34
Industry mix (Fortune 500 HQ in PA)
| Industry | F500 HQs | Revenue |
|---|---|---|
| Healthcare | 2 | $309B |
|
||
| Insurance | 2 | $27B |
|
||
| Telecommunications / Media | 1 | $124B |
|
||
| Industrial Distribution | 1 | $22B |
|
||
| Financial Services | 1 | $20B |
|
||
| Chemicals / Materials | 1 | $18B |
|
||
Price history
+125.3% since first listed4 events — show timeline
- 2026-05-21 Pending — GEBOR
- 2026-05-08 Listed $89,900 GEBOR
- 2018-04-16 Sold (MLS) $30,000 GEBOR
- 2018-02-24 Listed $39,900 GEBOR
Property tax history
+1.9%/yrLatest (2026): $1,422 · +3.4% YoY. Source: county tax records.
Cash-flow waterfall
monthlySold comps — $/sqft
last 12 mo · ≤1 miLoading sold comps…