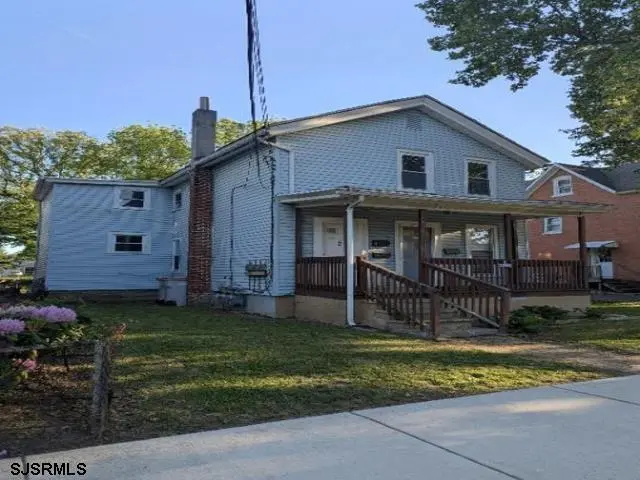
 Triplex
713 E Pear St · Vineland, NJ
Flood risk 1/10 · Minimal
- FEMA flood zone
- X (unshaded)
- Chance of flooding over 30 yrs
- 0.0%
- Est. flood insurance / yr
- $507 – $1,088
Fire risk 1/10 · Minimal
- Est. fire insurance / yr
- $526 – $976
Heat risk 7/10 · Major
- Hot days now (above 103°F)
- 7 days/yr
- Hot days in 30 yrs
- 15 days/yr
Wind risk 6/10 · Moderate
- Chance of severe wind over 30 yrs
- 68.0%
Air-quality risk 3/10 · Minor
- Unhealthy air days now
- 3 days/yr
- Unhealthy air days in 30 yrs
- 5 days/yr
Risk factors via First Street. Map © Google.
Why this score? — see what drove the B grade
The composite is a weighted blend of 9 inputs, each scored 0–100. Each bar is that input's sub-score; the figure is the points it added to the 100-point composite (weight × sub-score).
- Cash flow +30.0/30.0
- 1% rule +10.0/10.0
- DSCR +10.0/10.0
- ARV discount +7.5/15.0
- Appreciation +5.0/10.0
- Livability +3.3/5.0
- Rent growth +2.5/5.0
- Condition / age +2.5/5.0
- Schools +1.9/10.0
$315,000
🖨 Deal sheet 📄 Offer letter ✓ Due diligence
Multi-family units
County records classify this as Multi-Family (2-4 Unit). Listing-text estimate: 3 units. confirmed
Listing remarks MLS
Triplex - two lower level apartments, one upper level apartment. New tiled floor. One apartment has play room. Call Listing Agent for information or to set up appointments.
Key facts
- Covered front porch
- Eat in kitchen
- Large yard
Tags
Property features AI
Finance
- Financial info: Annual taxes listed: $3,769
Exterior
- Parking: No exterior parking; No garage
- Utilities: Public water; Public sewer
- Home design: Multi-unit property with 3 units; Lot dimensions approximately 50 x 150
- Exterior features: Not waterfront
Interior
- Bedrooms: Unit 1: 2 bedrooms (lower level); Unit 2: 2 bedrooms (upper level); Unit 3: 1 bedroom (lower level)
- Bathrooms: Unit 1: 1 bathroom; Unit 2: 1 bathroom; Unit 3: 1 bathroom
- Heating & cooling: Natural gas heating
- Interior features: Outside entrance to basement; Unfinished basement
Neighborhood map
What this means for you Summary
Snapshot
- This is a 2×1bd/1.0ba + 1×2bd/1.0ba units multifamily listed at $315k.
Deal economics
- At list price, monthly cash flow is $2k ($26k/yr) — positive. Per door: $733/mo.
- The deal already cash-flows at list — no discount required.
- Meets the 1% rule at list price ($5k rent vs $315k).
- Recommended offer: $306k (3.0% below list) — sets the bar for market timing.
- Cap rate 14.7% vs local median 4.5% in Vineland — top-decile yield for the area; either an underpriced asset or a hidden risk that comps aren't pricing in. Stress-test before assuming the spread holds.
Location & tenants
- Location reads 66/100 on livability (#363 in NJ) — a middle-class / working-renter tenant base. Strengths: housing A+, health & safety A+; Watch: employment D+, schools D, crime F.
- Vineland Public School District (urban): math 9% / reading 34% proficiency, ranked #418 of 472 in NJ (top 89%) — low school quality limits family demand, transient renter base, plan for 1-2y turnover.
- Market conditions: 1 active listings in the ZIP; 216 units permitted in Cumberland County in 2024 (73 in 5+ unit buildings).
Forward outlook
- In year one you build about $12k of equity ($2k loan paydown + $9k appreciation (3.0% local appreciation)).
- Cumberland County population projected to shrink 7% by 2050 — rents likely to lag national; underwrite the cash flow, not the appreciation.
- At projected returns (3.0% appreciation + 3.0% rent growth), your $88k cash investment doubles in ~3 years — after that, you're playing with house money.
- By year 4, paydown + projected appreciation supports a ~$39k cash-out refi (75% LTV) — recoverable capital for the next deal without selling this one.
Negotiation context
- It's been on market 35 days — a 3% lower offer ($306k) is reasonable based on typical stale-listing flexibility.
- 2 sale attempts since 23y ago with the ask held roughly flat each time — persistent listings suggest the price (not the market) is what's stuck; bring a comps-based counter.
- Current owner paid $85k; list at $315k implies a 271% gain — meaningful room to come down on a strong offer.
Risks & watch-outs
- Watch-outs: built in 1865 — expect roof / HVAC / electrical / plumbing capex.
- Climate carrying-cost: major wind risk, 68% chance of damaging wind over 30y; extreme-heat days projected 7→15/yr by 2055 (HVAC capex compounding) — expect insurance premiums to compound above CPI over the hold.
Questions for the listing agent
- It's been on market 35 days. Have you received any prior offers? Is the seller open to a 3% concession, seller financing, or rate buy-down credit?
- Can we see the unit-by-unit rent roll, current vacancy, and any below-market leases? What's the average tenancy length?
- What capital expenditures (roof, boiler, parking lot, exteriors) have been made in the last 5 years, and what's planned in the next 2?
- Built in 1865 — when were the roof, HVAC, electrical panel, plumbing, and water heater last replaced?
- Is there a deadline driving the sale (1031 exchange, divorce, estate, relocation)? That informs how much negotiation room exists.
- Schools are D-rated, which usually means shorter tenancies and higher turnover. Who's the typical renter profile here, and what's been the actual vacancy rate?
- Crime grade is F in this area — have there been break-ins, vandalism, or insurance claims at this property in the last 3 years? What carrier currently insures it and at what premium?
- What's the average days-on-market for RENTAL listings here right now (not sales)? A rising rental-DOM trend means longer vacancies and softer asking-rent achievability than the comps imply.
- What's the recent tenant-quality profile in this submarket — average credit score on applications, eviction rate, late-payment / NSF rate, and stable-employment percentage? A property-management company in the area should have these aggregated.
- How much new apartment / multifamily construction is in the pipeline within 1–3 miles? Heavy new supply (>2% of stock underway) typically softens rents 12–24 months out; light construction supports rent growth.
Investment metrics
- 1% rule
- 1.73% ✓
- Cap rate
- 14.68%
- Cash-on-cash
- 29.94%
- DSCR
- 2.33
- GRM
- 4.8
CMA / ARV
No comps found within radius.
Projected returns pro-forma
3.0% appreciation · 3.0% rent growth · sell at horizon
- IRR
- 35.8%
- Equity multiple
- 3.02×
- Total profit
- $178,123
- Equity at exit
- $141,638
- IRR
- 35.9%
- Equity multiple
- 5.96×
- Total profit
- $437,789
- Equity at exit
- $218,281
Cash invested: $88,200 (down + closing). Projections, not guarantees.
Landlord ↔ Tenant lean methodology
- Overall (STATE)
- 21 Tenant-Leaning
- State New Jersey
- 21 Tenant-Leaning · D+6
- County
- — inherits STATE
- City
- — inherits STATE
ZIP-level market 08360-3864
- Active inventory
- 1
- Price-to-rent
- 15.7×
Monthly cashflow live
- Estimated rent
- $5,440 medium interval (Pro) →
- Mortgage (P&I)
- −$1,652
- Tax from tax record
- −$314 /mo · $3,769/yr
- Insurance
- −$131
- HOA
- −$0
- Vacancy / Maint / Mgmt
- −$1,142
- Net cashflow
- $2,200
Break-even live
3-unit breakdown (identical units grouped — click to expand)
| Units | Beds | Baths | Est. rent |
|---|---|---|---|
| 2× units | 1 | 1 | $3,340 |
| #1 | 1 | 1 | $1,670 |
| #2 | 1 | 1 | $1,670 |
| 1× unit | 2 | 1 | $2,100 |
| Total (3 units) | $5,440 | ||
UW: 25.0% down · 7.5% · 30yr · 1.5% tax · 5.0% vac · 8.0% maint · 8.0% mgmt
Financing live
Cash to close
- Down payment
- $78,750
- Closing costs
- $9,450
- Reserves months
- —
- Total cash needed
- —
Loan-product check · same deal, 3 products live
Conventional
25% down · 7.5% · 30yr
- Down + closing
- —
- Monthly P&I
- —
- Monthly cashflow
- —
- DSCR
- —
- Eligible?
- —
Personal DTI + credit; lowest rate.
DSCR
20% down · 8.5% · 30yr
- Down + closing
- —
- Monthly P&I
- —
- Monthly cashflow
- —
- DSCR
- —
- Eligible?
- —
No personal income docs; deal must DSCR.
Hard money
10% down · 12.0% · 12mo
- Down + closing
- —
- Monthly P&I
- —
- Monthly cashflow
- —
- DSCR
- —
- Eligible?
- —
Short-term bridge; refi at stabilization.
Listing history 23 events
-
2026-06-19days on market $315,000 Active 35 DOM
-
2026-06-18days on market $315,000 Active 34 DOM
-
2026-06-17days on market $315,000 Active 33 DOM
-
2026-06-16days on market $315,000 Active 32 DOM
-
2026-06-15days on market $315,000 Active 31 DOM
-
2026-06-14days on market $315,000 Active 29 DOM
-
2026-06-13days on market $315,000 Active 28 DOM
-
2026-06-10days on market $315,000 Active 26 DOM
-
2026-06-09days on market $315,000 Active 25 DOM
-
2026-06-08days on market $315,000 Active 24 DOM
-
2026-06-07days on market $315,000 Active 23 DOM
-
2026-06-03days on market $315,000 Active 19 DOM
-
2026-06-02days on market $315,000 Active 18 DOM
-
2026-06-01days on market $315,000 Active 17 DOM
-
2026-05-31days on market $315,000 Active 16 DOM
-
2026-05-30days on market $315,000 Active 15 DOM
-
2026-05-13$315,000 Active
-
2003-06-06soldstatus $85,000
-
2003-05-01soldstatus $85,000 172-char remark
Show marketing remark (172 chars)
Triplex - two lower level apartments, one upper level apartment. New tiled floor. One apartment has play room. Call Listing Agent for information or to set up appointments.
-
2003-02-27historical 172-char remark
Show marketing remark (172 chars)
Triplex - two lower level apartments, one upper level apartment. New tiled floor. One apartment has play room. Call Listing Agent for information or to set up appointments.
-
2003-02-22$89,000 172-char remark
Show marketing remark (172 chars)
Triplex - two lower level apartments, one upper level apartment. New tiled floor. One apartment has play room. Call Listing Agent for information or to set up appointments.
-
1996-08-21soldstatus $74,000
-
1987-09-18soldstatus $43,000
ⓘ Source: listings_history table (triggers on properties + properties_extension) + one-shot
backfill from property_details.listing_events for pre-trigger history.
Tax reassessment forecast NJ · Partial reset (capped growth)
- Current annual tax
- $3,769 · $314/mo
- Projected year-2 tax
- $5,806 · $484/mo
- Expected delta
- +$2,037/yr (+$170/mo · 54.1%)
ⓘ Screening estimate from a state-policy table — verify with the county assessor before closing.
Climate risk First Street
- Flood 1/10 Low FEMA zone X (unshaded) · 0% chance over 30 yrs
- Wildfire 1/10 Low
- Heat 7/10 Severe 7 d/yr ≥103°F today · 15 d/yr by 30 yrs out
- Wind 6/10 Major 68% chance of damaging wind over 30 yrs
- Air quality 3/10 Moderate 3 unhealthy d/yr today · 5 by 30 yrs out
Nearby sold comps map
Loading sold comps map…
Walkable amenities ~0.75 mi
Loading nearby amenities…
Taxation est. · year 1
- Rental income
- $65,280
- − Mortgage interest
- −$17,645
- − Property taxes
- −$3,769
- − Insurance
- −$1,575
- − Repairs & maintenance
- −$5,222
- − Management
- −$5,222
- − Depreciation
- −$9,164
- Taxable income
- $22,683
- Est. tax owed @ 24.0%
- −$5,444
- After-tax cash flow
- $20,961/yr
For passive investors: Depreciation is non-cash, so a rental often shows a tax loss while cash-flowing — sheltering income. Rental losses are passive: they offset passive income freely, and up to $25,000/yr can offset ordinary (W-2) income if you actively participate and your MAGI is under $100k (phasing out to $0 by $150k); unused losses carry forward. On sale, claimed depreciation is recaptured at up to 25%, and gains may owe capital-gains tax (a 1031 exchange can defer both). Figures are a year-1 estimate at your 24.0% rate — not tax advice; consult a CPA.
Schools (NCES district)
- District
- Vineland Public School District
- NCES district ID
- 3416800
- Math proficiency
- 9% ▼ -17.00%
- Reading proficiency
- 34% ▬ 0.00%
- Median HH income
- $51,168
- Composite
- 19.17/100
- National rank
- #8819
- State rank
- #418 of 472 in NJ
Livability — Vineland
- Score
- 66/100
- State rank
- #363
- US rank
- #12180
Category grades
Schools grade is shown separately in the Schools card above.
Census & demographics
- Census place
- Vineland, NJ
Population outlook (Cumberland County) Hauer SSP2
- Today (2025)
- 152,743 people
- By 2030
- 150,373 · -1.6%
- By 2040
- 146,881 · -3.8%
- By 2050
- 142,653 · -6.6%
- By 2075
- 129,468 · -15.2%
- By 2100
- 107,456 · -29.6%
Not yet ingested
- Political lean
- —
- Race & ethnicity
- —
- Common origin
- —
- Civics
- —
Market trends
- HPI YoY
- —
- Current HPI
- —
- Rent YoY
- —
- Metro
- —
- State GDP YoY
- ▲ 2.05%
- F500 in state
- 34
Industry mix (Fortune 500 HQ in NJ)
| Industry | F500 HQs | Revenue |
|---|---|---|
| Consumer Goods | 3 | $31B |
|
||
| Pharmaceuticals | 2 | $153B |
|
||
| Technology | 2 | $21B |
|
||
| Insurance | 2 | $20B |
|
||
| Healthcare | 2 | $19B |
|
||
| Financial Services | 1 | $70B |
|
||
Price history
+632.6% since first listed7 events — show timeline
- 2026-05-13 Listed $315,000 SJSRMLS
- 2003-06-06 Sold (Public Records) $85,000 Public Records
- 2003-05-01 Sold (MLS) $85,000 SJSRMLS
- 2003-02-27 Listing Removed — SJSRMLS
- 2003-02-22 Listed $89,000 SJSRMLS
- 1996-08-21 Sold (Public Records) $74,000 Public Records
- 1987-09-18 Sold (Public Records) $43,000 Public Records
Property tax history
+3.1%/yrLatest (2025): $3,769 · +3.9% YoY. Source: county tax records.
Cash-flow waterfall
monthlySold comps — $/sqft
last 12 mo · ≤1 miLoading sold comps…