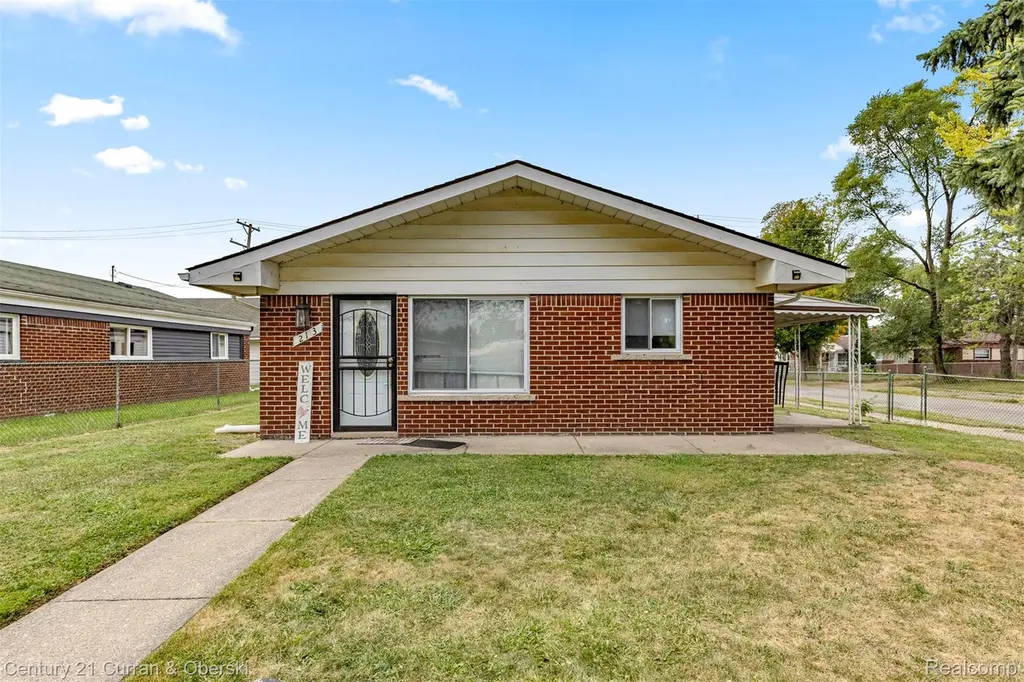
213 Suburban St · Ecorse, MI
Flood risk 6/10 · Moderate
- FEMA flood zone
- X (unshaded)
- Chance of flooding over 30 yrs
- 0.71%
- Est. flood insurance / yr
- $507 – $1,088
Fire risk 1/10 · Minimal
- Est. fire insurance / yr
- $784 – $1,456
Heat risk 3/10 · Minor
- Hot days now (above 97°F)
- 7 days/yr
- Hot days in 30 yrs
- 15 days/yr
Wind risk 2/10 · Minimal
- Chance of severe wind over 30 yrs
- —
Air-quality risk 3/10 · Minor
- Unhealthy air days now
- 3 days/yr
- Unhealthy air days in 30 yrs
- 5 days/yr
Risk factors via First Street. Map © Google.
Why this score? — see what drove the D+ grade
The composite is a weighted blend of 9 inputs, each scored 0–100. Each bar is that input's sub-score; the figure is the points it added to the 100-point composite (weight × sub-score).
- Cash flow +14.7/30.0
- Appreciation +10.0/10.0
- DSCR +4.5/10.0
- 1% rule +3.9/10.0
- ARV discount +3.7/15.0
- Livability +3.5/5.0
- Rent growth +2.5/5.0
- Condition / age +2.5/5.0
- Schools +0.3/10.0
$140,000
🖨 Deal sheet 📄 Offer letter ✓ Due diligence
Listing remarks MLS
Welcome to 213 Suburban a beautifully maintained 3-bedroom, 1 bath ranch offering 1,200+ sq feet. Step inside to a bright and inviting living area, highlighted by large windows that fill the space with warm natural light. The updated kitchen offers stainless steel appliances, ample cabinet storage and a functional layout, perfect for everyday cooking or entertaining. All three bedrooms are generously sized and designed for comfort. Full bath located between bedrooms. Separate laundry storage area. Outside, enjoy a large fenced-in backyard and large 2 car garage. Conveniently located near parks, schools, shopping, and major freeways, this move-in-ready home combines comfort, functionality, and accessibility. Don't miss your chance to make it yours!
Key facts
- Large windows
- Updated kitchen
- 5,663 sq ft lot
Tags
Property features AI
Finance
- Other: Property type: Residential single-family
- Financial info: Financial details not provided
- HOA & community: HOA details not provided
Exterior
- Parking: Attached 2-car garage
- Security: Security details not provided
- Utilities: Public water; Public sewer
- Home design: Single-family residence; One level, ground-level entry
- Construction: Brick construction; Slab foundation; Built area above grade: 1,216 square feet
- Exterior features: Paved road access; Lot dimensions approximately 54 x 108 (0.13 acres)
Interior
- Kitchen: Kitchen details not provided
- Bedrooms: Bedrooms information not provided
- Flooring: Flooring details not provided
- Bathrooms: 1 full bathroom
- Heating & cooling: Forced air heating (natural gas); No cooling
- Interior features: Awning(s); 6 total rooms
- Laundry & utility: Laundry details not provided
Neighborhood map
What this means for you Summary
Snapshot
- This is a 3-bed/1.0-bath single-family listed at $140k.
Deal economics
- At list price, monthly cash flow is $35 ($423/yr) — positive.
- The deal already cash-flows at list — no discount required.
- To meet the 1% rule (rent ≥ 1% of price), the offer needs to be $124k (11.5% below list).
- Recommended offer: $124k (11.5% below list) — sets the bar for 1% rule.
- Cap rate 6.6% vs local median 9.6% in Ecorse — below-typical yield; the buyer is paying a premium for something (appreciation thesis, condition, location) that the cap rate doesn't capture.
Location & tenants
- Location reads 69/100 on livability (#348 in MI) — a middle-class / working-renter tenant base. Strengths: commute A+, cost of living A+, housing A+; Watch: health & safety D+, schools F, crime F.
- Ecorse Public Schools (suburban): math 3% / reading 7% proficiency, ranked #536 of 540 in MI (top 99%) — low school quality limits family demand, transient renter base, plan for 1-2y turnover; 80% free/reduced lunch — lower-income household profile, screen leases tightly.
- Market conditions: 56 active listings in the ZIP; 21 comparable units currently listed for rent nearby; rentals at typical pace (median 15d on market — plan ~3-4 weeks tenant-placement turnaround); 2,639 units permitted in Wayne County in 2024 (1,216 in 5+ unit buildings).
Forward outlook
- In year one you build about $15k of equity ($968 loan paydown + $14k appreciation (10.0% local appreciation)).
- Wayne County population projected at -17% by 2050 — secular population decline; favor cash flow + early exit over multi-decade hold.
- At projected returns (10.0% appreciation + 3.0% rent growth), your $39k cash investment doubles in ~3 years — after that, you're playing with house money.
- By year 3, paydown + projected appreciation supports a ~$38k cash-out refi (75% LTV) — recoverable capital for the next deal without selling this one.
Negotiation context
- It's been on market 17 days — a 2% lower offer ($138k) is reasonable based on typical stale-listing flexibility.
- 14 sale attempts since 25y ago with the ask held roughly flat each time — persistent listings suggest the price (not the market) is what's stuck; bring a comps-based counter.
- Current owner paid $103k; 36% above their basis — modest negotiation headroom, anchor on the comps not their cost.
Risks & watch-outs
- Watch-outs: built in 1959 — expect roof / HVAC / electrical / plumbing capex.
- Climate carrying-cost: major flood risk — expect insurance premiums to compound above CPI over the hold.
Questions for the listing agent
- Built in 1959 — when were the roof, HVAC, electrical panel, plumbing, and water heater last replaced?
- Is there a deadline driving the sale (1031 exchange, divorce, estate, relocation)? That informs how much negotiation room exists.
- Schools are F-rated, which usually means shorter tenancies and higher turnover. Who's the typical renter profile here, and what's been the actual vacancy rate?
- Crime grade is F in this area — have there been break-ins, vandalism, or insurance claims at this property in the last 3 years? What carrier currently insures it and at what premium?
- The area grade is low — what's the realistic commute time and amenity access for the typical tenant pool here? Any planned neighborhood developments (good or bad) we should know about?
- What's the average days-on-market for RENTAL listings here right now (not sales)? A rising rental-DOM trend means longer vacancies and softer asking-rent achievability than the comps imply.
- What's the recent tenant-quality profile in this submarket — average credit score on applications, eviction rate, late-payment / NSF rate, and stable-employment percentage? A property-management company in the area should have these aggregated.
- How much new for-sale + rental construction is in the pipeline within 1–3 miles? Heavy new supply typically softens prices + rents 12–24 months out; constrained supply supports both.
Investment metrics
- 1% rule
- 0.89% ✗
- Cap rate
- 6.60%
- Cash-on-cash
- 1.08%
- DSCR
- 1.05
- GRM
- 9.4
CMA / ARV
- ARV (on-the-fly)
- $129,042
- Comps found
- 12
Show comp detail 12 sales within ~0.75 mi
| Address | Dist | Beds/Ba | Sqft | Sold | Price | $/sf | Match |
|---|---|---|---|---|---|---|---|
| 4635 5th St | 0.04mi | 3/1.0 | 965 (+0%) | 1mo | $99,900 | $104 | 97 |
| 277 White St | 0.17mi | 3/1.0 | 1,007 (+5%) | 5mo | $151,000 | $150 | 80 |
| 350 Labadie St | 0.53mi | 3/1.0 | 960 (-0%) | 3mo | $99,000 | $103 | 72 |
| 4548 8th St | 0.20mi | 3/1.0 | 1,077 (+12%) | 2mo | $109,000 | $101 | 70 |
| 483 Park Ave | 0.44mi | 3/2.0 | 988 (+3%) | 3mo | $206,000 | $209 | 69 |
| 239 White St | 0.12mi | 3/1.0 | 1,100 (+14%) | 4mo | $120,000 | $109 | 68 |
| 2458 River Dr | 0.40mi | 3/1.0 | 1,078 (+12%) | 1mo | $144,000 | $134 | 60 |
| 4250 7th St | 0.68mi | 2/1.0 (-1) | 935 (-3%) | 0mo | $37,750 | $40 | 58 |
| 4260 Pitt St | 0.71mi | 3/1.5 | 998 (+4%) | 2mo | $31,000 | $31 | 57 |
| 318 Clinton St | 0.73mi | 3/1.0 | 936 (-3%) | 6mo | $165,000 | $176 | 57 |
| 525 Mill St | 0.48mi | 3/1.0 | 1,070 (+11%) | 6mo | $196,000 | $183 | 54 |
| 645 Riverbank St | 0.74mi | 3/1.5 | 1,036 (+8%) | 4mo | $165,000 | $159 | 48 |
Match score weights: distance 35% · size 25% · config 20% · recency 20%. Top-matched comps best support the ARV.
Projected returns pro-forma
10.0% appreciation · 3.0% rent growth · sell at horizon
- IRR
- 25.1%
- Equity multiple
- 3.00×
- Total profit
- $78,498
- Equity at exit
- $126,123
- IRR
- 22.1%
- Equity multiple
- 6.85×
- Total profit
- $229,406
- Equity at exit
- $271,989
Cash invested: $39,200 (down + closing). Projections, not guarantees.
Landlord ↔ Tenant lean methodology
- Overall (STATE)
- 62 Landlord-Friendly
- State Michigan
- 62 Landlord-Friendly · EVEN
- County
- — inherits STATE
- City
- — inherits STATE
ZIP-level market 48229
- Home prices YoY
- 33.9%
- Active inventory
- 56
- Price-to-rent
- 9.4×
Monthly cashflow live
- Estimated rent
- $1,239 high interval (Pro) →
- Mortgage (P&I)
- −$734
- Tax from tax record
- −$151 /mo · $1,813/yr
- Insurance
- −$58
- HOA
- −$0
- Vacancy / Maint / Mgmt
- −$260
- Net cashflow
- $35
Break-even live
UW: 25.0% down · 7.5% · 30yr · 1.5% tax · 5.0% vac · 8.0% maint · 8.0% mgmt
Financing live
Cash to close
- Down payment
- $35,000
- Closing costs
- $4,200
- Reserves months
- —
- Total cash needed
- —
Loan-product check · same deal, 3 products live
Conventional
25% down · 7.5% · 30yr
- Down + closing
- —
- Monthly P&I
- —
- Monthly cashflow
- —
- DSCR
- —
- Eligible?
- —
Personal DTI + credit; lowest rate.
DSCR
20% down · 8.5% · 30yr
- Down + closing
- —
- Monthly P&I
- —
- Monthly cashflow
- —
- DSCR
- —
- Eligible?
- —
No personal income docs; deal must DSCR.
Hard money
10% down · 12.0% · 12mo
- Down + closing
- —
- Monthly P&I
- —
- Monthly cashflow
- —
- DSCR
- —
- Eligible?
- —
Short-term bridge; refi at stabilization.
Rent comps 21 comps
| Address | Beds | Baths | Sqft | Rent | $/sqft | DOM | Units | Dist |
|---|---|---|---|---|---|---|---|---|
| 4573 3rd St Ecorse, MI | 2.0 | 1.0 | 1000 | $1,300 | $1.30 | 15d | 1 | 0.11mi |
| 4581 High St Unit 13 Ecorse, MI | 2.0 | 1.0 | 700 | $1,050 | $1.50 | 24d | 1 | 0.38mi |
| 4471 High St Unit 81-13 Ecorse, MI | 2.0 | 1.0 | 700 | $1,050 | $1.50 | 24d | 1 | 0.44mi |
| 4471 High St Unit 71-7 Ecorse, MI | 2.0 | 1.0 | 700 | $1,150 | $1.64 | 24d | 1 | 0.44mi |
| 4435 High St Ecorse, MI | 2.0 | 1.0 | 792 | $1,095 | $1.38 | 5d | 1 | 0.48mi |
| 708 Highland St Unit 1 Wyandotte, MI | 2.0 | 1.0 | 800 | $950 | $1.19 | 18d | 1 | 0.69mi |
| 177 N Riverbank St Wyandotte, MI | 2.0 | 1.0 | 671 | $1,600 | $2.38 | 1d | 1 | 0.69mi |
| 424 4th St Wyandotte, MI | 2.0 | 1.0 | 925 | $1,350 | $1.46 | 24d | 1 | 0.72mi |
| 1581 Empire Ave Lincoln Park, MI | 2.0 | 1.0 | 900 | $1,350 | $1.50 | 24d | 1 | 0.74mi |
| 168 Bondie St Wyandotte, MI | 3.0 | 1.0 | 1080 | $1,295 | $1.20 | 5d | 1 | 0.81mi |
| 170 Bondie St Wyandotte, MI | 3.0 | 1.0 | 1080 | $1,399 | $1.30 | 2d | 1 | 0.82mi |
| 146 Bondie St Wyandotte, MI | 2.0 | 1.0 | 820 | $1,650 | $2.01 | 1d | 1 | 0.82mi |
| 850 Biddle Ave Unit 2 Wyandotte, MI | 2.0 | 1.0 | 800 | $1,300 | $1.62 | 5d | 1 | 1.02mi |
| 1537 Chandler Ave Lincoln Park, MI | 2.0 | 1.0 | 725 | $1,100 | $1.52 | 17d | 1 | 1.18mi |
| 1159 McKinley St Wyandotte, MI | 3.0 | 1.0 | 1050 | $1,350 | $1.29 | 1d | 1 | 1.28mi |
| 3575 S Ethel St Detroit, MI | 3.0 | 1.0 | 894 | $1,350 | $1.51 | 17d | 1 | 1.31mi |
| 610 Harrison Blvd Unit 46 Lincoln Park, MI | 2.0 | 1.0 | 800 | $995 | $1.24 | 2d | 1 | 1.36mi |
| 610 Harrison Blvd Apt 43 Lincoln Park, MI | 2.0 | 1.0 | 800 | $1,050 | $1.31 | 24d | 1 | 1.36mi |
| 720 Harrison Blvd Unit 20 Lincoln Park, MI | 2.0 | 1.0 | 800 | $1,025 | $1.28 | 2d | 1 | 1.38mi |
| 750 Harrison Blvd Unit 5 Lincoln Park, MI | 2.0 | 1.0 | 800 | $995 | $1.24 | 5d | 1 | 1.38mi |
| 1343 Pagel Ave Unit 2-Upper Lincoln Park, MI | 2.0 | 1.0 | 1000 | $1,250 | $1.25 | 18d | 1 | 1.40mi |
Listing history 45 events
-
2026-06-13statusdays on market $140,000 Pending 17 DOM
-
2026-06-09days on market $140,000 Active 14 DOM
-
2026-06-08days on market $140,000 Active 13 DOM
-
2026-06-07days on market $140,000 Active 12 DOM
-
2026-06-04days on market $140,000 Active 9 DOM
-
2026-06-03days on market $140,000 Active 8 DOM
-
2026-06-02days on market $140,000 Active 7 DOM
-
2026-06-01days on market $140,000 Active 6 DOM
-
2026-05-31days on market $140,000 Active 5 DOM
-
2026-05-26$140,000 Active
Show marketing remark (757 chars)
Welcome to 213 Suburban a beautifully maintained 3-bedroom, 1 bath ranch offering 1,200+ sq feet. Step inside to a bright and inviting living area, highlighted by large windows that fill the space with warm natural light. The updated kitchen offers stainless steel appliances, ample cabinet storage and a functional layout, perfect for everyday cooking or entertaining. All three bedrooms are generously sized and designed for comfort. Full bath located between bedrooms. Separate laundry storage area. Outside, enjoy a large fenced-in backyard and large 2 car garage. Conveniently located near parks, schools, shopping, and major freeways, this move-in-ready home combines comfort, functionality, and accessibility. Don't miss your chance to make it yours!
-
2026-05-26$140,000 Active 757-char remark
Show marketing remark (757 chars)
Welcome to 213 Suburban a beautifully maintained 3-bedroom, 1 bath ranch offering 1,200+ sq feet. Step inside to a bright and inviting living area, highlighted by large windows that fill the space with warm natural light. The updated kitchen offers stainless steel appliances, ample cabinet storage and a functional layout, perfect for everyday cooking or entertaining. All three bedrooms are generously sized and designed for comfort. Full bath located between bedrooms. Separate laundry storage area. Outside, enjoy a large fenced-in backyard and large 2 car garage. Conveniently located near parks, schools, shopping, and major freeways, this move-in-ready home combines comfort, functionality, and accessibility. Don't miss your chance to make it yours!
-
2025-12-11price $140,000
-
2025-12-11historical
-
2025-12-11price $140,000
-
2025-10-28$133,000 Active
-
2025-10-28$133,000 Active
-
2025-10-28historical
-
2025-10-28historical
-
2025-10-13$135,000 Active
-
2025-10-13$135,000 Active
-
2025-10-13historical
-
2025-10-13historical
-
2025-09-17$139,999 Active
-
2025-09-17$139,999 Active
-
2025-09-16historical
-
2022-12-12soldstatus $103,000
-
2022-12-08soldstatus $103,000 Sold
-
2022-12-08soldstatus $103,000 Closed
-
2022-10-10status Pending
-
2022-10-10status Pending
-
2022-10-02price $115,000
-
2022-10-01price $115,000
-
2022-08-30$125,000 Active
-
2022-08-30$125,000 Active
-
2011-07-08soldstatus $10,000
-
2011-07-08soldstatus $10,000
-
2011-05-31$9,000
-
2011-05-31$9,000
-
2002-01-29soldstatus $76,000
-
2001-12-17soldstatus $76,000
-
2001-12-17soldstatus $76,000
-
2001-11-30historical
-
2001-08-15soldstatus $30,000
-
2001-07-31$82,000
-
2001-07-31$82,000
ⓘ Source: listings_history table (triggers on properties + properties_extension) + one-shot
backfill from property_details.listing_events for pre-trigger history.
Tax reassessment forecast MI · Partial reset (capped growth)
- Current annual tax
- $1,813 · $151/mo
- Projected year-2 tax
- $1,985 · $165/mo
- Expected delta
- +$171/yr (+$14/mo · 9.4%)
ⓘ Screening estimate from a state-policy table — verify with the county assessor before closing.
Climate risk First Street
- Flood 6/10 Major FEMA zone X (unshaded) · 71% chance over 30 yrs
- Wildfire 1/10 Low
- Heat 3/10 Moderate 7 d/yr ≥97°F today · 15 d/yr by 30 yrs out
- Wind 2/10 Low
- Air quality 3/10 Moderate 3 unhealthy d/yr today · 5 by 30 yrs out
Nearby sold comps map
Loading sold comps map…
Walkable amenities ~0.75 mi
Loading nearby amenities…
Taxation est. · year 1
- Rental income
- $14,869
- − Mortgage interest
- −$7,842
- − Property taxes
- −$1,813
- − Insurance
- −$700
- − Repairs & maintenance
- −$1,190
- − Management
- −$1,190
- − Depreciation
- −$4,073
- Taxable loss
- −$1,938
- Est. tax savings @ 24.0%
- +$465
- After-tax cash flow
- $888/yr
For passive investors: Depreciation is non-cash, so a rental often shows a tax loss while cash-flowing — sheltering income. Rental losses are passive: they offset passive income freely, and up to $25,000/yr can offset ordinary (W-2) income if you actively participate and your MAGI is under $100k (phasing out to $0 by $150k); unused losses carry forward. On sale, claimed depreciation is recaptured at up to 25%, and gains may owe capital-gains tax (a 1031 exchange can defer both). Figures are a year-1 estimate at your 24.0% rate — not tax advice; consult a CPA.
Schools (NCES district)
- District
- Ecorse Public Schools
- NCES district ID
- 2612930
- Math proficiency
- 3% ▼ -4.00%
- Reading proficiency
- 7% ▼ -6.00%
- Median HH income
- $28,957
- Composite
- 3.46/100
- National rank
- #10075
- State rank
- #536 of 540 in MI
Livability — Ecorse
- Score
- 69/100
- State rank
- #348
- US rank
- #8880
Category grades
Schools grade is shown separately in the Schools card above.
Census & demographics
- Census place
- Ecorse, MI
- City population
- 9,166
- Population (ZIP)
- 9,166
Population outlook (Wayne County) Hauer SSP2
- Today (2025)
- 1,675,273 people
- By 2030
- 1,620,300 · -3.3%
- By 2040
- 1,502,341 · -10.3%
- By 2050
- 1,384,039 · -17.4%
- By 2075
- 1,124,592 · -32.9%
- By 2100
- 881,193 · -47.4%
Race, ethnicity, and origin ACS 2023
- Neighborhood character
- Diverse neighborhood (Simpson 0.69)
- Race & ethnicity
- Black 45% White 26% Hispanic / Latino 21% Two or more races 15% Native American 4%
- Hispanic origin (detail)
- Mexican 18% Puerto Rican 1%
- Common ancestry
- Lithuanian 3% Romanian 2% Slovak 1%
- Foreign-born
- 4% · Canada, Guatemala, Jamaica
- Languages at home
- 86% English-only · Spanish 13%
Political lean MEDSL · Wayne
- 2024 margin
- Strong D (+29.0) · D 62.7% · R 33.7% · Other 3.6%
- 2008→2024 swing
- -20.5pp toward R · 2008: 49.5pp · 2024: 29.0pp
- All cycles
- 2024: D+29.0 2020: D+38.1 2016: D+37.3 2012: D+46.9 2008: D+49.5
Not yet ingested
- Civics
- —
Market trends
- HPI YoY
- ▲ 102.51%
- Current HPI
- 404.5927
- Rent YoY
- —
- Metro
- —
- State GDP YoY
- ▲ 1.37%
- F500 in state
- 28
Industry mix (Fortune 500 HQ in MI)
| Industry | F500 HQs | Revenue |
|---|---|---|
| Automotive Parts | 3 | $48B |
|
||
| Automotive | 2 | $372B |
|
||
| Chemicals | 1 | $45B |
|
||
| Automotive Retail | 1 | $29B |
|
||
| Healthcare / Medical Devices | 1 | $23B |
|
||
| Automotive Technology | 1 | $20B |
|
||
Price history
+70.7% since first listed36 events — show timeline
- 2026-05-26 Listed $140,000 REALCOMP
- 2026-05-26 Listed $140,000 MiRealSource-MiMLS
- 2025-12-11 Price Changed $140,000 REALCOMP
- 2025-12-11 Listing Removed — MiRealSource-MiMLS
- 2025-12-11 Price Changed $140,000 MiRealSource-MiMLS
- 2025-10-28 Listed $133,000 REALCOMP
- 2025-10-28 Listing Removed — MiRealSource-MiMLS
- 2025-10-28 Listing Removed — REALCOMP
- 2025-10-28 Listed $133,000 MiRealSource-MiMLS
- 2025-10-13 Listed $135,000 REALCOMP
- 2025-10-13 Listing Removed — MiRealSource-MiMLS
- 2025-10-13 Listing Removed — REALCOMP
- 2025-10-13 Listed $135,000 MiRealSource-MiMLS
- 2025-09-17 Listed $139,999 REALCOMP
- 2025-09-17 Listed $139,999 MiRealSource-MiMLS
- 2025-09-16 Coming Soon — MiRealSource-MiMLS
- 2022-12-12 Sold (Public Records) $103,000 Public Records
- 2022-12-08 Sold (MLS) $103,000 MiRealSource-MiMLS
- 2022-12-08 Sold (MLS) $103,000 REALCOMP
- 2022-10-10 Pending — REALCOMP
- 2022-10-10 Pending — MiRealSource-MiMLS
- 2022-10-02 Price Changed $115,000 MiRealSource-MiMLS
- 2022-10-01 Price Changed $115,000 REALCOMP
- 2022-08-30 Listed $125,000 MiRealSource-MiMLS
- 2022-08-30 Listed $125,000 REALCOMP
- 2011-07-08 Sold (MLS) $10,000 REALCOMP
- 2011-07-08 Sold (MLS) $10,000 MiRealSource-MiMLS
- 2011-05-31 Listed $9,000 REALCOMP
- 2011-05-31 Listed $9,000 MiRealSource-MiMLS
- 2002-01-29 Sold (Public Records) $76,000 Public Records
- 2001-12-17 Sold (MLS) $76,000 REALCOMP
- 2001-12-17 Sold (MLS) $76,000 MiRealSource-MiMLS
- 2001-11-30 Listing Removed — MiRealSource-MiMLS
- 2001-08-15 Sold (Public Records) $30,000 Public Records
- 2001-07-31 Listed $82,000 REALCOMP
- 2001-07-31 Listed $82,000 MiRealSource-MiMLS
Property tax history
-2.8%/yrLatest (2025): $1,813 · -48.2% YoY. Source: county tax records.
Cash-flow waterfall
monthlySold comps — $/sqft
last 12 mo · ≤1 miLoading sold comps…