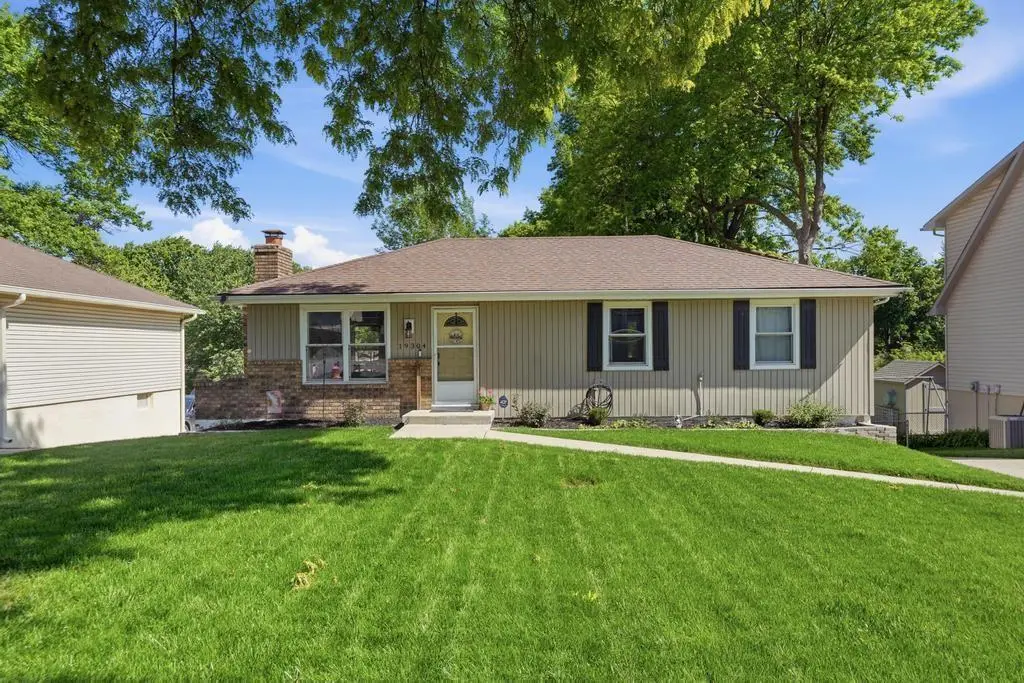
19304 E R D Mize Rd · Independence, MO
Flood risk 1/10 · Minimal
- FEMA flood zone
- X (unshaded)
- Chance of flooding over 30 yrs
- 0.0%
- Est. flood insurance / yr
- $473 – $860
Fire risk 3/10 · Minor
- Est. fire insurance / yr
- $1,054 – $1,958
Heat risk 4/10 · Minor
- Hot days now (above 108°F)
- 7 days/yr
- Hot days in 30 yrs
- 17 days/yr
Wind risk 2/10 · Minimal
- Chance of severe wind over 30 yrs
- —
Air-quality risk 3/10 · Minor
- Unhealthy air days now
- 3 days/yr
- Unhealthy air days in 30 yrs
- 3 days/yr
Risk factors via First Street. Map © Google.
Why this score? — see what drove the D grade
The composite is a weighted blend of 9 inputs, each scored 0–100. Each bar is that input's sub-score; the figure is the points it added to the 100-point composite (weight × sub-score).
- Cash flow +14.8/30.0
- ARV discount +5.6/15.0
- DSCR +4.5/10.0
- Livability +4.1/5.0
- 1% rule +3.5/10.0
- Rent growth +3.1/5.0
- Schools +2.7/10.0
- Condition / age +2.5/5.0
- Appreciation +0.0/10.0
$229,900
🖨 Deal sheet 📄 Offer letter ✓ Due diligence
Listing remarks MLS
Great Investment Property. Raised Ranch with finished basement with full bath. Come see this 3 bedroom 3 bath home on a bigger than normal lot. Seller will be reviewing all offers after 5p. m. Monday.
Key facts
- 1,700 sq ft lot
- 2 garage spots
- Built 1977
Property features AI
Finance
- HOA & community: No association fees
Exterior
- Parking: Attached garage with rear-facing garage entrance; 2-car garage; Basement access to garage
- Utilities: Public water; Public sewer; Cable available; High-speed internet available
- Home design: Single-family residence; Residential property; Raised 1.5 story; Estimated above-grade living area reported
- Construction: Vinyl siding; Composition roof; Has daylight basement
- Exterior features: Deck; Metal fencing; City lot
Interior
- Kitchen: Dishwasher; Disposal; Microwave; Refrigerator; Free-standing electric oven
- Bedrooms: 3 bedrooms (all on the main level)
- Flooring: Carpet in select rooms
- Bathrooms: 2 full bathrooms; Main-level bathroom with shower over tub; Basement bathroom with shower only
- Heating & cooling: Natural gas hot water heating; Electric cooling
- Interior features: Thermal windows; Kit/dining combo; Raised 1.5 story floor plan
- Laundry & utility: Laundry located in the basement
Neighborhood map
What this means for you Summary
Snapshot
- This is a 3-bed/1.5-bath single-family listed at $230k.
Deal economics
- At list price, monthly cash flow is $65 ($781/yr) — positive.
- The deal already cash-flows at list — no discount required.
- To meet the 1% rule (rent ≥ 1% of price), the offer needs to be $195k (15.0% below list).
- Recommended offer: $195k (15.0% below list) — sets the bar for 1% rule.
- Cap rate 6.6% vs local median 5.0% in Independence — top-decile yield for the area; either an underpriced asset or a hidden risk that comps aren't pricing in. Stress-test before assuming the spread holds.
Location & tenants
- Location reads 82/100 on livability (#10 in MO, #1,296 nationally) — a professional / high-income tenant draw. Strengths: amenities A+, commute A+, cost of living A+; Watch: employment D+, crime F.
- Independence 30 (suburban): math 26% / reading 38% proficiency, ranked #252 of 324 in MO (top 78%) — families likely to look elsewhere, expect single-tenant / working-renter base with shorter leases.
- Zoned schools: Little Blue Elementary (math 42% / reading 47%, grade F, #413 of 1,115 statewide, top 42%, 295 students, 53% FRL); Truman High (math 18% / reading 34%, grade F, #430 of 521 statewide, top 83%, 1,662 students, 52% FRL).
- Market conditions: Rents rising (+2.3%/yr); 70 active listings in the ZIP; 9 comparable units currently listed for rent nearby; rentals leasing fast (median 2d on market — plan ~1-2 weeks tenant-placement turnaround); 4,002 units permitted in Jackson County in 2024 (2,271 in 5+ unit buildings).
- This rent runs 33% of the median local income ($71k/yr) — at the standard rent-burdened threshold; future hikes will face affordability resistance.
Forward outlook
- Local home prices are declining (-3.0%/yr); year-one equity from $2k of loan paydown is wiped out by about $7k of value loss. Plan a longer hold.
- Jackson County population projected at +4% by 2050 — modest demand growth; plan on rents tracking national, not racing it.
Negotiation context
- Only 3 days on market — expect competitive offers; lowballing is unlikely to land.
- 2 sale attempts since 4y ago with the ask held roughly flat each time — persistent listings suggest the price (not the market) is what's stuck; bring a comps-based counter.
Questions for the listing agent
- Built in 1977 — when were the roof, HVAC, electrical panel, plumbing, and water heater last replaced?
- Is there a deadline driving the sale (1031 exchange, divorce, estate, relocation)? That informs how much negotiation room exists.
- Crime grade is F in this area — have there been break-ins, vandalism, or insurance claims at this property in the last 3 years? What carrier currently insures it and at what premium?
- The area grade is low — what's the realistic commute time and amenity access for the typical tenant pool here? Any planned neighborhood developments (good or bad) we should know about?
- What's the average days-on-market for RENTAL listings here right now (not sales)? A rising rental-DOM trend means longer vacancies and softer asking-rent achievability than the comps imply.
- What's the recent tenant-quality profile in this submarket — average credit score on applications, eviction rate, late-payment / NSF rate, and stable-employment percentage? A property-management company in the area should have these aggregated.
- How much new for-sale + rental construction is in the pipeline within 1–3 miles? Heavy new supply typically softens prices + rents 12–24 months out; constrained supply supports both.
Investment metrics
- 1% rule
- 0.85% ✗
- Cap rate
- 6.63%
- Cash-on-cash
- 1.21%
- DSCR
- 1.05
- GRM
- 9.8
CMA / ARV
- ARV (median comp)
- $220,731
- List price
- $229,900
- Delta
- 4.15%
- Verdict
- FAIR
- Comps
- 18 within 1.0 mi
Show comp detail 2 sales within ~0.75 mi
| Address | Dist | Beds/Ba | Sqft | Sold | Price | $/sf | Match |
|---|---|---|---|---|---|---|---|
| 3013 S Ponca Dr | 0.50mi | 3/1.5 | 1,208 (+12%) | 20mo | $190,000 | $157 | 39 |
| 3328 S Selsa Rd | 0.50mi | 2/2.0 (-1) | 1,231 (+14%) | 14mo | $229,900 | $187 | 34 |
Match score weights: distance 35% · size 25% · config 20% · recency 20%. Top-matched comps best support the ARV.
Projected returns pro-forma
-3.0% appreciation · 2.32% rent growth · sell at horizon
- IRR
- -15.1%
- Equity multiple
- 0.46×
- Total profit
- $-34,475
- Equity at exit
- $34,279
- IRR
- -7.7%
- Equity multiple
- 0.53×
- Total profit
- $-30,214
- Equity at exit
- $19,878
Cash invested: $64,372 (down + closing). Projections, not guarantees.
Landlord ↔ Tenant lean methodology
- Overall (STATE)
- 81 Strongly Landlord-Friendly
- State Missouri
- 81 Strongly Landlord-Friendly · R+10
- County
- — inherits STATE
- City
- — inherits STATE
ZIP-level market 64057
- Rents YoY
- 2.3%
- Active inventory
- 70
- Price-to-rent
- 9.8×
Monthly cashflow live
- Estimated rent
- $1,953 high interval (Pro) →
- Mortgage (P&I)
- −$1,206
- Tax from tax record
- −$177 /mo · $2,119/yr
- Insurance
- −$96
- HOA
- −$0
- Vacancy / Maint / Mgmt
- −$410
- Net cashflow
- $65
Break-even live
UW: 25.0% down · 7.5% · 30yr · 1.5% tax · 5.0% vac · 8.0% maint · 8.0% mgmt
Financing live
Cash to close
- Down payment
- $57,475
- Closing costs
- $6,897
- Reserves months
- —
- Total cash needed
- —
Loan-product check · same deal, 3 products live
Conventional
25% down · 7.5% · 30yr
- Down + closing
- —
- Monthly P&I
- —
- Monthly cashflow
- —
- DSCR
- —
- Eligible?
- —
Personal DTI + credit; lowest rate.
DSCR
20% down · 8.5% · 30yr
- Down + closing
- —
- Monthly P&I
- —
- Monthly cashflow
- —
- DSCR
- —
- Eligible?
- —
No personal income docs; deal must DSCR.
Hard money
10% down · 12.0% · 12mo
- Down + closing
- —
- Monthly P&I
- —
- Monthly cashflow
- —
- DSCR
- —
- Eligible?
- —
Short-term bridge; refi at stabilization.
Rent comps 9 comps
| Address | Beds | Baths | Sqft | Rent | $/sqft | DOM | Units | Dist |
|---|---|---|---|---|---|---|---|---|
| 19204 E 31st Ter S Independence, MO | 3.0 | 2.0 | 1206 | $2,020 | $1.67 | 43d | 1 | 0.07mi |
| 2972 Iva Dr Independence, MO | 3.0 | 2.0 | 1442 | $2,005 | $1.39 | 43d | 1 | 0.08mi |
| 19501 E 31st Terrace Dr S Independence, MO | 2.0 | 2.0 | 1457 | $2,016 | $1.38 | 1d | 22 | 0.08mi |
| 2916 Iva Dr Independence, MO | 3.0 | 1.5 | 1480 | $2,100 | $1.42 | 43d | 1 | 0.18mi |
| 19012 E 37th Ter S Independence, MO | 1.0–2.0 | 1.0–2.0 | 936 | $1,515 | $1.62 | 1d | 1 | 0.87mi |
| 20201 E 23rd Ter Ct S Independence, MO | 4.0 | 3.0 | 1427 | $2,595 | $1.82 | 1d | 1 | 1.07mi |
| 19700 E 39th Pl Independence, MO | 1.0–2.0 | 1.0–2.0 | 832 | $1,697 | $2.04 | 1d | 7 | 1.20mi |
| 3950 S Jackson Dr Independence, MO | 1.0–2.0 | 1.0–2.0 | 886 | $1,495 | $1.69 | 1d | 30 | 1.21mi |
| 19401 E 40th Street Ct S Independence, MO | 1.0–2.0 | 1.0 | 670 | $1,530 | $2.28 | 1d | 12 | 1.47mi |
Listing history 8 events
-
2026-05-17status Pending 687-char remark
-
2026-05-15$229,900 Active 687-char remark
-
2026-05-15historical $229,900 687-char remark
-
2022-09-29soldstatus Closed 200-char remark
Show marketing remark (200 chars)
Great Investment Property. Raised Ranch with finished basement with full bath. Come see this 3 bedroom 3 bath home on a bigger than normal lot. Seller will be reviewing all offers after 5p. m. Monday.
-
2022-09-29soldstatus
Show marketing remark (200 chars)
Great Investment Property. Raised Ranch with finished basement with full bath. Come see this 3 bedroom 3 bath home on a bigger than normal lot. Seller will be reviewing all offers after 5p. m. Monday.
-
2022-08-30status Pending 200-char remark
Show marketing remark (200 chars)
Great Investment Property. Raised Ranch with finished basement with full bath. Come see this 3 bedroom 3 bath home on a bigger than normal lot. Seller will be reviewing all offers after 5p. m. Monday.
-
2022-08-26$175,000 Active 200-char remark
Show marketing remark (200 chars)
Great Investment Property. Raised Ranch with finished basement with full bath. Come see this 3 bedroom 3 bath home on a bigger than normal lot. Seller will be reviewing all offers after 5p. m. Monday.
-
1996-01-03soldstatus
ⓘ Source: listings_history table (triggers on properties + properties_extension) + one-shot
backfill from property_details.listing_events for pre-trigger history.
Tax reassessment forecast MO · Resets to sale price
- Current annual tax
- $2,119 · $177/mo
- Projected year-2 tax
- $2,230 · $186/mo
- Expected delta
- +$111/yr (+$9/mo · 5.2%)
ⓘ Screening estimate from a state-policy table — verify with the county assessor before closing.
Climate risk First Street
- Flood 1/10 Low FEMA zone X (unshaded) · 0% chance over 30 yrs
- Wildfire 3/10 Moderate
- Heat 4/10 Moderate 7 d/yr ≥108°F today · 17 d/yr by 30 yrs out
- Wind 2/10 Low
- Air quality 3/10 Moderate 3 unhealthy d/yr today · 3 by 30 yrs out
Nearby sold comps map
Loading sold comps map…
Walkable amenities ~0.75 mi
Loading nearby amenities…
Taxation est. · year 1
- Rental income
- $23,439
- − Mortgage interest
- −$12,878
- − Property taxes
- −$2,119
- − Insurance
- −$1,150
- − Repairs & maintenance
- −$1,875
- − Management
- −$1,875
- − Depreciation
- −$6,688
- Taxable loss
- −$3,146
- Est. tax savings @ 24.0%
- +$755
- After-tax cash flow
- $1,536/yr
For passive investors: Depreciation is non-cash, so a rental often shows a tax loss while cash-flowing — sheltering income. Rental losses are passive: they offset passive income freely, and up to $25,000/yr can offset ordinary (W-2) income if you actively participate and your MAGI is under $100k (phasing out to $0 by $150k); unused losses carry forward. On sale, claimed depreciation is recaptured at up to 25%, and gains may owe capital-gains tax (a 1031 exchange can defer both). Figures are a year-1 estimate at your 24.0% rate — not tax advice; consult a CPA.
Schools (NCES district)
- District
- Independence 30
- NCES district ID
- 2915480
- Math proficiency
- 26% ▼ -8.00%
- Reading proficiency
- 38% ▼ -5.00%
- Median HH income
- $41,843
- Composite
- 27.04/100
- National rank
- #7054
- State rank
- #252 of 324 in MO
Livability — Independence
- Score
- 82/100
- State rank
- #10
- US rank
- #1296
Category grades
Schools grade is shown separately in the Schools card above.
Census & demographics
- Census place
- Independence, MO
- County
- Jackson County · 687,798 people
- City population
- 117,675
- Metro
- Kansas City, MO-KS
- Population (ZIP)
- 14,328
- Household income
- $71,402
- Rent vs Own
- Severe rent burden
- 637.0
Population outlook (Jackson County) Hauer SSP2
- Today (2025)
- 719,589 people
- By 2030
- 731,456 · +1.6%
- By 2040
- 746,689 · +3.8%
- By 2050
- 749,289 · +4.1%
- By 2075
- 736,227 · +2.3%
- By 2100
- 668,210 · -7.1%
Race, ethnicity, and origin ACS 2023
- Neighborhood character
- Predominantly White (74%)
- Race & ethnicity
- White 74% Black 14% Two or more races 4% Hispanic / Latino 4% Asian 2% Pacific Islander 2%
- Common ancestry
- Italian 8% Slovak 3% Lithuanian 2%
- Foreign-born
- 2%
- Languages at home
- 97% English-only · Spanish 1% Vietnamese 1% Other Indo-European 1%
Political lean MEDSL · Jackson
- 2024 margin
- D (+19.3) · D 58.9% · R 39.5% · Other 1.6%
- 2008→2024 swing
- -6.1pp toward R · 2008: 25.4pp · 2024: 19.3pp
- All cycles
- 2024: D+19.3 2020: D+22.0 2016: D+16.6 2012: D+19.0 2008: D+25.4
Not yet ingested
- Civics
- —
Market trends
- HPI YoY
- ▼ -178.01%
- Current HPI
- 230.0639
- Rent YoY
- ▲ 2.32%
- Metro
- Kansas City, MO-KS
- State GDP YoY
- ▲ 1.84%
- F500 in state
- 20
Industry mix (Fortune 500 HQ in MO)
| Industry | F500 HQs | Revenue |
|---|---|---|
| Healthcare | 1 | $163B |
|
||
| Insurance | 1 | $21B |
|
||
| Industrial Technology | 1 | $17B |
|
||
| Retail | 1 | $16B |
|
||
| Industrial Distribution | 1 | $10B |
|
||
| Utilities | 1 | $9B |
|
||
Price history
+31.4% since first listed8 events — show timeline
- 2026-05-17 Pending — Heartland MLS as Distributed by MLS Grid
- 2026-05-15 Listed $229,900 Heartland MLS as Distributed by MLS Grid
- 2026-05-15 Coming Soon $229,900 Heartland MLS as Distributed by MLS Grid
- 2022-09-29 Sold (Public Records) — Public Records
- 2022-09-29 Sold (MLS) — Heartland MLS as Distributed by MLS Grid
- 2022-08-30 Pending — Heartland MLS as Distributed by MLS Grid
- 2022-08-26 Listed $175,000 Heartland MLS as Distributed by MLS Grid
- 1996-01-03 Sold (Public Records) — Public Records
Property tax history
+2.9%/yrLatest (2025): $2,119 · -3.6% YoY. Source: county tax records.
Cash-flow waterfall
monthlySold comps — $/sqft
last 12 mo · ≤1 miLoading sold comps…