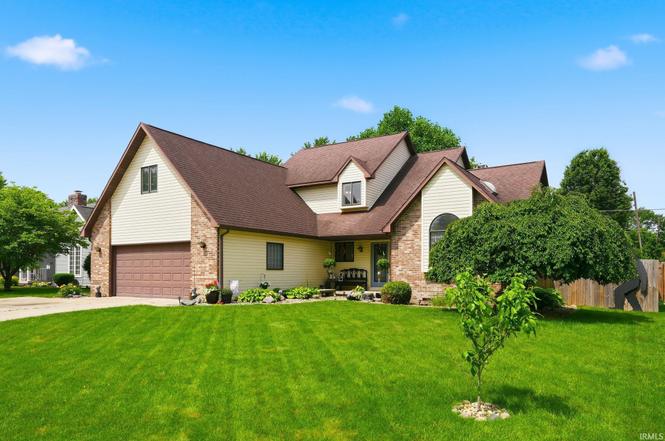
2913 S Scott Dr · Yorktown, IN
Flood risk 1/10 · Minimal
- FEMA flood zone
- X (unshaded)
- Chance of flooding over 30 yrs
- 0.0%
- Est. flood insurance / yr
- $507 – $1,088
Fire risk 1/10 · Minimal
- Est. fire insurance / yr
- $717 – $1,331
Heat risk 3/10 · Minor
- Hot days now (above 100°F)
- 7 days/yr
- Hot days in 30 yrs
- 18 days/yr
Wind risk 2/10 · Minimal
- Chance of severe wind over 30 yrs
- 1.0%
Air-quality risk 2/10 · Minimal
- Unhealthy air days now
- 1 days/yr
- Unhealthy air days in 30 yrs
- 2 days/yr
Risk factors via First Street. Map © Google.
Why this score? — see what drove the F grade
The composite is a weighted blend of 9 inputs, each scored 0–100. Each bar is that input's sub-score; the figure is the points it added to the 100-point composite (weight × sub-score).
- Cash flow +13.5/30.0
- Schools +4.3/10.0
- DSCR +4.1/10.0
- Livability +3.7/5.0
- 1% rule +2.8/10.0
- Rent growth +2.5/5.0
- Condition / age +2.5/5.0
- ARV discount +0.0/15.0
- Appreciation +0.0/10.0
$350,000
🖨 Deal sheet (PDF) 📄 Offer letter ✓ Due diligence
Listing remarks
Beautiful home in Yorktown located on a quiet cul-de-sac. Large backyard totaling more that 1/4 acre (. 275) is easy to enjoy on the large deck. Enter the home to a stunning wide staircase with balcony overlooking the living room. Living room offers high vaulted ceilings with the view of the balcony. Eat-In Kitchen has plenty of cabinets and solid surface countertops. Primary bedroom suite is on the main level. Contains a custom shower with rain shower head, jetted soak tub, two walk-in closets, bidet, and access to the back deck. Laundry room with built-in iron board and a half bath finish out the main level. 2nd story has three bedrooms; all with walk-in closets and a spacious full bath.
Key facts
- Wide staircase
- Custom shower
- Jetted soak tub
Tags
Property features AI
Finance
- HOA & community: No association amenities
Exterior
- Parking: Attached garage with garage door opener; Concrete driveway with off-street parking; 2-car garage
- Security: Smoke detectors
- Utilities: Public water; Public sewer; Generator for electric
- Home design: Single-family residential (site-built); Two stories
- Construction: Brick and vinyl siding exterior; Shingle roof; Crawl space foundation; Built as site-built home
- Exterior features: Balcony; Deck (covered); Covered porch; Full fencing; Shed(s)
Interior
- Kitchen: Disposal; Dishwasher; Microwave; Refrigerator; Electric oven and range; Water purifier; Eat-in kitchen
- Bedrooms: Master on main level
- Flooring: Vinyl
- Bathrooms: Two full bathrooms; One half bathroom
- Heating & cooling: Central air conditioning; Ceiling fans; Forced air heating; Natural gas heating; Fireplace insert
- Interior features: Vaulted ceilings; Walk-in closets; Ceiling fans; Eat-in kitchen; Bidet; Master bedroom on main level; Fireplace with insert in living room
- Laundry & utility: Washer hookup on main level; Electric dryer hookup; Washer included; Dryer included; Water softener owned; Tankless and gas water heaters; Water heater; Sump pump in crawl space basement
Neighborhood map
What this means for you Summary
Snapshot
- This is a 4-bed/2.5-bath single-family listed at $350k.
Deal economics
- At list price, monthly cash flow is $12 ($148/yr) — positive.
- The deal already cash-flows at list — no discount required.
- To meet the 1% rule (rent ≥ 1% of price), the offer needs to be $272k (22.4% below list).
- Recommended offer: $272k (22.4% below list) — sets the bar for 1% rule.
- Cap rate 6.3% vs local median 3.5% in Yorktown — top-decile yield for the area; either an underpriced asset or a hidden risk that comps aren't pricing in. Stress-test before assuming the spread holds.
Location & tenants
- Location reads 73/100 on livability (#99 in IN) — a middle-class / working-renter tenant base. Strengths: crime A+, cost of living A+, housing A+; Watch: health & safety D, amenities F, commute F.
- Yorktown Community Schools (suburban): math 49% / reading 51% proficiency, ranked #48 of 301 in IN (top 16%) — acceptable for families but not a draw, mixed tenant base, ~2y average lease.
- Zoned schools: Yorktown Elementary School (math 62% / reading 49%, grade C, #188 of 994 statewide, top 19%, 672 students, 36% FRL); Yorktown Middle School (math 38% / reading 44%, grade F, #113 of 330 statewide, top 35%, 656 students, 37% FRL); Yorktown High School (math 42% / reading 77%, grade C+, #49 of 369 statewide, top 16%, 793 students, 33% FRL).
- Market conditions: 48 active listings in the ZIP; 1 comparable units currently listed for rent nearby; 171 units permitted in Delaware County in 2024 (57 in 5+ unit buildings).
Forward outlook
- Local home prices are declining (-3.0%/yr); year-one equity from $2k of loan paydown is wiped out by about $10k of value loss. Plan a longer hold.
- Delaware County population projected at -11% by 2050 — secular population decline; favor cash flow + early exit over multi-decade hold.
Negotiation context
- Only 6 days on market — expect competitive offers; lowballing is unlikely to land.
Questions for the listing agent
- Is there a deadline driving the sale (1031 exchange, divorce, estate, relocation)? That informs how much negotiation room exists.
- Schools are B-rated — typically a magnet for longer-tenancy family renters. What's the average tenant stay here, and is there a school-zone premium baked into asking?
- The area grade is low — what's the realistic commute time and amenity access for the typical tenant pool here? Any planned neighborhood developments (good or bad) we should know about?
- What's the average days-on-market for RENTAL listings here right now (not sales)? A rising rental-DOM trend means longer vacancies and softer asking-rent achievability than the comps imply.
- What's the recent tenant-quality profile in this submarket — average credit score on applications, eviction rate, late-payment / NSF rate, and stable-employment percentage? A property-management company in the area should have these aggregated.
- How much new for-sale + rental construction is in the pipeline within 1–3 miles? Heavy new supply typically softens prices + rents 12–24 months out; constrained supply supports both.
Investment metrics
- 1% rule
- 0.78% ✗
- Cap rate
- 6.34%
- Cash-on-cash
- 0.15%
- DSCR
- 1.01
- GRM
- 10.7
CMA / ARV
- ARV (on-the-fly)
- $238,760
- Comps found
- 5
Show comp detail 5 sales within ~0.75 mi
| Address | Dist | Beds/Ba | Sqft | Sold | Price | $/sf | Match |
|---|---|---|---|---|---|---|---|
| 8009 W South Dr | 0.64mi | 4/3.0 | 2,580 (+2%) | 11mo | $239,900 | $93 | 56 |
| 8116 W Weller St | 0.64mi | 4/2.5 | 2,294 (-10%) | 9mo | $216,000 | $94 | 46 |
| 2421 S Market St | 0.39mi | 3/1.0 (-1) | 2,192 (-14%) | 3mo | $168,000 | $77 | 46 |
| 2770 S Andrews Rd | 0.49mi | 4/2.0 | 2,181 (-14%) | 12mo | $234,900 | $108 | 42 |
| 4040 S County Road 550 W | 0.66mi | 3/2.0 (-1) | 2,299 (-10%) | 20mo | $260,000 | $113 | 30 |
Match score weights: distance 35% · size 25% · config 20% · recency 20%. Top-matched comps best support the ARV.
Projected returns pro-forma
-3.0% appreciation · 3.0% rent growth · sell at horizon
- IRR
- -16.1%
- Equity multiple
- 0.43×
- Total profit
- $-56,065
- Equity at exit
- $52,186
- IRR
- -7.9%
- Equity multiple
- 0.51×
- Total profit
- $-48,357
- Equity at exit
- $30,262
Cash invested: $98,000 (down + closing). Projections, not guarantees.
Landlord ↔ Tenant lean methodology
- Overall (STATE)
- 90 Strongly Landlord-Friendly
- State Indiana
- 90 Strongly Landlord-Friendly · R+11
- County
- — inherits STATE
- City
- — inherits STATE
ZIP-level market 47396
- Home prices YoY
- -14.6%
- Active inventory
- 48
- Price-to-rent
- 10.7×
Monthly cashflow live
- Estimated rent
- $2,715 medium interval (Pro) →
- Mortgage (P&I)
- −$1,835
- Tax from tax record
- −$151 /mo · $1,815/yr
- Insurance
- −$146
- HOA
- −$0
- Vacancy / Maint / Mgmt
- −$570
- Net cashflow
- $12
Break-even live
Sensitivity live
| Price | -10% $210 | -5% $111 | +0% $12 | +5% $-87 | +10% $-186 |
|---|---|---|---|---|---|
| Rent | -10% $-202 | -5% $-95 | +0% $12 | +5% $120 | +10% $227 |
| Rate | -1.0pp $189 | -0.5pp $101 | base $12 | +0.5pp $-78 | +1.0pp $-171 |
UW: 25.0% down · 7.5% · 30yr · 1.5% tax · 5.0% vac · 8.0% maint · 8.0% mgmt
Financing live
Cash to close
- Down payment
- $87,500
- Closing costs
- $10,500
- Reserves months
- —
- Total cash needed
- —
Loan-product check · same deal, 3 products live
Conventional
25% down · 7.5% · 30yr
- Down + closing
- —
- Monthly P&I
- —
- Monthly cashflow
- —
- DSCR
- —
- Eligible?
- —
Personal DTI + credit; lowest rate.
DSCR
20% down · 8.5% · 30yr
- Down + closing
- —
- Monthly P&I
- —
- Monthly cashflow
- —
- DSCR
- —
- Eligible?
- —
No personal income docs; deal must DSCR.
Hard money
10% down · 12.0% · 12mo
- Down + closing
- —
- Monthly P&I
- —
- Monthly cashflow
- —
- DSCR
- —
- Eligible?
- —
Short-term bridge; refi at stabilization.
Rent comps 1 comps
| Address | Beds | Baths | Sqft | Rent | $/sqft | DOM | Units | Dist |
|---|---|---|---|---|---|---|---|---|
| 9860 W Smith St Yorktown, IN | 2.0–3.0 | 1.0–2.0 | 1526 | $2,715 | $1.78 | 46d | 2 | 0.78mi |
Listing history 6 events
-
2026-06-21days on market $350,000 Active 6 DOM
-
2026-06-19days on market $350,000 Active 4 DOM
-
2026-06-18days on market $350,000 Active 3 DOM
-
2026-06-17days on market $350,000 Active 2 DOM
-
2026-06-15remarks 699-char remark
-
2026-06-15$350,000 Active 1 DOM
ⓘ Source: listings_history table (triggers on properties + properties_extension) + one-shot
backfill from property_details.listing_events for pre-trigger history.
Tax reassessment forecast IN · Partial reset (capped growth)
- Current annual tax
- $1,815 · $151/mo
- Projected year-2 tax
- $2,395 · $200/mo
- Expected delta
- +$580/yr (+$48/mo · 32.0%)
ⓘ Screening estimate from a state-policy table — verify with the county assessor before closing.
Climate risk First Street
- Flood 1/10 Low FEMA zone X (unshaded) · 0% chance over 30 yrs
- Wildfire 1/10 Low
- Heat 3/10 Moderate 7 d/yr ≥100°F today · 18 d/yr by 30 yrs out
- Wind 2/10 Low 100% chance of damaging wind over 30 yrs
- Air quality 2/10 Low 1 unhealthy d/yr today · 2 by 30 yrs out
Nearby sold comps map
Loading sold comps map…
Walkable amenities ~0.75 mi
Loading nearby amenities…
Taxation est. · year 1
- Rental income
- $32,580
- − Mortgage interest
- −$19,605
- − Property taxes
- −$1,815
- − Insurance
- −$1,750
- − Repairs & maintenance
- −$2,606
- − Management
- −$2,606
- − Depreciation
- −$10,182
- Taxable loss
- −$5,985
- Est. tax savings @ 24.0%
- +$1,436
- After-tax cash flow
- $1,584/yr
For passive investors: Depreciation is non-cash, so a rental often shows a tax loss while cash-flowing — sheltering income. Rental losses are passive: they offset passive income freely, and up to $25,000/yr can offset ordinary (W-2) income if you actively participate and your MAGI is under $100k (phasing out to $0 by $150k); unused losses carry forward. On sale, claimed depreciation is recaptured at up to 25%, and gains may owe capital-gains tax (a 1031 exchange can defer both). Figures are a year-1 estimate at your 24.0% rate — not tax advice; consult a CPA.
Schools (NCES district)
- District
- Yorktown Community Schools
- NCES district ID
- 1807230
- Math proficiency
- 49% ▼ -8.00%
- Reading proficiency
- 51% ▼ -2.00%
- Median HH income
- $55,611
- Composite
- 43.32/100
- National rank
- #3036
- State rank
- #48 of 301 in IN
Livability — Yorktown
- Score
- 73/100
- State rank
- #99
- US rank
- #5439
Category grades
Schools grade is shown separately in the Schools card above.
Census & demographics
- Census place
- Yorktown, IN
- City population
- 7,808
- Population (ZIP)
- 7,808
Population outlook (Delaware County) Hauer SSP2
- Today (2025)
- 113,036 people
- By 2030
- 111,313 · -1.5%
- By 2040
- 106,432 · -5.8%
- By 2050
- 100,747 · -10.9%
- By 2075
- 91,000 · -19.5%
- By 2100
- 80,687 · -28.6%
Race, ethnicity, and origin ACS 2023
- Neighborhood character
- Predominantly White (95%)
- Race & ethnicity
- White 95% Two or more races 3% Asian 2%
- Common ancestry
- Italian 4% Slovak 3% Romanian 1%
- Foreign-born
- 1%
- Languages at home
- 98% English-only · Other Indo-European 1%
Political lean MEDSL · Delaware
- 2024 margin
- R (+15.8) · D 41.2% · R 57.0% · Other 1.8%
- 2008→2024 swing
- -30.8pp toward R · 2008: 15.0pp · 2024: -15.8pp
- All cycles
- 2024: R+15.8 2020: R+13.2 2016: R+13.7 2012: D+3.1 2008: D+15.0
Not yet ingested
- Civics
- —
Market trends
- HPI YoY
- ▼ -35.12%
- Current HPI
- 205.7559
- Rent YoY
- —
- Metro
- —
- State GDP YoY
- ▲ 2.90%
- F500 in state
- 18
Industry mix (Fortune 500 HQ in IN)
| Industry | F500 HQs | Revenue |
|---|---|---|
| Industrial Machinery | 2 | $37B |
|
||
| Healthcare | 1 | $177B |
|
||
| Pharmaceuticals | 1 | $45B |
|
||
| Metals / Steel | 1 | $18B |
|
||
| Agriculture | 1 | $17B |
|
||
| Packaging | 1 | $12B |
|
||
Price history
1 event — show timeline
- 2026-06-15 Listed $350,000 IRMLS
Property tax history
-1.6%/yrLatest (2024): $1,815 · -1.0% YoY. Source: county tax records.
Cash-flow waterfall
monthlySold comps — $/sqft
last 12 mo · ≤1 miLoading sold comps…