 Multi-family
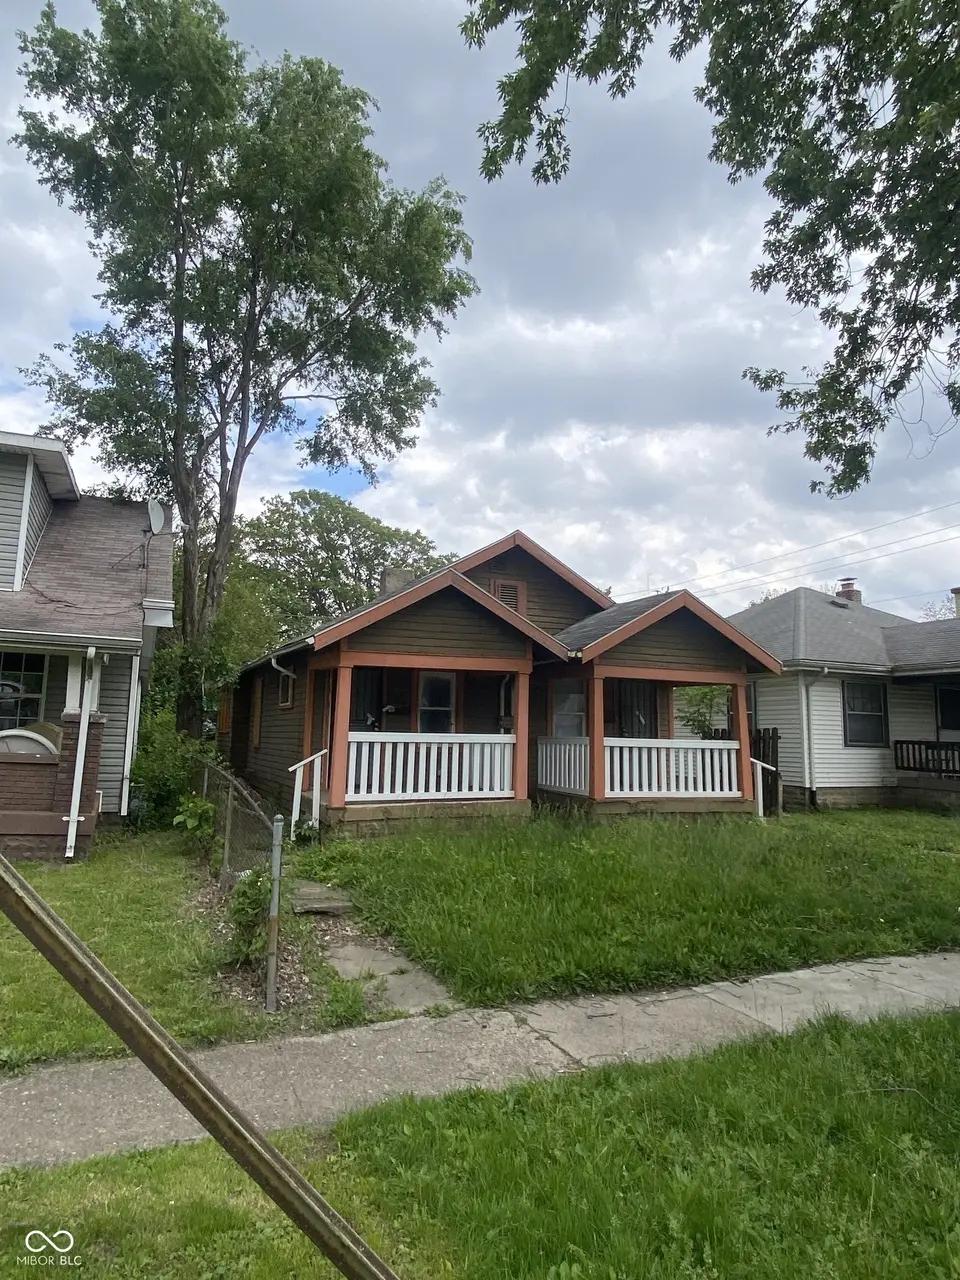
909 N Ewing St · Indianapolis city (balance), IN
Flood risk 1/10 · Minimal
- FEMA flood zone
- X (unshaded)
- Chance of flooding over 30 yrs
- 0.0%
- Est. flood insurance / yr
- $473 – $860
Fire risk 1/10 · Minimal
- Est. fire insurance / yr
- $717 – $1,331
Heat risk 4/10 · Minor
- Hot days now (above 102°F)
- 7 days/yr
- Hot days in 30 yrs
- 19 days/yr
Wind risk 2/10 · Minimal
- Chance of severe wind over 30 yrs
- —
Air-quality risk 4/10 · Minor
- Unhealthy air days now
- 5 days/yr
- Unhealthy air days in 30 yrs
- 7 days/yr
Risk factors via First Street. Map © Google.
Why this score? — see what drove the D- grade
The composite is a weighted blend of 9 inputs, each scored 0–100. Each bar is that input's sub-score; the figure is the points it added to the 100-point composite (weight × sub-score).
- ARV discount +15.0/15.0
- Cash flow +7.4/30.0
- Rent growth +4.3/5.0
- 1% rule +3.5/10.0
- Livability +2.5/5.0
- Condition / age +2.5/5.0
- DSCR +1.5/10.0
- Schools +1.4/10.0
- Appreciation +0.0/10.0
$100,000
🖨 Deal sheet 📄 Offer letter ✓ Due diligence
Multi-family units
County records classify this as Multi-Family (2-4 Unit). Listing-text estimate: 1 unit. estimate disagrees with records
Listing remarks
Two doors. One century-old craftsman that's been quietly holding down the near-eastside since 1920. The exterior says everything a seasoned investor needs to hear - covered porch, decorative trim columns, and dual-entry configuration. Both units mirror each other in layout. They're currently configured as 2 separate 1bd/1ba units but have the potential for reconfiguration to a larger single family layout. Each side has had renovations started but need finishing. Showings are now available. The 46201 rental market is not waiting around, and neither is this one.
Key facts
- Covered porch
- Landscaping
- 4,443 sq ft lot
Tags
Property features AI
Finance
- Other: Property conversion: No
- Financial info: Gross income and expenses reported as $0; No units listed for rental income
Exterior
- Utilities: No solid waste service
- Home design: Duplex (residential income); One story
- Construction: <1/4 acre lot (0.1 acre)
- Exterior features: Vacant current use; Access road
Interior
- Bedrooms: 1-bedroom unit (one level)
- Interior features: Finished basement
Neighborhood map
What this means for you Summary
Snapshot
- This is a 1-bed/1.0-bath multifamily listed at $100k.
Deal economics
- At list price, monthly cash flow is $-129 ($-2k/yr) — negative.
- To cash-flow at today's rent, offer at most $77k (22.7% below list).
- To meet the 1% rule (rent ≥ 1% of price), the offer needs to be $85k (14.8% below list).
- Recommended offer: $77k (22.7% below list) — sets the bar for cash-flow.
Location & tenants
- Location reads: area grade D — affects rentability + tenant quality, not the cash-flow math above.
- Indianapolis Public Schools (urban): math 14% / reading 20% proficiency, ranked #286 of 301 in IN (top 95%) — low school quality limits family demand, transient renter base, plan for 1-2y turnover; 77% free/reduced lunch — lower-income household profile, screen leases tightly.
- Market conditions: Rents rising fast (+7.3%/yr); 480 active listings in the ZIP; 40 comparable units currently listed for rent nearby; rentals at typical pace (median 24d on market — plan ~3-4 weeks tenant-placement turnaround); 1,906 units permitted in Marion County in 2024 (621 in 5+ unit buildings).
Forward outlook
- Local home prices are declining (-3.0%/yr); year-one equity from $691 of loan paydown is wiped out by about $3k of value loss. Plan a longer hold.
- Marion County population projected at +18% by 2050 — long-run rental-demand tailwind backs the buy-and-hold thesis.
Negotiation context
- Only 3 days on market — expect competitive offers; lowballing is unlikely to land.
- 2 sale attempts since 19y ago with the ask held roughly flat each time — persistent listings suggest the price (not the market) is what's stuck; bring a comps-based counter.
Risks & watch-outs
- Watch-outs: property tax is 2.8% of price; built in 1920 — expect roof / HVAC / electrical / plumbing capex.
Questions for the listing agent
- What do current leases actually rent for vs. the listed asking? Can we see a recent rent roll and the last 12 months of T-12 income?
- Built in 1920 — when were the roof, HVAC, electrical panel, plumbing, and water heater last replaced?
- Property tax is high relative to price — has the assessment been appealed recently, and will the sale trigger a re-assessment?
- Is there a deadline driving the sale (1031 exchange, divorce, estate, relocation)? That informs how much negotiation room exists.
- The area grade is low — what's the realistic commute time and amenity access for the typical tenant pool here? Any planned neighborhood developments (good or bad) we should know about?
- What's the average days-on-market for RENTAL listings here right now (not sales)? A rising rental-DOM trend means longer vacancies and softer asking-rent achievability than the comps imply.
- What's the recent tenant-quality profile in this submarket — average credit score on applications, eviction rate, late-payment / NSF rate, and stable-employment percentage? A property-management company in the area should have these aggregated.
- How much new apartment / multifamily construction is in the pipeline within 1–3 miles? Heavy new supply (>2% of stock underway) typically softens rents 12–24 months out; light construction supports rent growth.
Investment metrics
- 1% rule
- 0.85% ✗
- Cap rate
- 4.75%
- Cash-on-cash
- -5.52%
- DSCR
- 0.75
- GRM
- 9.8
CMA / ARV
- ARV (on-the-fly)
- $148,258
- Comps found
- 1
Show comp detail 1 sale within ~0.75 mi
| Address | Dist | Beds/Ba | Sqft | Sold | Price | $/sf | Match |
|---|---|---|---|---|---|---|---|
| 3419 E 9th St | 0.13mi | 2/1.0 (+1) | 672 (+15%) | 24mo | $170,000 | $253 | 45 |
Match score weights: distance 35% · size 25% · config 20% · recency 20%. Top-matched comps best support the ARV.
Projected returns pro-forma
-3.0% appreciation · 7.31% rent growth · sell at horizon
- IRR
- -20.1%
- Equity multiple
- 0.27×
- Total profit
- $-20,468
- Equity at exit
- $14,910
- IRR
- -4.8%
- Equity multiple
- 0.62×
- Total profit
- $-10,768
- Equity at exit
- $8,646
Cash invested: $28,000 (down + closing). Projections, not guarantees.
Landlord ↔ Tenant lean methodology
- Overall (STATE)
- 90 Strongly Landlord-Friendly
- State Indiana
- 90 Strongly Landlord-Friendly · R+11
- County
- — inherits STATE
- City
- — inherits STATE
ZIP-level market 46201
- Home prices YoY
- -33.9%
- Rents YoY
- 7.3%
- Active inventory
- 480
- Price-to-rent
- 9.8×
Monthly cashflow live
- Estimated rent
- $852 high interval (Pro) →
- Mortgage (P&I)
- −$524
- Tax from tax record
- −$235 /mo · $2,824/yr
- Insurance
- −$42
- HOA
- −$0
- Vacancy / Maint / Mgmt
- −$179
- Net cashflow
- $-129
Break-even live
UW: 25.0% down · 7.5% · 30yr · 1.5% tax · 5.0% vac · 8.0% maint · 8.0% mgmt
Financing live
Cash to close
- Down payment
- $25,000
- Closing costs
- $3,000
- Reserves months
- —
- Total cash needed
- —
Loan-product check · same deal, 3 products live
Conventional
25% down · 7.5% · 30yr
- Down + closing
- —
- Monthly P&I
- —
- Monthly cashflow
- —
- DSCR
- —
- Eligible?
- —
Personal DTI + credit; lowest rate.
DSCR
20% down · 8.5% · 30yr
- Down + closing
- —
- Monthly P&I
- —
- Monthly cashflow
- —
- DSCR
- —
- Eligible?
- —
No personal income docs; deal must DSCR.
Hard money
10% down · 12.0% · 12mo
- Down + closing
- —
- Monthly P&I
- —
- Monthly cashflow
- —
- DSCR
- —
- Eligible?
- —
Short-term bridge; refi at stabilization.
Rent comps 40 comps
| Address | Beds | Baths | Sqft | Rent | $/sqft | DOM | Units | Dist |
|---|---|---|---|---|---|---|---|---|
| 821 N Bradley Ave Indianapolis, IN | 1.0 | 1.0 | 663 | $850 | $1.28 | 4d | 1 | 0.23mi |
| 1028 N Olney St Unit 1030 Indianapolis, IN | 1.0 | 1.0 | 700 | $800 | $1.14 | 23d | 1 | 0.25mi |
| 1106 N Gale St Unit 3 Indianapolis, IN | — | 1.0 | 400 | $650 | $1.62 | 4d | 1 | 0.27mi |
| 1106 N Gale St Unit 1 Indianapolis, IN | 2.0 | 1.0 | 750 | $895 | $1.19 | 43d | 1 | 0.27mi |
| 1036 N Tuxedo St Indianapolis, IN | 1.0 | 1.0 | 646 | $750 | $1.16 | 4d | 1 | 0.30mi |
| 927 N Chester Ave Indianapolis, IN | 1.0 | 1.0 | 596 | $750 | $1.26 | 43d | 1 | 0.35mi |
| 1301 N Olney St Unit 1303 Indianapolis, IN | 2.0 | 1.0 | 750 | $1,100 | $1.47 | 43d | 1 | 0.40mi |
| 412 N Bradley Ave Unit 3 Indianapolis, IN | 2.0 | 1.0 | 700 | $950 | $1.36 | 23d | 1 | 0.42mi |
| 1114 N Dearborn St Indianapolis, IN | 1.0 | 1.0 | 646 | $795 | $1.23 | 44d | 1 | 0.43mi |
| 896 N Gladstone Ave Indianapolis, IN | 1.0 | 1.0 | 580 | $775 | $1.34 | 43d | 1 | 0.45mi |
| 320 N Sherman Dr Unit A Indianapolis, IN | — | 1.0 | 450 | $525 | $1.17 | 4d | 1 | 0.46mi |
| 320 N Sherman Dr Indianapolis, IN | — | 1.0 | 750 | $525 | $0.70 | 43d | 1 | 0.46mi |
| 833 N Gladstone Ave Indianapolis, IN | 1.0 | 1.0 | 687 | $825 | $1.20 | 23d | 1 | 0.48mi |
| 1306 N Chester Ave Indianapolis, IN | 1.0 | 1.0 | 600 | $800 | $1.33 | 20d | 1 | 0.48mi |
| 1358 N Gale St Indianapolis, IN | 1.0 | 1.0 | 550 | $890 | $1.62 | 16d | 1 | 0.50mi |
| 1327 N Chester Ave Indianapolis, IN | 1.0 | 1.0 | 600 | $795 | $1.32 | 13d | 1 | 0.53mi |
| 628 N Oxford St Indianapolis, IN | 1.0 | 1.0 | 536 | $775 | $1.45 | 23d | 1 | 0.58mi |
| 415 N Oxford St Indianapolis, IN | 1.0 | 1.0 | 580 | $650 | $1.12 | 23d | 1 | 0.64mi |
| 3709 Brookside Parkway South Dr Indianapolis, IN | 1.0 | 1.0 | 742 | $825 | $1.11 | 23d | 1 | 0.67mi |
| 1518 N Chester Ave Indianapolis, IN | 2.0 | 1.0 | 672 | $700 | $1.04 | 7d | 1 | 0.68mi |
| 1450 N Gladstone Ave Indianapolis, IN | 1.0 | 1.0 | 588 | $799 | $1.36 | 43d | 1 | 0.69mi |
| 1432 N Colorado Ave Indianapolis, IN | 1.0 | 1.0 | 584 | $875 | $1.50 | 23d | 1 | 0.70mi |
| 1538 N Grant Ave Indianapolis, IN | 1.0 | 1.0 | 375 | $700 | $1.87 | 43d | 1 | 0.73mi |
| 1531 N Grant Ave Indianapolis, IN | 1.0 | 1.0 | 611 | $875 | $1.43 | 23d | 1 | 0.73mi |
| 1510 N Gladstone Ave Indianapolis, IN | 1.0 | 1.0 | 570 | $765 | $1.34 | 43d | 1 | 0.73mi |
| 1512 N Gladstone Ave Unit 1510 1510 Indianapolis, IN | 1.0 | 1.0 | 570 | $830 | $1.46 | 14d | 1 | 0.74mi |
| 1315 N Rural St Indianapolis, IN | 1.0 | 1.0 | 700 | $1,000 | $1.43 | 4d | 1 | 0.74mi |
| 37 S Sherman Dr Indianapolis, IN | 1.0 | 1.0 | 700 | $800 | $1.14 | 23d | 1 | 0.77mi |
| 3058 Brookside Parkway North Dr Indianapolis, IN | 1.0 | 1.0 | 700 | $875 | $1.25 | 12d | 1 | 0.91mi |
| 2827 E 18th St Indianapolis, IN | 2.0 | 1.0 | 726 | $1,300 | $1.79 | 23d | 1 | 1.00mi |
| 49 S Rural St Indianapolis, IN | 2.0 | 1.5 | 750 | $950 | $1.27 | 10d | 1 | 1.02mi |
| 4741 E Washington St Indianapolis, IN | 1.0 | 1.0 | 700 | $950 | $1.36 | 21d | 1 | 1.06mi |
| 1931 N Oxford St Indianapolis, IN | 1.0 | 1.0 | 616 | $875 | $1.42 | 3d | 1 | 1.10mi |
| 4815 E Washington St Unit 4815-10 Indianapolis, IN | 1.0 | 1.0 | 600 | $950 | $1.58 | 21d | 1 | 1.11mi |
| 4815 E Washington St Unit 4815-12 Indianapolis, IN | 1.0 | 1.0 | 700 | $950 | $1.36 | 43d | 1 | 1.11mi |
| 4815 E Washington St Unit 4815-04 Indianapolis, IN | 1.0 | 1.0 | 600 | $895 | $1.49 | 43d | 1 | 1.11mi |
| 621 Tecumseh St Indianapolis, IN | 2.0 | 1.0 | 726 | $1,025 | $1.41 | 43d | 1 | 1.12mi |
| 2211 E New York St Unit B Indianapolis, IN | 1.0 | 1.0 | 650 | $725 | $1.12 | 21d | 1 | 1.13mi |
| 830 N Emerson Ave Indianapolis, IN | 1.0 | 1.0 | 560 | $850 | $1.52 | 43d | 1 | 1.15mi |
| 679 Woodruff Place East Dr Indianapolis, IN | 1.0 | 1.0 | 600 | $895 | $1.49 | 23d | 1 | 1.16mi |
Listing history 17 events
-
2026-06-18days on market $100,000 Active 3 DOM
-
2026-06-17remarks 568-char remark
-
2026-06-17days on market $100,000 Active 2 DOM
-
2026-06-15days on market $100,000 Active 1 DOM
-
2026-06-15days on market $100,000 Active 26 DOM
-
2026-06-13days on market $100,000 Active 24 DOM
-
2026-06-13days on market $100,000 Active 23 DOM
-
2026-06-09days on market $100,000 Active 20 DOM
-
2026-06-08days on market $100,000 Active 19 DOM
-
2026-06-07days on market $100,000 Active 18 DOM
-
2026-06-03days on market $100,000 Active 14 DOM
-
2026-06-02days on market $100,000 Active 13 DOM
-
2026-06-01days on market $100,000 Active 12 DOM
-
2026-05-31days on market $100,000 Active 11 DOM
-
2026-05-20$100,000 Active
-
2007-09-26historical
-
2007-01-16$30,000
ⓘ Source: listings_history table (triggers on properties + properties_extension) + one-shot
backfill from property_details.listing_events for pre-trigger history.
Tax reassessment forecast IN · Partial reset (capped growth)
- Current annual tax
- $2,824 · $235/mo
- Projected year-2 tax
- $2,824 · $235/mo
- Expected delta
- $0/yr ($0/mo · 0.0%)
ⓘ Screening estimate from a state-policy table — verify with the county assessor before closing.
Climate risk First Street
- Flood 1/10 Low FEMA zone X (unshaded) · 0% chance over 30 yrs
- Wildfire 1/10 Low
- Heat 4/10 Moderate 7 d/yr ≥102°F today · 19 d/yr by 30 yrs out
- Wind 2/10 Low
- Air quality 4/10 Moderate 5 unhealthy d/yr today · 7 by 30 yrs out
Nearby sold comps map
Loading sold comps map…
Walkable amenities ~0.75 mi
Loading nearby amenities…
Taxation est. · year 1
- Rental income
- $10,219
- − Mortgage interest
- −$5,602
- − Property taxes
- −$2,824
- − Insurance
- −$500
- − Repairs & maintenance
- −$817
- − Management
- −$817
- − Depreciation
- −$2,909
- Taxable loss
- −$3,251
- Est. tax savings @ 24.0%
- +$780
- After-tax cash flow
- $-764/yr
For passive investors: Depreciation is non-cash, so a rental often shows a tax loss while cash-flowing — sheltering income. Rental losses are passive: they offset passive income freely, and up to $25,000/yr can offset ordinary (W-2) income if you actively participate and your MAGI is under $100k (phasing out to $0 by $150k); unused losses carry forward. On sale, claimed depreciation is recaptured at up to 25%, and gains may owe capital-gains tax (a 1031 exchange can defer both). Figures are a year-1 estimate at your 24.0% rate — not tax advice; consult a CPA.
Schools (NCES district)
- District
- Indianapolis Public Schools
- NCES district ID
- 1804770
- Math proficiency
- 14% ▼ -7.00%
- Reading proficiency
- 20% ▼ -3.00%
- Median HH income
- $32,034
- Composite
- 13.69/100
- National rank
- #9499
- State rank
- #286 of 301 in IN
Livability — Indianapolis city (balance)
No livability data for this city. (Only ~50 U.S. cities are tracked.)
Census & demographics
- Census place
- Indianapolis city (balance), IN
- County
- Marion County · 998,460 people
- City population
- 881,119
- Metro
- Indianapolis-Carmel-Anderson, IN
- Population (ZIP)
- 30,335
- Household income
- $49,195
- Rent vs Own
- Severe rent burden
- 1906.0
Population outlook (Marion County) Hauer SSP2
- Today (2025)
- 1,025,572 people
- By 2030
- 1,065,727 · +3.9%
- By 2040
- 1,141,577 · +11.3%
- By 2050
- 1,208,920 · +17.9%
- By 2075
- 1,367,288 · +33.3%
- By 2100
- 1,438,201 · +40.2%
Race, ethnicity, and origin ACS 2023
- Neighborhood character
- Diverse neighborhood (Simpson 0.63)
- Race & ethnicity
- White 53% Hispanic / Latino 23% Black 18% Two or more races 9%
- Hispanic origin (detail)
- Mexican 14% Puerto Rican 2%
- Common ancestry
- Slovak 2% Lithuanian 2% Italian 1%
- Foreign-born
- 9% · Canada
- Languages at home
- 81% English-only · Spanish 17%
Political lean MEDSL · Marion
- 2024 margin
- Strong D (+27.7) · D 63.0% · R 35.3% · Other 1.7%
- 2008→2024 swing
- -0.7pp no change · 2008: 28.4pp · 2024: 27.7pp
- All cycles
- 2024: D+27.7 2020: D+29.1 2016: D+22.8 2012: D+22.2 2008: D+28.4
Not yet ingested
- Civics
- —
Market trends
- HPI YoY
- ▼ -192.51%
- Current HPI
- 375.0969
- Rent YoY
- ▲ 7.31%
- Metro
- Indianapolis-Carmel-Anderson, IN
- State GDP YoY
- ▲ 2.90%
- F500 in state
- 18
Industry mix (Fortune 500 HQ in IN)
| Industry | F500 HQs | Revenue |
|---|---|---|
| Industrial Machinery | 2 | $37B |
|
||
| Healthcare | 1 | $177B |
|
||
| Pharmaceuticals | 1 | $45B |
|
||
| Metals / Steel | 1 | $18B |
|
||
| Agriculture | 1 | $17B |
|
||
| Packaging | 1 | $12B |
|
||
Price history
+233.3% since first listed3 events — show timeline
- 2026-05-20 Listed $100,000 MIBOR as Distributed by MLS Grid
- 2007-09-26 Listing Removed — MIBOR as Distributed by MLS Grid
- 2007-01-16 Listed $30,000 MIBOR as Distributed by MLS Grid
Property tax history
+17.3%/yrLatest (2025): $2,824 · +2.0% YoY. Source: county tax records.
Cash-flow waterfall
monthlySold comps — $/sqft
last 12 mo · ≤1 miLoading sold comps…