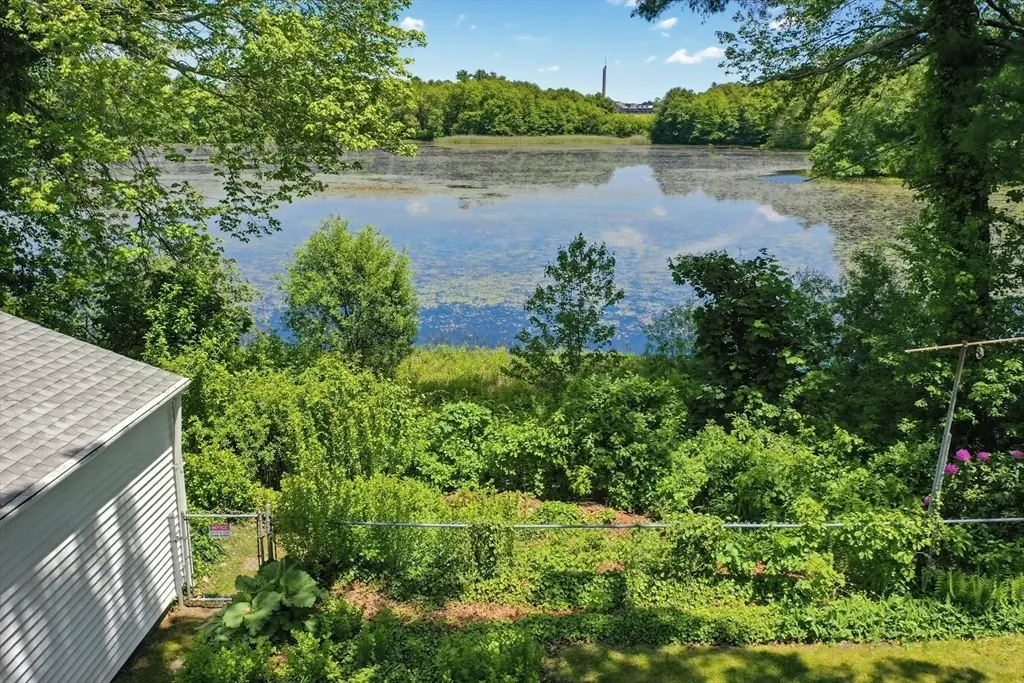
 🌊 Lakefront
36 Alden Ave · Dartmouth, MA
Flood risk 1/10 · Minimal
- FEMA flood zone
- X (unshaded)
- Chance of flooding over 30 yrs
- 0.0%
- Est. flood insurance / yr
- $473 – $860
Fire risk 1/10 · Minimal
- Est. fire insurance / yr
- $915 – $1,699
Heat risk 5/10 · Moderate
- Hot days now (above 96°F)
- 7 days/yr
- Hot days in 30 yrs
- 15 days/yr
Wind risk 8/10 · Major
- Chance of severe wind over 30 yrs
- 80.0%
Air-quality risk 2/10 · Minimal
- Unhealthy air days now
- 1 days/yr
- Unhealthy air days in 30 yrs
- 2 days/yr
Risk factors via First Street. Map © Google.
Why this score? — see what drove the D+ grade
The composite is a weighted blend of 9 inputs, each scored 0–100. Each bar is that input's sub-score; the figure is the points it added to the 100-point composite (weight × sub-score).
- ARV discount +15.0/15.0
- Cash flow +14.2/30.0
- Schools +4.4/10.0
- DSCR +4.3/10.0
- 1% rule +3.0/10.0
- Rent growth +2.5/5.0
- Livability +2.5/5.0
- Condition / age +2.5/5.0
- Appreciation +0.0/10.0
$425,000
🖨 Deal sheet 📄 Offer letter ✓ Due diligence
Listing remarks MLS
JOHN ALDEN FARM ESTATES. TOWN WATER, SEWER & GAS. BUILDER PACKAGES AVAILABLE!
Key facts
- Updated bath
- Cedar dell lake
- Major updates
Tags
Property features AI
Finance
- Other: Has waterview (pond); Frontage length approximately 50 feet
- HOA & community: Community amenities nearby: public transportation, shopping, pool, tennis courts, parks, walk/jog trails, stables, golf, medical facility, laundromat, bike path, conservation area, highway access, house of worship, marina, private and public schools, T-Station, university
Exterior
- Parking: Detached garage with garage door opener (garage faces side); 1 garage space (covered); Tandem layout; Driveway with paved off-street parking; 4 open parking spaces (5 total parking spaces)
- Utilities: Public water; Public sewer; Electric service (100 Amp, circuit breakers); Electric hookups for range and dryer
- Home design: Single family residence; White exterior; Accessible entrance; Approximate year built (public records)
- Construction: Concrete perimeter foundation; Partial basement with interior entry — unfinished, dirt floor, crawl space
- Exterior features: Rain gutters; Level lot; Scenic pond view; Beach ownership (per remarks); Paved road frontage on a public dead-end road; Publicly maintained road
Interior
- Kitchen: Vinyl flooring; Exterior access; Range; Range hood; Dishwasher; Refrigerator
- Bedrooms: Main level primary bedroom with walk-in closet and hardwood floors; Second-floor bedroom with hardwood floors and closet; Second-floor bedroom with hardwood floors and closet
- Flooring: Hardwood; Tile; Laminate; Stone/ceramic tile in bathroom; Vinyl in kitchen
- Bathrooms: One full bathroom with tub and shower, linen closet, and stone/ceramic tile flooring (first floor)
- Heating & cooling: Oil baseboard heating; Window air conditioning units; 100 Amp electrical service; Circuit breakers
- Interior features: Mud room; Storm doors; Insulated windows; Open floorplan; Exterior access from family room and kitchen; Wood / Coal / Pellet stove; Picture windows; 5 total rooms
- Laundry & utility: Washer and dryer included; Washer hookup and electric dryer hookup in basement
Neighborhood map
What this means for you Summary
Snapshot
- This is a 3-bed/1.0-bath single-family listed at $425k.
Deal economics
- At list price, monthly cash flow is $69 ($827/yr) — positive.
- The deal already cash-flows at list — no discount required.
- To meet the 1% rule (rent ≥ 1% of price), the offer needs to be $340k (20.0% below list).
- Recommended offer: $340k (20.0% below list) — sets the bar for 1% rule.
Location & tenants
- Location reads: area grade D — affects rentability + tenant quality, not the cash-flow math above.
- Dartmouth (suburban): math 44% / reading 55% proficiency, ranked #128 of 302 in MA (top 42%) — families likely to look elsewhere, expect single-tenant / working-renter base with shorter leases.
- Market conditions: 23 active listings in the ZIP; 760 units permitted in Bristol County in 2024 (142 in 5+ unit buildings).
Forward outlook
- Local home prices are declining (-3.0%/yr); year-one equity from $3k of loan paydown is wiped out by about $13k of value loss. Plan a longer hold.
- Bristol County population projected to shrink 3% by 2050 — rents likely to lag national; underwrite the cash flow, not the appreciation.
Negotiation context
- Only 9 days on market — expect competitive offers; lowballing is unlikely to land.
- 2 sale attempts since 16y ago with the ask held roughly flat each time — persistent listings suggest the price (not the market) is what's stuck; bring a comps-based counter.
- Current owner paid $210k; list at $425k implies a 102% gain — meaningful room to come down on a strong offer.
Risks & watch-outs
- Watch-outs: built in 1920 — expect roof / HVAC / electrical / plumbing capex.
- Climate carrying-cost: severe wind risk, 80% chance of damaging wind over 30y; extreme-heat days projected 7→15/yr by 2055 (HVAC capex compounding) — expect insurance premiums to compound above CPI over the hold.
Questions for the listing agent
- Built in 1920 — when were the roof, HVAC, electrical panel, plumbing, and water heater last replaced?
- Is there a deadline driving the sale (1031 exchange, divorce, estate, relocation)? That informs how much negotiation room exists.
- The area grade is low — what's the realistic commute time and amenity access for the typical tenant pool here? Any planned neighborhood developments (good or bad) we should know about?
- This sits on a lake — are riparian / water-frontage rights deeded with the parcel? Any dock permits, shoreline easements, or HOA water-use restrictions?
- What's the documented flood / surge / shoreline-erosion history here (FEMA AND non-FEMA — e.g., storm surge, creek backup, septic-field saturation)?
- Any water-quality or seasonal algae-bloom issues that affect tenant satisfaction or short-term-rental demand?
- What's the average days-on-market for RENTAL listings here right now (not sales)? A rising rental-DOM trend means longer vacancies and softer asking-rent achievability than the comps imply.
- What's the recent tenant-quality profile in this submarket — average credit score on applications, eviction rate, late-payment / NSF rate, and stable-employment percentage? A property-management company in the area should have these aggregated.
- How much new for-sale + rental construction is in the pipeline within 1–3 miles? Heavy new supply typically softens prices + rents 12–24 months out; constrained supply supports both.
Investment metrics
- 1% rule
- 0.80% ✗
- Cap rate
- 6.49%
- Cash-on-cash
- 0.69%
- DSCR
- 1.03
- GRM
- 10.4
CMA / ARV
- ARV (on-the-fly)
- $511,920
- Comps found
- 4
Show comp detail 4 sales within ~0.75 mi
| Address | Dist | Beds/Ba | Sqft | Sold | Price | $/sf | Match |
|---|---|---|---|---|---|---|---|
| 462 Old Westport Rd | 0.25mi | 3/1.0 | 1,229 (-5%) | 9mo | $499,000 | $406 | 72 |
| 386 Lucy Little Rd | 0.08mi | 3/1.5 | 1,404 (+8%) | 24mo | $555,100 | $395 | 60 |
| 16 Alden Ave | 0.09mi | 2/1.5 (-1) | 1,408 (+9%) | 17mo | $411,000 | $292 | 60 |
| 353 Old Westport Rd | 0.64mi | 3/1.0 | 1,320 (+2%) | 20mo | $475,000 | $360 | 51 |
Match score weights: distance 35% · size 25% · config 20% · recency 20%. Top-matched comps best support the ARV.
Projected returns pro-forma
-3.0% appreciation · 3.0% rent growth · sell at horizon
- IRR
- -15.2%
- Equity multiple
- 0.46×
- Total profit
- $-64,625
- Equity at exit
- $63,369
- IRR
- -6.7%
- Equity multiple
- 0.57×
- Total profit
- $-51,216
- Equity at exit
- $36,746
Cash invested: $119,000 (down + closing). Projections, not guarantees.
Landlord ↔ Tenant lean methodology
- Overall (STATE)
- 20 Strongly Tenant-Friendly
- State Massachusetts
- 20 Strongly Tenant-Friendly · D+15
- County
- — inherits STATE
- City
- — inherits STATE
ZIP-level market 02747
- Home prices YoY
- -15.4%
- Active inventory
- 23
- Price-to-rent
- 10.4×
Monthly cashflow live
- Estimated rent
- $3,399 medium interval (Pro) →
- Mortgage (P&I)
- −$2,229
- Tax from tax record
- −$211 /mo · $2,528/yr
- Insurance
- −$177
- HOA
- −$0
- Vacancy / Maint / Mgmt
- −$714
- Net cashflow
- $69
Break-even live
UW: 25.0% down · 7.5% · 30yr · 1.5% tax · 5.0% vac · 8.0% maint · 8.0% mgmt
Financing live
Cash to close
- Down payment
- $106,250
- Closing costs
- $12,750
- Reserves months
- —
- Total cash needed
- —
Loan-product check · same deal, 3 products live
Conventional
25% down · 7.5% · 30yr
- Down + closing
- —
- Monthly P&I
- —
- Monthly cashflow
- —
- DSCR
- —
- Eligible?
- —
Personal DTI + credit; lowest rate.
DSCR
20% down · 8.5% · 30yr
- Down + closing
- —
- Monthly P&I
- —
- Monthly cashflow
- —
- DSCR
- —
- Eligible?
- —
No personal income docs; deal must DSCR.
Hard money
10% down · 12.0% · 12mo
- Down + closing
- —
- Monthly P&I
- —
- Monthly cashflow
- —
- DSCR
- —
- Eligible?
- —
Short-term bridge; refi at stabilization.
Listing history 8 events
-
2026-06-18days on market $425,000 Active 9 DOM
-
2026-06-17days on market $425,000 Active 8 DOM
-
2026-06-16days on market $425,000 Active 7 DOM
-
2026-06-15days on market $425,000 Active 6 DOM
-
2026-06-13statusdays on market $425,000 Active 4 DOM
-
2026-06-13days on market $425,000 New 3 DOM
-
2026-06-10remarks 699-char remark
-
2026-06-10$425,000 New 1 DOM
ⓘ Source: listings_history table (triggers on properties + properties_extension) + one-shot
backfill from property_details.listing_events for pre-trigger history.
Tax reassessment forecast MA · Partial reset (capped growth)
- Current annual tax
- $2,528 · $211/mo
- Projected year-2 tax
- $3,878 · $323/mo
- Expected delta
- +$1,350/yr (+$112/mo · 53.4%)
ⓘ Screening estimate from a state-policy table — verify with the county assessor before closing.
Climate risk First Street
- Flood 1/10 Low FEMA zone X (unshaded) · 0% chance over 30 yrs
- Wildfire 1/10 Low
- Heat 5/10 Major 7 d/yr ≥96°F today · 15 d/yr by 30 yrs out
- Wind 8/10 Severe 80% chance of damaging wind over 30 yrs
- Air quality 2/10 Low 1 unhealthy d/yr today · 2 by 30 yrs out
Nearby sold comps map
Loading sold comps map…
Walkable amenities ~0.75 mi
Loading nearby amenities…
Taxation est. · year 1
- Rental income
- $40,791
- − Mortgage interest
- −$23,807
- − Property taxes
- −$2,528
- − Insurance
- −$2,125
- − Repairs & maintenance
- −$3,263
- − Management
- −$3,263
- − Depreciation
- −$12,364
- Taxable loss
- −$6,559
- Est. tax savings @ 24.0%
- +$1,574
- After-tax cash flow
- $2,401/yr
For passive investors: Depreciation is non-cash, so a rental often shows a tax loss while cash-flowing — sheltering income. Rental losses are passive: they offset passive income freely, and up to $25,000/yr can offset ordinary (W-2) income if you actively participate and your MAGI is under $100k (phasing out to $0 by $150k); unused losses carry forward. On sale, claimed depreciation is recaptured at up to 25%, and gains may owe capital-gains tax (a 1031 exchange can defer both). Figures are a year-1 estimate at your 24.0% rate — not tax advice; consult a CPA.
Schools (NCES district)
- District
- Dartmouth
- NCES district ID
- 2504020
- Math proficiency
- 44% ▼ -11.00%
- Reading proficiency
- 55% ▼ -5.00%
- Median HH income
- $70,697
- Composite
- 44.31/100
- National rank
- #2830
- State rank
- #128 of 302 in MA
Livability — Dartmouth
No livability data for this city. (Only ~50 U.S. cities are tracked.)
Census & demographics
- Population (ZIP)
- 21,500
Population outlook (Bristol County) Hauer SSP2
- Today (2025)
- 570,212 people
- By 2030
- 571,181 · +0.2%
- By 2040
- 565,389 · -0.8%
- By 2050
- 552,141 · -3.2%
- By 2075
- 520,923 · -8.6%
- By 2100
- 474,363 · -16.8%
Race, ethnicity, and origin ACS 2023
- Neighborhood character
- Predominantly White (82%)
- Race & ethnicity
- White 82% Two or more races 7% Hispanic / Latino 6% Black 3% Asian 3%
- Hispanic origin (detail)
- Puerto Rican 1%
- Common ancestry
- Russian 35% Lithuanian 10% Romanian 5%
- Foreign-born
- 11% · Canada, China, Vietnam
- Languages at home
- 81% English-only · Other Indo-European 12% Spanish 4% French/Haitian/Cajun 1%
Political lean MEDSL · Bristol
- 2024 margin
- Toss-up / Even · D 49.8% · R 48.5% · Other 1.8%
- 2008→2024 swing
- -21.9pp toward R · 2008: 23.2pp · 2024: 1.3pp
- All cycles
- 2024: D+1.3 2020: D+12.0 2016: D+9.3 2012: D+20.5 2008: D+23.2
Not yet ingested
- Civics
- —
Market trends
- HPI YoY
- ▼ -61.94%
- Current HPI
- 339.8408
- Rent YoY
- —
- Metro
- —
- State GDP YoY
- ▲ 2.28%
- F500 in state
- 38
Industry mix (Fortune 500 HQ in MA)
| Industry | F500 HQs | Revenue |
|---|---|---|
| Technology | 3 | $17B |
|
||
| Insurance | 2 | $84B |
|
||
| Retail | 2 | $76B |
|
||
| Life Sciences | 1 | $43B |
|
||
| Energy Technology | 1 | $31B |
|
||
| Aerospace / Defense | 1 | $18B |
|
||
Price history
+85.6% since first listed5 events — show timeline
- 2026-06-09 Listed $425,000 MLS PIN
- 2012-02-21 Sold (MLS) $210,000 MLS PIN
- 2011-09-06 Contingent — MLS PIN
- 2011-08-24 Price Changed $215,000 MLS PIN
- 2010-03-10 Listed $229,000 MLS PIN
Property tax history
+4.3%/yrLatest (2023): $2,528 · +0.9% YoY. Source: county tax records.
Cash-flow waterfall
monthlySold comps — $/sqft
last 12 mo · ≤1 miLoading sold comps…