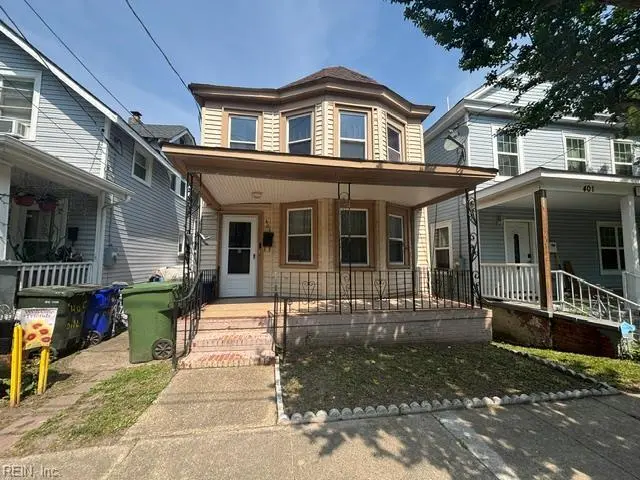
403 Craig St · Norfolk, VA
Flood risk 7/10 · Major
- FEMA flood zone
- X (shaded)
- Chance of flooding over 30 yrs
- 0.95%
- Est. flood insurance / yr
- $507 – $1,088
Fire risk 1/10 · Minimal
- Est. fire insurance / yr
- $666 – $1,236
Heat risk 9/10 · Severe
- Hot days now (above 106°F)
- 7 days/yr
- Hot days in 30 yrs
- 15 days/yr
Wind risk 8/10 · Major
- Chance of severe wind over 30 yrs
- 80.0%
Air-quality risk 5/10 · Moderate
- Unhealthy air days now
- 6 days/yr
- Unhealthy air days in 30 yrs
- 7 days/yr
Risk factors via First Street. Map © Google.
Why this score? — see what drove the B grade
The composite is a weighted blend of 9 inputs, each scored 0–100. Each bar is that input's sub-score; the figure is the points it added to the 100-point composite (weight × sub-score).
- Cash flow +28.1/30.0
- ARV discount +15.0/15.0
- DSCR +10.0/10.0
- 1% rule +7.4/10.0
- Livability +4.2/5.0
- Schools +3.5/10.0
- Rent growth +2.5/5.0
- Condition / age +2.5/5.0
- Appreciation +0.0/10.0
$185,000
🖨 Deal sheet 📄 Offer letter ✓ Due diligence
Listing remarks
SPACIOUS 4-BEDROOM, 1.5 BATH VICTORIAN HOME OFFERING TONS OF POTENTIAL. THIS PROPERTY IS PERFECT FOR INVESTORS LOOKING TO RENOVATE, RENT, OR FLIP FOR PROFIT. UNDERSTRUCTURE REQUIRES REPAIRS & INTERIOR REQUIRES TLC. PROPERTY SOLD AS IS, WHERE IS, WITH NO WARRANTIES.
Key facts
- 2,692 sq ft lot
- Built 1915
- Listed 29 days
Property features AI
Finance
- HOA & community: No HOA fees
Exterior
- Parking: Street parking
- Utilities: City/County water; City/County sewer; Electric water heater
- Home design: Detached Victorian-style home; 2 stories; Crawl foundation; Simple ownership
- Construction: Asphalt shingle roof
- Exterior features: Vinyl siding; Back yard fenced with wood fence; City view
Interior
- Kitchen: Range; Refrigerator
- Bedrooms: No bedroom with full bath on the first floor
- Flooring: Carpet; Vinyl
- Bathrooms: 1 full bathroom; 1 half bathroom
- Heating & cooling: Heat pump heating; Central air conditioning
- Interior features: Carpet and vinyl flooring; 8 total rooms
Neighborhood map
What this means for you Summary
Snapshot
- This is a 4-bed/1.0-bath single-family listed at $185k.
Deal economics
- At list price, monthly cash flow is $517 ($6k/yr) — positive.
- The deal already cash-flows at list — no discount required.
- Meets the 1% rule at list price ($2k rent vs $185k).
- Recommended offer: $182k (1.5% below list) — sets the bar for market timing.
- Cap rate 10.1% vs local median 4.0% in Norfolk — top-decile yield for the area; either an underpriced asset or a hidden risk that comps aren't pricing in. Stress-test before assuming the spread holds.
Location & tenants
- Location reads 83/100 on livability (#43 in VA, #1,026 nationally) — a professional / high-income tenant draw. Strengths: amenities A+, commute A+, health & safety A+; Watch: employment C-, crime F.
- Norfolk City Public School District (urban): math 27% / reading 56% proficiency, ranked #118 of 131 in VA (top 90%) — families likely to look elsewhere, expect single-tenant / working-renter base with shorter leases.
- Zoned schools: Southside Stem Academy At Campostella (math 11% / reading 37%, grade F, #1,064 of 1,108 statewide, top 96%, 737 students, 95% FRL); Booker T Washington High (math 26% / reading 70%, grade D, #303 of 319 statewide, top 95%, 947 students, 94% FRL) — zoned schools average 94% FRL vs 59% district-wide (36 pts higher); higher-poverty schools than district average — tighter screening recommended.
- Market conditions: 24 active listings in the ZIP; 26 comparable units currently listed for rent nearby; rentals at typical pace (median 24d on market — plan ~3-4 weeks tenant-placement turnaround); 438 units permitted in Norfolk city in 2024 (273 in 5+ unit buildings).
Forward outlook
- Local home prices are declining (-3.0%/yr); year-one equity from $1k of loan paydown is wiped out by about $6k of value loss. Plan a longer hold.
- At projected returns (-3.0% appreciation + 3.0% rent growth), your $52k cash investment doubles in ~10 years — after that, you're playing with house money.
Negotiation context
- It's been on market 29 days — a 2% lower offer ($182k) is reasonable based on typical stale-listing flexibility.
- Current owner paid $32k; list at $185k implies a 469% gain — meaningful room to come down on a strong offer.
Risks & watch-outs
- Watch-outs: flood insurance adds $66/mo; built in 1915 — expect roof / HVAC / electrical / plumbing capex.
- Climate carrying-cost: major flood risk; severe wind risk, 80% chance of damaging wind over 30y; extreme-heat days projected 7→15/yr by 2055 (HVAC capex compounding) — expect insurance premiums to compound above CPI over the hold.
Questions for the listing agent
- Built in 1915 — when were the roof, HVAC, electrical panel, plumbing, and water heater last replaced?
- What's the actual annual flood-insurance premium (NFIP or private), and is the property in a SFHA with mandatory coverage?
- Is there a deadline driving the sale (1031 exchange, divorce, estate, relocation)? That informs how much negotiation room exists.
- Schools are A-rated — typically a magnet for longer-tenancy family renters. What's the average tenant stay here, and is there a school-zone premium baked into asking?
- Crime grade is F in this area — have there been break-ins, vandalism, or insurance claims at this property in the last 3 years? What carrier currently insures it and at what premium?
- What's the average days-on-market for RENTAL listings here right now (not sales)? A rising rental-DOM trend means longer vacancies and softer asking-rent achievability than the comps imply.
- What's the recent tenant-quality profile in this submarket — average credit score on applications, eviction rate, late-payment / NSF rate, and stable-employment percentage? A property-management company in the area should have these aggregated.
- How much new for-sale + rental construction is in the pipeline within 1–3 miles? Heavy new supply typically softens prices + rents 12–24 months out; constrained supply supports both.
Investment metrics
- 1% rule
- 1.24% ✓
- Cap rate
- 10.08%
- Cash-on-cash
- 13.51%
- DSCR
- 1.60
- GRM
- 6.7
CMA / ARV
- ARV (on-the-fly)
- $315,444
- Comps found
- 12
Show comp detail 12 sales within ~0.75 mi
| Address | Dist | Beds/Ba | Sqft | Sold | Price | $/sf | Match |
|---|---|---|---|---|---|---|---|
| 304 E Liberty St | 0.39mi | 4/2.5 | 1,600 (-2%) | 4mo | $260,000 | $163 | 70 |
| 808 Joyce St | 0.26mi | 3/2.5 (-1) | 1,656 (+2%) | 7mo | $275,000 | $166 | 68 |
| 910 Fairfield St | 0.10mi | 4/1.5 | 1,406 (-14%) | 4mo | $234,700 | $167 | 68 |
| 123 Hardy Ave | 0.43mi | 4/1.5 | 1,556 (-4%) | 4mo | $260,000 | $167 | 67 |
| 1302 Hatton St | 0.47mi | 3/2.0 (-1) | 1,600 (-2%) | 2mo | $310,000 | $194 | 65 |
| 511 Appomattox Ave | 0.15mi | 3/1.5 (-1) | 1,400 (-14%) | 1mo | $249,700 | $178 | 62 |
| 1623 Conoga St | 0.53mi | 4/3.5 | 1,648 (+1%) | 5mo | $370,000 | $225 | 59 |
| 1300 Cass St | 0.49mi | 4/2.5 | 1,500 (-8%) | 2mo | $315,000 | $210 | 57 |
| 1608 Selden Ave | 0.47mi | 3/2.5 (-1) | 1,519 (-7%) | 1mo | $315,000 | $207 | 56 |
| 1510 Landsworth St | 0.71mi | 3/2.0 (-1) | 1,722 (+6%) | 1mo | $357,000 | $207 | 47 |
| 1001 Grayson St | 0.49mi | 3/2.5 (-1) | 1,458 (-10%) | 2mo | $291,000 | $200 | 47 |
| 1608 Colon Ave | 0.70mi | 3/1.0 (-1) | 1,500 (-8%) | 4mo | $115,500 | $77 | 46 |
Match score weights: distance 35% · size 25% · config 20% · recency 20%. Top-matched comps best support the ARV.
Projected returns pro-forma
-3.0% appreciation · 3.0% rent growth · sell at horizon
- IRR
- 1.5%
- Equity multiple
- 1.06×
- Total profit
- $2,970
- Equity at exit
- $27,584
- IRR
- 11.1%
- Equity multiple
- 1.87×
- Total profit
- $45,126
- Equity at exit
- $15,995
Cash invested: $51,800 (down + closing). Projections, not guarantees.
Landlord ↔ Tenant lean methodology
- Overall (STATE)
- 55 Moderately Landlord-Leaning
- State Virginia
- 55 Moderately Landlord-Leaning · D+2
- County
- — inherits STATE
- City
- — inherits STATE
ZIP-level market 23523
- Home prices YoY
- -16.6%
- Active inventory
- 24
- Price-to-rent
- 6.7×
Monthly cashflow live
- Estimated rent
- $2,286 high interval (Pro) →
- Mortgage (P&I)
- −$970
- Tax from tax record
- −$175 /mo · $2,105/yr
- Insurance
- −$77
- Flood insurance flood zone
- −$66 /mo · $798/yr
- HOA
- −$0
- Vacancy / Maint / Mgmt
- −$480
- Net cashflow
- $517
Break-even live
UW: 25.0% down · 7.5% · 30yr · 1.5% tax · 5.0% vac · 8.0% maint · 8.0% mgmt
Financing live
Cash to close
- Down payment
- $46,250
- Closing costs
- $5,550
- Reserves months
- —
- Total cash needed
- —
Loan-product check · same deal, 3 products live
Conventional
25% down · 7.5% · 30yr
- Down + closing
- —
- Monthly P&I
- —
- Monthly cashflow
- —
- DSCR
- —
- Eligible?
- —
Personal DTI + credit; lowest rate.
DSCR
20% down · 8.5% · 30yr
- Down + closing
- —
- Monthly P&I
- —
- Monthly cashflow
- —
- DSCR
- —
- Eligible?
- —
No personal income docs; deal must DSCR.
Hard money
10% down · 12.0% · 12mo
- Down + closing
- —
- Monthly P&I
- —
- Monthly cashflow
- —
- DSCR
- —
- Eligible?
- —
Short-term bridge; refi at stabilization.
Rent comps 26 comps
| Address | Beds | Baths | Sqft | Rent | $/sqft | DOM | Units | Dist |
|---|---|---|---|---|---|---|---|---|
| 1512 Marsh St Norfolk, VA | 3.0 | 2.5 | 1727 | $2,195 | $1.27 | 44d | 1 | 0.22mi |
| 722 Culpepper St Norfolk, VA | 5.0 | 4.0 | 1742 | $2,550 | $1.46 | 44d | 1 | 0.30mi |
| 413 Walker Ave Norfolk, VA | 5.0 | 3.5 | 2200 | $3,500 | $1.59 | 44d | 1 | 0.33mi |
| 127 Poplar Ave Unit 1 Norfolk, VA | 3.0 | 2.0 | 1700 | $2,199 | $1.29 | 24d | 1 | 0.39mi |
| 1729 Todd St Norfolk, VA | 3.0 | 2.5 | 2000 | $2,450 | $1.23 | 24d | 1 | 0.39mi |
| 201 Bellamy Ave Norfolk, VA | 5.0 | 2.5 | 2200 | $2,750 | $1.25 | 44d | 1 | 0.44mi |
| 1008 Grayson St Norfolk, VA | 3.0 | 2.0 | 2200 | $2,495 | $1.13 | 44d | 1 | 0.49mi |
| 701 S Main St Norfolk, VA | 3.0 | 2.0 | 1076 | $1,349 | $1.25 | 2d | 2 | 0.52mi |
| 329 S Main St Norfolk, VA | 3.0 | 3.0 | 1652 | $3,000 | $1.82 | 44d | 1 | 0.52mi |
| 1510 Wilson Rd #4 Norfolk, VA | 3.0 | 1.0 | 1273 | $1,400 | $1.10 | 20d | 1 | 0.52mi |
| 1510 Wilson Rd Unit 3 Norfolk, VA | 3.0 | 1.0 | 1273 | $1,200 | $0.94 | 44d | 1 | 0.52mi |
| 1510 Wilson Rd Unit 1 Norfolk, VA | 3.0 | 1.0 | 1100 | $1,325 | $1.20 | 24d | 1 | 0.52mi |
| 1009 Elkin St Norfolk, VA | 4.0 | 2.5 | 1914 | $2,500 | $1.31 | 12d | 1 | 0.65mi |
| 1108 Jackson Ave Chesapeake, VA | 3.0 | 2.0 | 1784 | $2,100 | $1.18 | 4d | 1 | 0.98mi |
| 1151 Perry St Chesapeake, VA | 3.0 | 1.0 | 1296 | $2,000 | $1.54 | 17d | 1 | 1.13mi |
| 2624 Chesterfield Blvd Norfolk, VA | 4.0 | 1.5 | 1512 | $2,000 | $1.32 | 44d | 1 | 1.15mi |
| 1231 Stewart St Chesapeake, VA | 4.0 | 2.5 | 2159 | $2,550 | $1.18 | 3d | 1 | 1.18mi |
| 720 Forbes St Norfolk, VA | 3.0 | 2.0 | 1056 | $2,250 | $2.13 | 44d | 1 | 1.23mi |
| 720 Forbes St Norfolk, VA | 3.0 | 2.0 | 1056 | $2,195 | $2.08 | 15d | 1 | 1.23mi |
| 2800 Chesterfield Blvd Norfolk, VA | 3.0 | 2.5 | 1760 | $2,400 | $1.36 | 4d | 1 | 1.27mi |
| 321 E Main St Norfolk, VA | 3.0 | 1.0–2.0 | 1147 | $4,929 | $4.30 | 2d | 15 | 1.28mi |
| 1110 Park Ave Unit 23324 Chesapeake, VA | 3.0 | 2.0 | 1749 | $2,200 | $1.26 | 24d | 1 | 1.29mi |
| 1110 Park Ave Chesapeake, VA | 3.0 | 2.0 | 1749 | $2,100 | $1.20 | 15d | 1 | 1.29mi |
| 820 Maltby Cres Norfolk, VA | 3.0 | 2.5 | 1850 | $2,395 | $1.29 | 24d | 1 | 1.34mi |
| 2806 Kimball Ter Norfolk, VA | 3.0 | 2.5 | 1700 | $2,100 | $1.24 | 44d | 1 | 1.37mi |
| 2808 Westminster Ave Norfolk, VA | 4.0 | 2.0 | 1988 | $2,295 | $1.15 | 24d | 1 | 1.49mi |
Listing history 19 events
-
2026-06-18days on market $185,000 Active 29 DOM
-
2026-06-17days on market $185,000 Active 28 DOM
-
2026-06-16days on market $185,000 Active 27 DOM
-
2026-06-15days on market $185,000 Active 26 DOM
-
2026-06-13days on market $185,000 Active 24 DOM
-
2026-06-09days on market $185,000 Active 20 DOM
-
2026-06-08days on market $185,000 Active 19 DOM
-
2026-06-07days on market $185,000 Active 18 DOM
-
2026-06-03days on market $185,000 Active 14 DOM
-
2026-06-02days on market $185,000 Active 13 DOM
-
2026-06-01days on market $185,000 Active 12 DOM
-
2026-05-31days on market $185,000 Active 11 DOM
-
2026-05-20$185,000 Active
-
2015-04-15price $39,900
-
2014-03-24price $54,900 Active
-
2014-02-08price $64,900 Active
-
2013-09-18price $74,900 Active
-
2001-04-16soldstatus $32,500
-
1979-10-02soldstatus $15,000
ⓘ Source: listings_history table (triggers on properties + properties_extension) + one-shot
backfill from property_details.listing_events for pre-trigger history.
Tax reassessment forecast VA · Resets to sale price
- Current annual tax
- $2,105 · $175/mo
- Projected year-2 tax
- $2,105 · $175/mo
- Expected delta
- $0/yr ($0/mo · 0.0%)
ⓘ Screening estimate from a state-policy table — verify with the county assessor before closing.
Climate risk First Street
- Flood 7/10 Severe FEMA zone X (shaded) · 95% chance over 30 yrs
- Wildfire 1/10 Low
- Heat 9/10 Extreme 7 d/yr ≥106°F today · 15 d/yr by 30 yrs out
- Wind 8/10 Severe 80% chance of damaging wind over 30 yrs
- Air quality 5/10 Major 6 unhealthy d/yr today · 7 by 30 yrs out
Nearby sold comps map
Loading sold comps map…
Walkable amenities ~0.75 mi
Loading nearby amenities…
Taxation est. · year 1
- Rental income
- $27,429
- − Mortgage interest
- −$10,363
- − Property taxes
- −$2,105
- − Insurance
- −$1,722
- − Repairs & maintenance
- −$2,194
- − Management
- −$2,194
- − Depreciation
- −$5,382
- Taxable income
- $3,469
- Est. tax owed @ 24.0%
- −$832
- After-tax cash flow
- $5,368/yr
For passive investors: Depreciation is non-cash, so a rental often shows a tax loss while cash-flowing — sheltering income. Rental losses are passive: they offset passive income freely, and up to $25,000/yr can offset ordinary (W-2) income if you actively participate and your MAGI is under $100k (phasing out to $0 by $150k); unused losses carry forward. On sale, claimed depreciation is recaptured at up to 25%, and gains may owe capital-gains tax (a 1031 exchange can defer both). Figures are a year-1 estimate at your 24.0% rate — not tax advice; consult a CPA.
Schools (NCES district)
- District
- Norfolk City Public School District
- NCES district ID
- 5102670
- Math proficiency
- 27% ▼ -44.00%
- Reading proficiency
- 56% ▼ -10.00%
- Median HH income
- $44,358
- Composite
- 35.08/100
- National rank
- #5026
- State rank
- #118 of 131 in VA
Livability — Norfolk
- Score
- 83/100
- State rank
- #43
- US rank
- #1026
Category grades
Schools grade is shown separately in the Schools card above.
Census & demographics
- Census place
- Norfolk, VA
- City population
- 214,042
- Population (ZIP)
- 7,698
Population outlook (Norfolk County) Hauer SSP2
- Today (2025)
- 249,032 people
- By 2030
- 252,347 · +1.3%
- By 2040
- 253,644 · +1.9%
- By 2050
- 251,913 · +1.2%
- By 2075
- 245,281 · -1.5%
- By 2100
- 219,548 · -11.8%
Race, ethnicity, and origin ACS 2023
- Neighborhood character
- Predominantly Black (87%)
- Race & ethnicity
- Black 87% White 7% Two or more races 5% Hispanic / Latino 2%
- Common ancestry
- Romanian 1%
- Foreign-born
- 2% · Canada
- Languages at home
- 94% English-only · Spanish 3% Other Indo-European 1%
Political lean MEDSL · Norfolk
- 2024 margin
- Solid D (+41.5) · D 70.0% · R 28.5% · Other 1.6%
- 2008→2024 swing
- -1.4pp toward R · 2008: 43.0pp · 2024: 41.5pp
- All cycles
- 2024: D+41.5 2020: D+45.6 2016: D+42.0 2012: D+44.0 2008: D+43.0
Not yet ingested
- Civics
- —
Market trends
- HPI YoY
- ▼ -53.73%
- Current HPI
- 269.0309
- Rent YoY
- —
- Metro
- —
- State GDP YoY
- ▲ 2.40%
- F500 in state
- 50
Industry mix (Fortune 500 HQ in VA)
| Industry | F500 HQs | Revenue |
|---|---|---|
| Aerospace / Defense | 4 | $236B |
|
||
| Technology / Defense | 3 | $32B |
|
||
| Financial Services | 2 | $176B |
|
||
| Utilities | 2 | $27B |
|
||
| Insurance | 2 | $25B |
|
||
| Technology | 2 | $15B |
|
||
Price history
+1133.3% since first listed7 events — show timeline
- 2026-05-20 Listed $185,000 REINMLS
- 2015-04-15 Price Changed $39,900 REINMLS
- 2014-03-24 Price Changed $54,900 REINMLS
- 2014-02-08 Price Changed $64,900 REINMLS
- 2013-09-18 Price Changed $74,900 REINMLS
- 2001-04-16 Sold (Public Records) $32,500 Public Records
- 1979-10-02 Sold (Public Records) $15,000 Public Records
Property tax history
+3.9%/yrLatest (2025): $2,105 · +1.1% YoY. Source: county tax records.
Cash-flow waterfall
monthlySold comps — $/sqft
last 12 mo · ≤1 miLoading sold comps…