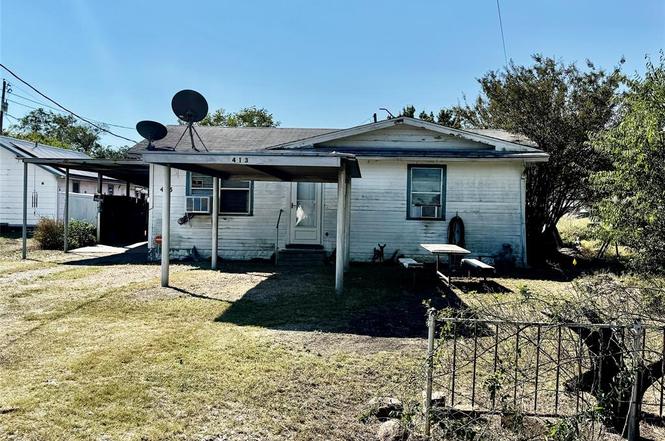
413 E Locust St · Whitewright, TX
Flood risk No data
- FEMA flood zone
- —
- Chance of flooding over 30 yrs
- —
- Est. flood insurance / yr
- —
Fire risk No data
- Est. fire insurance / yr
- —
Heat risk No data
- Hot days now (above threshold)
- —
- Hot days in 30 yrs
- —
Wind risk No data
- Chance of severe wind over 30 yrs
- —
Air-quality risk No data
- Unhealthy air days now
- —
- Unhealthy air days in 30 yrs
- —
Risk factors via First Street. Map © Google.
Why this score? — see what drove the B grade
The composite is a weighted blend of 9 inputs, each scored 0–100. Each bar is that input's sub-score; the figure is the points it added to the 100-point composite (weight × sub-score).
- Cash flow +30.0/30.0
- 1% rule +10.0/10.0
- DSCR +10.0/10.0
- ARV discount +7.5/15.0
- Schools +4.5/10.0
- Livability +3.4/5.0
- Rent growth +2.5/5.0
- Condition / age +2.5/5.0
- Appreciation +0.0/10.0
$55,000
🖨 Deal sheet 📄 Offer letter ✓ Due diligence
Listing remarks
This cozy 2-bedroom, 1-bath home of 675 sq ft carries a sense of history and possibility. The home is cooled with a window unit and heated by gas wall units, offering simple comforts. Out back, you’ll find a three-section workshop totaling 675 sq ft, filled with Grandpa’s tools and memories, waiting for its next chapter. The home has good bones and plenty of character, but it’s ready for your ideas and improvements to bring it back to life. Being sold as-is and priced accordingly, with no repairs to be made. Buyer to provide survey if required. Come see the potential and imagine what you could create here.
Key facts
- Window unit
- Gas wall units
- 7,100 sq ft lot
Tags
Property features AI
Finance
- Financial info: Eligible for cash or conventional financing; Treat as clear loan type; No second mortgage indicated
- HOA & community: No association
Exterior
- Parking: Attached carport; 2 covered/carport spaces
- Utilities: City water; City sewer; No municipal utility district
- Home design: Single family residence; Accessory unit present; One level; Property attached
- Construction: Built in 1950; Composition roof; Unknown construction materials
- Exterior features: Covered porch; Awnings; Storage; Workshop; Interior lot; Grassed vegetation; Easements for utilities
Interior
- Kitchen: Dishwasher; Garbage disposal; Gas oven; Gas range; Plumbed for gas in kitchen
- Bedrooms: Primary bedroom (1st level); Bedroom (1st level); Total 2 bedrooms
- Flooring: Vinyl; Wood; Wood under carpet
- Bathrooms: 1 full bathroom
- Heating & cooling: Natural gas heating; Wall furnace; Window unit cooling
- Interior features: Eat-in kitchen; Built-in cabinets; Room for freezer; Utility room
- Laundry & utility: Full-size washer/dryer area; Utility room with built-in cabinets
Neighborhood map
What this means for you Summary
Snapshot
- This is a 2-bed/1.0-bath single-family listed at $55k.
Deal economics
- At list price, monthly cash flow is $468 ($6k/yr) — positive.
- The deal already cash-flows at list — no discount required.
- Meets the 1% rule at list price ($1k rent vs $55k).
- Recommended offer: $48k (12.0% below list) — sets the bar for market timing.
- Cap rate 16.5% vs local median 4.3% in Whitewright — top-decile yield for the area; either an underpriced asset or a hidden risk that comps aren't pricing in. Stress-test before assuming the spread holds.
Location & tenants
- Location reads 68/100 on livability (#457 in TX) — a middle-class / working-renter tenant base. Strengths: cost of living A+, housing A+, crime A-; Watch: amenities F, commute F, employment F.
- Whitewright ISD (rural): math 57% / reading 49% proficiency, ranked #134 of 826 in TX (top 16%) — acceptable for families but not a draw, mixed tenant base, ~2y average lease.
- Zoned schools: Whitewright El (math 47% / reading 42%, grade F, #1,155 of 4,322 statewide, top 29%, 389 students, 59% FRL) — zoned schools average 59% FRL vs 27% district-wide (32 pts higher); higher-poverty schools than district average — tighter screening recommended.
- Market conditions: 109 active listings in the ZIP; 2 comparable units currently listed for rent nearby; 2,272 units permitted in Grayson County in 2024 (750 in 5+ unit buildings).
Forward outlook
- Local home prices are declining (-3.0%/yr); year-one equity from $380 of loan paydown is wiped out by about $2k of value loss. Plan a longer hold.
- Grayson County population projected at +12% by 2050 — modest demand growth; plan on rents tracking national, not racing it.
- At projected returns (-3.0% appreciation + 3.0% rent growth), your $15k cash investment doubles in ~4 years — after that, you're playing with house money.
Negotiation context
- It's been on market 212 days — a 12% lower offer ($48k) is reasonable based on typical stale-listing flexibility.
- 2 sale attempts; this cycle's ask has dropped $20k (27%) from the opening price — seller is motivated, your offer sets the floor, not the list.
Risks & watch-outs
- Watch-outs: built in 1950 — expect roof / HVAC / electrical / plumbing capex.
Questions for the listing agent
- It's been on market 212 days. Have you received any prior offers? Is the seller open to a 12% concession, seller financing, or rate buy-down credit?
- Built in 1950 — when were the roof, HVAC, electrical panel, plumbing, and water heater last replaced?
- Why hasn't it sold? Are there any deal-killer items the seller is aware of (foundation, flood, title, zoning, code violations)?
- Is there a deadline driving the sale (1031 exchange, divorce, estate, relocation)? That informs how much negotiation room exists.
- What's the average days-on-market for RENTAL listings here right now (not sales)? A rising rental-DOM trend means longer vacancies and softer asking-rent achievability than the comps imply.
- What's the recent tenant-quality profile in this submarket — average credit score on applications, eviction rate, late-payment / NSF rate, and stable-employment percentage? A property-management company in the area should have these aggregated.
- How much new for-sale + rental construction is in the pipeline within 1–3 miles? Heavy new supply typically softens prices + rents 12–24 months out; constrained supply supports both.
Investment metrics
- 1% rule
- 1.99% ✓
- Cap rate
- 16.50%
- Cash-on-cash
- 36.44%
- DSCR
- 2.62
- GRM
- 4.2
CMA / ARV
No comps found within radius.
Projected returns pro-forma
-3.0% appreciation · 3.0% rent growth · sell at horizon
- IRR
- 32.3%
- Equity multiple
- 2.36×
- Total profit
- $20,902
- Equity at exit
- $8,201
- IRR
- 39.3%
- Equity multiple
- 4.68×
- Total profit
- $56,666
- Equity at exit
- $4,755
Cash invested: $15,400 (down + closing). Projections, not guarantees.
Landlord ↔ Tenant lean methodology
- Overall (STATE)
- 87 Strongly Landlord-Friendly
- State Texas
- 87 Strongly Landlord-Friendly · R+5
- County
- — inherits STATE
- City
- — inherits STATE
ZIP-level market 75491
- Home prices YoY
- -8.6%
- Active inventory
- 109
- Price-to-rent
- 4.2×
Monthly cashflow live
- Estimated rent
- $1,095 medium interval (Pro) →
- Mortgage (P&I)
- −$288
- Tax from tax record
- −$86 /mo · $1,032/yr
- Insurance
- −$23
- HOA
- −$0
- Vacancy / Maint / Mgmt
- −$230
- Net cashflow
- $468
Break-even live
UW: 25.0% down · 7.5% · 30yr · 1.5% tax · 5.0% vac · 8.0% maint · 8.0% mgmt
Financing live
Cash to close
- Down payment
- $13,750
- Closing costs
- $1,650
- Reserves months
- —
- Total cash needed
- —
Loan-product check · same deal, 3 products live
Conventional
25% down · 7.5% · 30yr
- Down + closing
- —
- Monthly P&I
- —
- Monthly cashflow
- —
- DSCR
- —
- Eligible?
- —
Personal DTI + credit; lowest rate.
DSCR
20% down · 8.5% · 30yr
- Down + closing
- —
- Monthly P&I
- —
- Monthly cashflow
- —
- DSCR
- —
- Eligible?
- —
No personal income docs; deal must DSCR.
Hard money
10% down · 12.0% · 12mo
- Down + closing
- —
- Monthly P&I
- —
- Monthly cashflow
- —
- DSCR
- —
- Eligible?
- —
Short-term bridge; refi at stabilization.
Rent comps 2 comps
| Address | Beds | Baths | Sqft | Rent | $/sqft | DOM | Units | Dist |
|---|---|---|---|---|---|---|---|---|
| 411 E Locust St Whitewright, TX | 2.0 | 1.0 | 636 | $1,095 | $1.72 | 1d | 1 | 0.05mi |
| 411 W Locust St Whitewright, TX | 2.0 | 1.0 | 636 | $1,095 | $1.72 | 1d | 1 | 0.71mi |
Listing history 7 events
-
2026-05-02status Pending
-
2026-04-26historical Active Option Contract
-
2026-04-11price $55,000
-
2026-03-28price $65,000
-
2026-03-17status Active
-
2025-10-14historical Active Option Contract
-
2025-10-02$75,000 Active
ⓘ Source: listings_history table (triggers on properties + properties_extension) + one-shot
backfill from property_details.listing_events for pre-trigger history.
Tax reassessment forecast TX · Resets to sale price
- Current annual tax
- $1,032 · $86/mo
- Projected year-2 tax
- $1,032 · $86/mo
- Expected delta
- $0/yr ($0/mo · 0.0%)
ⓘ Screening estimate from a state-policy table — verify with the county assessor before closing.
Nearby sold comps map
Loading sold comps map…
Walkable amenities ~0.75 mi
Loading nearby amenities…
Taxation est. · year 1
- Rental income
- $13,140
- − Mortgage interest
- −$3,081
- − Property taxes
- −$1,032
- − Insurance
- −$275
- − Repairs & maintenance
- −$1,051
- − Management
- −$1,051
- − Depreciation
- −$1,600
- Taxable income
- $5,049
- Est. tax owed @ 24.0%
- −$1,212
- After-tax cash flow
- $4,400/yr
For passive investors: Depreciation is non-cash, so a rental often shows a tax loss while cash-flowing — sheltering income. Rental losses are passive: they offset passive income freely, and up to $25,000/yr can offset ordinary (W-2) income if you actively participate and your MAGI is under $100k (phasing out to $0 by $150k); unused losses carry forward. On sale, claimed depreciation is recaptured at up to 25%, and gains may owe capital-gains tax (a 1031 exchange can defer both). Figures are a year-1 estimate at your 24.0% rate — not tax advice; consult a CPA.
Schools (NCES district)
- District
- Whitewright ISD
- NCES district ID
- 4845670
- Math proficiency
- 57% ▲ 1.00%
- Reading proficiency
- 49% ▲ 2.00%
- Median HH income
- $49,969
- Composite
- 45.31/100
- National rank
- #2648
- State rank
- #134 of 826 in TX
Livability — Whitewright
- Score
- 68/100
- State rank
- #457
- US rank
- #9255
Category grades
Schools grade is shown separately in the Schools card above.
Census & demographics
- Census place
- Whitewright, TX
- Population (ZIP)
- 5,428
Population outlook (Grayson County) Hauer SSP2
- Today (2025)
- 134,540 people
- By 2030
- 138,653 · +3.1%
- By 2040
- 145,958 · +8.5%
- By 2050
- 151,218 · +12.4%
- By 2075
- 161,802 · +20.3%
- By 2100
- 159,036 · +18.2%
Race, ethnicity, and origin ACS 2023
- Neighborhood character
- Predominantly White (85%)
- Race & ethnicity
- White 85% Two or more races 7% Hispanic / Latino 7% Black 2% Asian 1%
- Hispanic origin (detail)
- Mexican 5%
- Common ancestry
- Lithuanian 2% Slovak 1% Italian 1%
- Foreign-born
- 4% · Canada, China
- Languages at home
- 95% English-only · Spanish 3% German/W. Germanic 1% Other Asian/Pacific 1%
Political lean MEDSL · Grayson
- 2024 margin
- Solid R (+54.3) · D 22.5% · R 76.7%
- 2008→2024 swing
- -16.4pp toward R · 2008: -37.9pp · 2024: -54.3pp
- All cycles
- 2024: R+54.3 2020: R+49.9 2016: R+53.1 2012: R+48.0 2008: R+37.9
Not yet ingested
- Civics
- —
Market trends
- HPI YoY
- ▼ -25.85%
- Current HPI
- 273.3968
- Rent YoY
- —
- Metro
- —
- State GDP YoY
- ▲ 3.95%
- F500 in state
- 110
Industry mix (Fortune 500 HQ in TX)
| Industry | F500 HQs | Revenue |
|---|---|---|
| Energy | 16 | $1,198B |
|
||
| Technology | 5 | $198B |
|
||
| Engineering / Construction | 4 | $72B |
|
||
| Energy Services | 3 | $60B |
|
||
| Utilities | 3 | $41B |
|
||
| Healthcare | 2 | $330B |
|
||
Price history
-26.7% since first listed7 events — show timeline
- 2026-05-02 Pending — NTREIS
- 2026-04-26 Contingent — NTREIS
- 2026-04-11 Price Changed $55,000 NTREIS
- 2026-03-28 Price Changed $65,000 NTREIS
- 2026-03-17 Relisted — NTREIS
- 2025-10-14 Contingent — NTREIS
- 2025-10-02 Listed $75,000 NTREIS
Property tax history
+2.5%/yrLatest (2025): $1,032 · +11.8% YoY. Source: county tax records.
Cash-flow waterfall
monthlySold comps — $/sqft
last 12 mo · ≤1 miLoading sold comps…