2056 Hidden Lk #3 · Corpus Christi, TX
Flood risk No data
- FEMA flood zone
- —
- Chance of flooding over 30 yrs
- —
- Est. flood insurance / yr
- —
Fire risk No data
- Est. fire insurance / yr
- —
Heat risk No data
- Hot days now (above threshold)
- —
- Hot days in 30 yrs
- —
Wind risk No data
- Chance of severe wind over 30 yrs
- —
Air-quality risk No data
- Unhealthy air days now
- —
- Unhealthy air days in 30 yrs
- —
Risk factors via First Street. Map © Google.
Why this score? — see what drove the D grade
The composite is a weighted blend of 9 inputs, each scored 0–100. Each bar is that input's sub-score; the figure is the points it added to the 100-point composite (weight × sub-score).
- Cash flow +12.6/30.0
- 1% rule +8.3/10.0
- ARV discount +7.5/15.0
- Livability +3.9/5.0
- DSCR +3.8/10.0
- Schools +2.8/10.0
- Condition / age +2.5/5.0
- Rent growth +2.1/5.0
- Appreciation +0.0/10.0
$104,900
🖨 Deal sheet (PDF) 📄 Offer letter ✓ Due diligence
Listing remarks
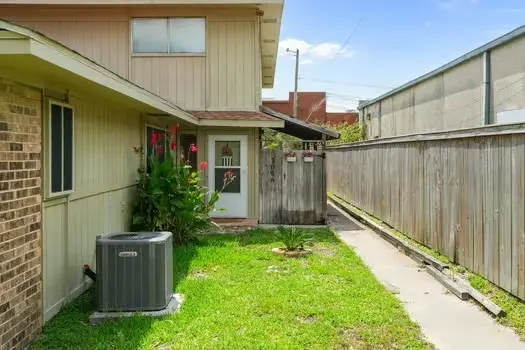
Welcome to Lakewood Village! This charming end-unit condo offers 2 spacious bedrooms, 1.5 bathrooms, and a 1-car garage in one of the area’s most picturesque communities. The first floor features a comfortable living area, dining space, kitchen with breakfast bar, and convenient half bath. Step outside to your private, fenced patio—perfect for morning coffee, evening relaxation, or entertaining guests. Upstairs, you’ll find two generously sized bedrooms and a full bathroom, providing a functional and comfortable layout. Lakewood Village is known for its beautifully maintained grounds, scenic pond, abundant wildlife, mature trees, and inviting picnic and grilling areas. Res
Key facts
- Private fenced patio
- Scenic pond
- Community pool
Tags
Property features AI
Finance
- HOA & community: Homeowners association with a $300 monthly fee; HOA covers common areas, cable TV, internet, grounds maintenance, structure maintenance, security, trash, and water; Community pool; Community lake
Exterior
- Parking: Covered concrete parking; 1-car garage
- Utilities: Public water; Public sewer; Utilities available
- Home design: Single-story; Shingle roof; Brick and HardiPlank exterior; Slab foundation
- Construction: Built with brick and HardiPlank; Slab foundation; Shingle roof
- Exterior features: Enclosed patio; Patio; Wood fencing; Corner lot
Interior
- Kitchen: Electric oven; Electric range; Microwave
- Flooring: Carpet; Tile
- Bathrooms: 1 full bathroom; 1 half bathroom
- Heating & cooling: Central heating (electric); Central air conditioning
- Interior features: Cable TV
Neighborhood map
What this means for you Summary
Snapshot
- This is a 2-bed/1.5-bath condo listed at $105k.
Deal economics
- At list price, monthly cash flow is $-13 ($-159/yr) — negative.
- To cash-flow at today's rent, offer at most $103k (2.2% below list).
- Meets the 1% rule at list price ($1k rent vs $105k).
- Recommended offer: $103k (2.2% below list) — sets the bar for cash-flow.
- Cap rate 6.1% vs local median 3.6% in Corpus Christi — top-decile yield for the area; either an underpriced asset or a hidden risk that comps aren't pricing in. Stress-test before assuming the spread holds.
Location & tenants
- Location reads 78/100 on livability (#66 in TX, #2,404 nationally) — a middle-class / working-renter tenant base. Strengths: commute A+, cost of living A+, housing A+; Watch: crime F.
- Corpus Christi ISD (urban): math 31% / reading 35% proficiency, ranked #562 of 826 in TX (top 68%) — families likely to look elsewhere, expect single-tenant / working-renter base with shorter leases; 63% free/reduced lunch — lower-income household profile, screen leases tightly.
- Zoned schools: Windsor Park G/T (math 85% / reading 90%, grade A+, #6 of 4,322 statewide, top 0%, 609 students, 29% FRL); Adkins Middle (math 40% / reading 39%, grade F, #660 of 1,662 statewide, top 41%, 956 students, 48% FRL); King H S (math 35% / reading 36%, grade F, #941 of 1,632 statewide, top 58%, 1,400 students, 63% FRL) — zoned schools average 47% FRL vs 63% district-wide (16 pts lower); this property's tenant base skews higher-income than the district average.
- Zoned-school proficiency averages 54% at this address vs 33% district-wide (+21 pts) — the actual schools serving this property are materially stronger than the Corpus Christi ISD average implies; a family-tenant draw the district grade alone would hide.
- Market conditions: Rents soft (-1.5%/yr); 212 active listings in the ZIP; 40 comparable units currently listed for rent nearby; rentals at typical pace (median 23d on market — plan ~3-4 weeks tenant-placement turnaround); 45% of comp listings sitting > 30 days — soft ceiling on asking rent; 1,397 units permitted in Nueces County in 2024 (47 in 5+ unit buildings).
Forward outlook
- Local home prices are declining (-3.0%/yr); year-one equity from $725 of loan paydown is wiped out by about $3k of value loss. Plan a longer hold.
- Nueces County population projected at +36% by 2050 — long-run rental-demand tailwind backs the buy-and-hold thesis.
Negotiation context
- It's been on market 17 days — a 2% lower offer ($103k) is reasonable based on typical stale-listing flexibility.
- 3 sale attempts with the ask held roughly flat each time — persistent listings suggest the price (not the market) is what's stuck; bring a comps-based counter.
- Current owner paid $34k; list at $105k implies a 209% gain — meaningful room to come down on a strong offer.
Risks & watch-outs
- Watch-outs: property tax is 2.5% of price; HOA is 22% of rent.
Questions for the listing agent
- What do current leases actually rent for vs. the listed asking? Can we see a recent rent roll and the last 12 months of T-12 income?
- Built in 1972 — when were the roof, HVAC, electrical panel, plumbing, and water heater last replaced?
- Property tax is high relative to price — has the assessment been appealed recently, and will the sale trigger a re-assessment?
- What does the HOA fee cover, when was the last increase, and are there any pending special assessments or reserve-fund shortfalls?
- Any open or pending special assessments — roof, HVAC, plumbing, elevator, façade? What's the per-unit balance and payoff schedule, and is the seller paying it off at close or rolling it to the buyer?
- Is there a deadline driving the sale (1031 exchange, divorce, estate, relocation)? That informs how much negotiation room exists.
- Crime grade is F in this area — have there been break-ins, vandalism, or insurance claims at this property in the last 3 years? What carrier currently insures it and at what premium?
- The area grade is low — what's the realistic commute time and amenity access for the typical tenant pool here? Any planned neighborhood developments (good or bad) we should know about?
- What's the average days-on-market for RENTAL listings here right now (not sales)? A rising rental-DOM trend means longer vacancies and softer asking-rent achievability than the comps imply.
- What's the recent tenant-quality profile in this submarket — average credit score on applications, eviction rate, late-payment / NSF rate, and stable-employment percentage? A property-management company in the area should have these aggregated.
- How much new apartment / multifamily construction is in the pipeline within 1–3 miles? Heavy new supply (>2% of stock underway) typically softens rents 12–24 months out; light construction supports rent growth.
Investment metrics
- 1% rule
- 1.33% ✓
- Cap rate
- 6.14%
- Cash-on-cash
- -0.54%
- DSCR
- 0.98
- GRM
- 6.3
CMA / ARV
No comps found within radius.
Projected returns pro-forma
-3.0% appreciation · 0.0% rent growth · sell at horizon
- IRR
- -22.3%
- Equity multiple
- 0.26×
- Total profit
- $-21,658
- Equity at exit
- $15,641
- IRR
- -36.4%
- Equity multiple
- -0.18×
- Total profit
- $-34,649
- Equity at exit
- $9,070
Cash invested: $29,372 (down + closing). Projections, not guarantees.
Landlord ↔ Tenant lean methodology
- Overall (STATE)
- 87 Strongly Landlord-Friendly
- State Texas
- 87 Strongly Landlord-Friendly · R+5
- County
- — inherits STATE
- City
- — inherits STATE
ZIP-level market 78412
- Rents YoY
- -1.5%
- Active inventory
- 212
- Price-to-rent
- 6.3×
Monthly cashflow live
- Estimated rent
- $1,391 high interval (Pro) →
- Mortgage (P&I)
- −$550
- Tax from tax record
- −$219 /mo · $2,623/yr
- Insurance
- −$44
- HOA
- −$300
- Vacancy / Maint / Mgmt
- −$292
- Net cashflow
- $-13
Break-even live
Sensitivity live
| Price | -10% $46 | -5% $16 | +0% $-13 | +5% $-43 | +10% $-73 |
|---|---|---|---|---|---|
| Rent | -10% $-123 | -5% $-68 | +0% $-13 | +5% $42 | +10% $97 |
| Rate | -1.0pp $40 | -0.5pp $13 | base $-13 | +0.5pp $-40 | +1.0pp $-68 |
UW: 25.0% down · 7.5% · 30yr · 1.5% tax · 5.0% vac · 8.0% maint · 8.0% mgmt
Financing live
Cash to close
- Down payment
- $26,225
- Closing costs
- $3,147
- Reserves months
- —
- Total cash needed
- —
Loan-product check · same deal, 3 products live
Conventional
25% down · 7.5% · 30yr
- Down + closing
- —
- Monthly P&I
- —
- Monthly cashflow
- —
- DSCR
- —
- Eligible?
- —
Personal DTI + credit; lowest rate.
DSCR
20% down · 8.5% · 30yr
- Down + closing
- —
- Monthly P&I
- —
- Monthly cashflow
- —
- DSCR
- —
- Eligible?
- —
No personal income docs; deal must DSCR.
Hard money
10% down · 12.0% · 12mo
- Down + closing
- —
- Monthly P&I
- —
- Monthly cashflow
- —
- DSCR
- —
- Eligible?
- —
Short-term bridge; refi at stabilization.
Rent comps 40 comps
| Address | Beds | Baths | Sqft | Rent | $/sqft | DOM | Units | Dist |
|---|---|---|---|---|---|---|---|---|
| 2058 Hidden Lk Corpus Christi, TX | 2.0 | 1.0 | 991 | $1,200 | $1.21 | 23d | 1 | 0.03mi |
| 6118 Hidden Cv Corpus Christi, TX | 2.0 | 1.0 | 991 | $1,050 | $1.06 | 45d | 1 | 0.07mi |
| 6136 Hidden Cv Corpus Christi, TX | 2.0 | 1.5 | 1047 | $1,450 | $1.38 | 45d | 1 | 0.07mi |
| 2002 Airline Rd Corpus Christi, TX | 1.0–3.0 | 1.0–2.0 | 794 | $1,125 | $1.42 | 15d | 19 | 0.21mi |
| 2006 Melisa Ln Corpus Christi, TX | 3.0 | 1.0 | 1324 | $1,450 | $1.10 | 15d | 1 | 0.27mi |
| 2006 Melisa Ln Corpus Christi, TX | 3.0 | 1.0 | 1324 | $1,450 | $1.10 | 23d | 1 | 0.27mi |
| 2001 Woodbend Dr Corpus Christi, TX | 2.0–3.0 | 2.0 | 1267 | $1,609 | $1.27 | 15d | 17 | 0.35mi |
| 6162 Misty Meadow Rd Corpus Christi, TX | 1.0–2.0 | 1.0–2.0 | 729 | $1,185 | $1.62 | 23d | 5 | 0.43mi |
| 6433 Aspenwood Dr Corpus Christi, TX | 3.0 | 2.0 | 1465 | $1,750 | $1.19 | 45d | 1 | 0.57mi |
| 5929 Wooldridge Rd Unit 2906 Corpus Christi, TX | 2.0 | 2.0 | 1100 | $1,000 | $0.91 | 45d | 1 | 0.62mi |
| 6620 Hardwick Dr Corpus Christi, TX | 2.0 | 1.0 | 1000 | $1,250 | $1.25 | 45d | 1 | 0.63mi |
| 5929 Wooldridge Rd Unit 2405 Corpus Christi, TX | 2.0 | 2.0 | 1100 | $1,100 | $1.00 | 45d | 1 | 0.64mi |
| 1622 Woodlawn Dr Corpus Christi, TX | 3.0 | 2.0 | 1152 | $1,895 | $1.64 | 15d | 1 | 0.65mi |
| 6606 Riding Wind Dr Corpus Christi, TX | 3.0 | 2.0 | 1325 | $1,950 | $1.47 | 45d | 1 | 0.66mi |
| 5750 Curtis Clark Dr Corpus Christi, TX | 2.0 | 1.0–2.0 | 756 | $1,560 | $2.06 | 15d | 20 | 0.67mi |
| 6617 Meadowbreeze Pkwy Corpus Christi, TX | 3.0 | 2.0 | 1284 | $1,800 | $1.40 | 46d | 1 | 0.67mi |
| 6629 Rhine Dr Unit A Corpus Christi, TX | 3.0 | 2.0 | 1350 | $1,695 | $1.26 | 15d | 1 | 0.68mi |
| 6706 Rhonda Dr Corpus Christi, TX | 2.0 | 1.0 | 1002 | $1,375 | $1.37 | 23d | 1 | 0.68mi |
| 2333 Nautical Wind Dr Corpus Christi, TX | 3.0 | 2.0 | 1273 | $1,950 | $1.53 | 45d | 1 | 0.77mi |
| 5757 S Staples St Corpus Christi, TX | 1.0–3.0 | 1.0–2.0 | 856 | $1,306 | $1.52 | 45d | 1 | 0.86mi |
| 5401 Burnham Dr Corpus Christi, TX | 1.0–2.0 | 1.0–2.0 | 801 | $1,499 | $1.87 | 15d | 10 | 0.97mi |
| 1206 Rickey Dr Corpus Christi, TX | 3.0 | 1.0 | 1131 | $1,100 | $0.97 | 15d | 1 | 1.03mi |
| 1641 Nile Dr Corpus Christi, TX | 1.0–2.0 | 1.0–2.0 | 965 | $1,255 | $1.30 | 15d | 31 | 1.05mi |
| 6813 Southhaven Dr Corpus Christi, TX | 3.0 | 2.0 | 1129 | $1,699 | $1.50 | 45d | 1 | 1.14mi |
| 2706 Grace Cir Unit B Corpus Christi, TX | 3.0 | 2.0 | 1369 | $2,095 | $1.53 | 23d | 1 | 1.18mi |
| 1901 Rodd Field Rd Unit 144 Corpus Christi, TX | 2.0 | 1.0 | 813 | $999 | $1.23 | 45d | 1 | 1.22mi |
| 6225 Saratoga Blvd Corpus Christi, TX | 1.0–3.0 | 1.0–2.0 | 962 | $1,534 | $1.59 | 15d | 27 | 1.22mi |
| 6225 Saratoga Blvd Corpus Christi, TX | 1.0–3.0 | 1.0–2.0 | 962 | $1,516 | $1.58 | 23d | 27 | 1.22mi |
| 5921 Riley Dr Corpus Christi, TX | 3.0 | 1.0 | 1134 | $1,795 | $1.58 | 23d | 1 | 1.25mi |
| 6533 Patti Corpus Christi, TX | 1.0–2.0 | 1.0–2.0 | 858 | $1,850 | $2.15 | 15d | 5 | 1.31mi |
| 1137 Bradshaw Dr Corpus Christi, TX | 3.0 | 2.0 | 1424 | $1,900 | $1.33 | 15d | 1 | 1.32mi |
| 2921 Airline Rd Corpus Christi, TX | 1.0–2.0 | 1.0–2.0 | 982 | $1,664 | $1.69 | 45d | 1 | 1.34mi |
| 6145 Ortiz Dr Corpus Christi, TX | 3.0 | 2.0 | 1376 | $1,950 | $1.42 | 23d | 1 | 1.39mi |
| 1818 Rodd Field Rd Unit B2 Corpus Christi, TX | 2.0 | 2.0 | 1200 | $1,850 | $1.54 | 15d | 1 | 1.43mi |
| 2805 Summer Ridge Dr Corpus Christi, TX | 3.0 | 2.0 | 1420 | $1,800 | $1.27 | 45d | 1 | 1.43mi |
| 1033 Bradshaw Dr Corpus Christi, TX | 3.0 | 2.0 | 1194 | $1,750 | $1.47 | 45d | 1 | 1.45mi |
| 5430 Saratoga Blvd Corpus Christi, TX | 1.0–3.0 | 1.0–2.5 | 1050 | $1,414 | $1.35 | 45d | 45 | 1.46mi |
| 5630 Nelson Ln Corpus Christi, TX | 1.0 | 1.0 | 1300 | $775 | $0.60 | 45d | 1 | 1.47mi |
| 946 Lum Ave Corpus Christi, TX | 3.0 | 1.0 | 1045 | $1,300 | $1.24 | 45d | 1 | 1.48mi |
| 5825 Hugo Dr Corpus Christi, TX | 3.0 | 1.0 | 970 | $1,550 | $1.60 | 15d | 1 | 1.49mi |
HOA detail condo
- Monthly dues
- $300 · $3,600/yr
- Likely covers
- landscaping
- Assessments
- None detected in remarks — confirm with the listing agent.
Listing history 12 events
-
2026-06-21days on market $104,900 Active 17 DOM
-
2026-06-18days on market $104,900 Active 14 DOM
-
2026-06-17days on market $104,900 Active 13 DOM
-
2026-06-16days on market $104,900 Active 12 DOM
-
2026-06-15days on market $104,900 Active 11 DOM
-
2026-06-14days on market $104,900 Active 9 DOM
-
2026-06-10days on market $104,900 Active 6 DOM
-
2026-06-09days on market $104,900 Active 5 DOM
-
2026-06-08days on market $104,900 Active 4 DOM
-
2026-06-07days on market $104,900 Active 3 DOM
-
2026-06-05remarks 681-char remark
-
2026-06-05$104,900 Active 1 DOM
ⓘ Source: listings_history table (triggers on properties + properties_extension) + one-shot
backfill from property_details.listing_events for pre-trigger history.
Tax reassessment forecast TX · Resets to sale price
- Current annual tax
- $2,623 · $219/mo
- Projected year-2 tax
- $2,623 · $219/mo
- Expected delta
- $0/yr ($0/mo · 0.0%)
ⓘ Screening estimate from a state-policy table — verify with the county assessor before closing.
Nearby sold comps map
Loading sold comps map…
Walkable amenities ~0.75 mi
Loading nearby amenities…
Taxation est. · year 1
- Rental income
- $16,696
- − Mortgage interest
- −$5,876
- − Property taxes
- −$2,623
- − Insurance
- −$524
- − Repairs & maintenance
- −$1,336
- − Management
- −$1,336
- − HOA
- −$3,600
- − Depreciation
- −$3,052
- Taxable loss
- −$1,650
- Est. tax savings @ 24.0%
- +$396
- After-tax cash flow
- $237/yr
For passive investors: Depreciation is non-cash, so a rental often shows a tax loss while cash-flowing — sheltering income. Rental losses are passive: they offset passive income freely, and up to $25,000/yr can offset ordinary (W-2) income if you actively participate and your MAGI is under $100k (phasing out to $0 by $150k); unused losses carry forward. On sale, claimed depreciation is recaptured at up to 25%, and gains may owe capital-gains tax (a 1031 exchange can defer both). Figures are a year-1 estimate at your 24.0% rate — not tax advice; consult a CPA.
Schools (NCES district)
- District
- Corpus Christi ISD
- NCES district ID
- 4815270
- Math proficiency
- 31% ▼ -18.00%
- Reading proficiency
- 35% ▼ -7.00%
- Median HH income
- $45,672
- Composite
- 28.27/100
- National rank
- #6793
- State rank
- #562 of 826 in TX
Livability — Corpus Christi
- Score
- 78/100
- State rank
- #66
- US rank
- #2404
Category grades
Schools grade is shown separately in the Schools card above.
Census & demographics
- Census place
- Corpus Christi, TX
- County
- Nueces County · 296,836 people
- City population
- 296,836
- Metro
- Corpus Christi, TX
- Population (ZIP)
- 38,631
- Household income
- $61,215
- Rent vs Own
- Severe rent burden
- 1932.0
Population outlook (Nueces County) Hauer SSP2
- Today (2025)
- 418,037 people
- By 2030
- 447,123 · +7.0%
- By 2040
- 505,911 · +21.0%
- By 2050
- 567,522 · +35.8%
- By 2075
- 729,686 · +74.6%
- By 2100
- 847,087 · +102.6%
Race, ethnicity, and origin ACS 2023
- Neighborhood character
- Diverse neighborhood (Simpson 0.56)
- Race & ethnicity
- Hispanic / Latino 57% White 34% Two or more races 29% Asian 4% Black 3%
- Hispanic origin (detail)
- Mexican 52%
- Common ancestry
- Slovak 2% Romanian 1% Lithuanian 1%
- Foreign-born
- 8% · Canada, China, Vietnam
- Languages at home
- 74% English-only · Spanish 22% Other Indo-European 1% Vietnamese 1%
Political lean MEDSL · Nueces
- 2024 margin
- R (+11.5) · D 43.8% · R 55.3%
- 2008→2024 swing
- -7.1pp toward R · 2008: -4.4pp · 2024: -11.5pp
- All cycles
- 2024: R+11.5 2020: R+2.9 2016: R+1.5 2012: R+3.2 2008: R+4.4
Not yet ingested
- Civics
- —
Market trends
- HPI YoY
- ▼ -255.29%
- Current HPI
- 177.36
- Rent YoY
- ▼ -1.53%
- Metro
- Corpus Christi, TX
- State GDP YoY
- ▲ 3.95%
- F500 in state
- 110
Industry mix (Fortune 500 HQ in TX)
| Industry | F500 HQs | Revenue |
|---|---|---|
| Energy | 16 | $1,198B |
|
||
| Technology | 5 | $198B |
|
||
| Engineering / Construction | 4 | $72B |
|
||
| Energy Services | 3 | $60B |
|
||
| Utilities | 3 | $41B |
|
||
| Healthcare | 2 | $330B |
|
||
Price history
+208.5% since first listed12 events — show timeline
- 2026-06-01 Listed $104,900 CBMLS
- 2026-02-25 Price Changed $124,000 CBMLS
- 2026-01-18 Price Changed $127,500 CBMLS
- 2025-11-03 Price Changed $129,500 CBMLS
- 2025-09-17 Relisted — CBMLS
- 2025-09-16 Pending — CBMLS
- 2025-09-03 Listed $135,500 CBMLS
- 2021-02-01 Sold (Public Records) — Public Records
- 2015-10-05 Sold (Public Records) — Public Records
- 2006-11-30 Sold (Public Records) — Public Records
- 2006-01-13 Sold (Public Records) — Public Records
- 1995-03-03 Sold (Public Records) $34,000 Public Records
Property tax history
+4.4%/yrLatest (2025): $2,623 · +12.0% YoY. Source: county tax records.
Cash-flow waterfall
monthlySold comps — $/sqft
last 12 mo · ≤1 miLoading sold comps…