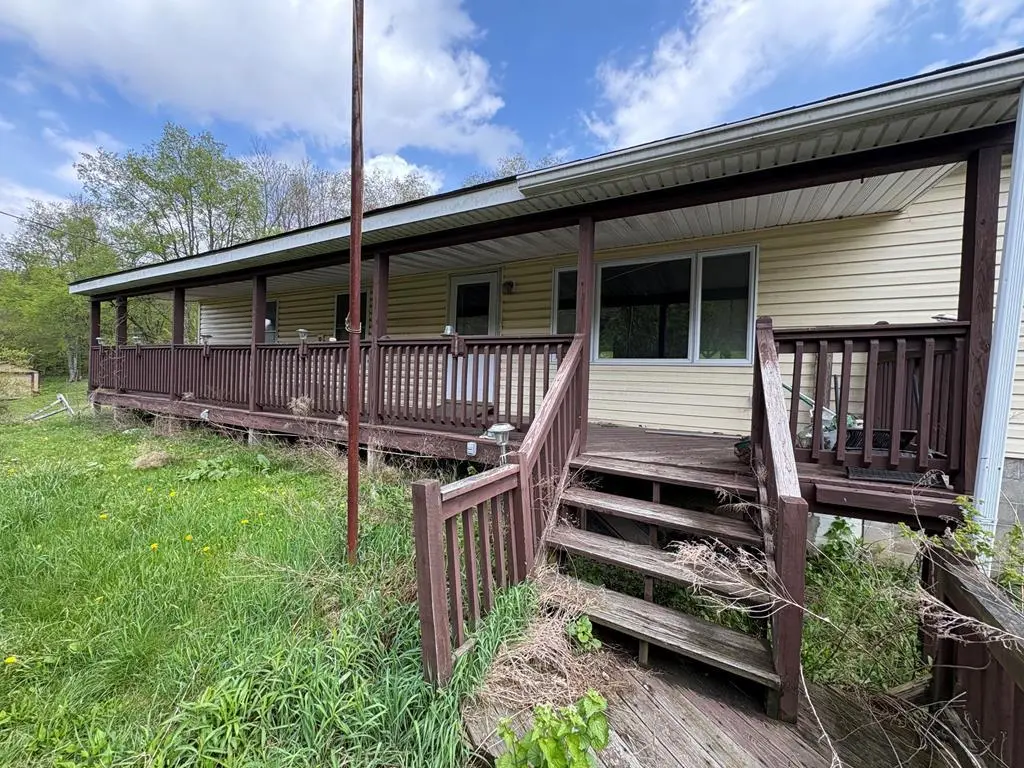
9795 State Route 155 · Keating, PA
Flood risk 1/10 · Minimal
- FEMA flood zone
- X (unshaded)
- Chance of flooding over 30 yrs
- 0.0%
- Est. flood insurance / yr
- $473 – $860
Fire risk 1/10 · Minimal
- Est. fire insurance / yr
- $511 – $949
Heat risk 1/10 · Minimal
- Hot days now (above 89°F)
- 7 days/yr
- Hot days in 30 yrs
- 18 days/yr
Wind risk 1/10 · Minimal
- Chance of severe wind over 30 yrs
- —
Air-quality risk 1/10 · Minimal
- Unhealthy air days now
- 0 days/yr
- Unhealthy air days in 30 yrs
- 0 days/yr
Risk factors via First Street. Map © Google.
Why this score? — see what drove the D grade
The composite is a weighted blend of 9 inputs, each scored 0–100. Each bar is that input's sub-score; the figure is the points it added to the 100-point composite (weight × sub-score).
- Cash flow +9.9/30.0
- ARV discount +7.5/15.0
- Appreciation +7.0/10.0
- Schools +4.8/10.0
- 1% rule +3.1/10.0
- DSCR +2.8/10.0
- Rent growth +2.5/5.0
- Livability +2.5/5.0
- Condition / age +2.5/5.0
$129,000
🖨 Deal sheet 📄 Offer letter ✓ Due diligence
Listing remarks
Excellent opportunity exists in this raised ranch located midway between Emporium and Austin. Spacious 3 bedroom, 2 bath home with addition and decks is just waiting for its new owner to polish it back to its original luster. Bring your elbow grease, a few yard tools and your vision and turn this into a great family home or possibly rehab for resale. Tri County Electric, Natural Gas and onsite well and septic make this an even better value. Please be cautious on the decks, especially the handicap ramp. And even though the electric is on a flashlight would be a good idea to navigate the basement. New coal stove in addition to forced air heat will keep you cozy on those winter days.
Key facts
- Addition
- Decks
- Forced air heat
Tags
Property features AI
Finance
- Other: No additional amenities provided
- Financial info: No financial details provided
- HOA & community: No HOA information provided
Exterior
- Parking: 2-car garage
- Security: No security features provided
- Utilities: Private well water
- Home design: Manufactured home (residential)
- Construction: Vinyl siding
- Exterior features: Shingle roof
Interior
- Kitchen: No kitchen appliance details provided
- Bedrooms: Total of 8 rooms (bedroom count not specified)
- Flooring: No flooring details provided
- Bathrooms: 2 full bathrooms
- Heating & cooling: Forced air heating (natural gas); Central air conditioning
- Interior features: Electric water heater; Full unfinished walk-out basement
- Laundry & utility: No laundry details provided
Neighborhood map
What this means for you Summary
Snapshot
- This is a 3-bed/2.0-bath other listed at $129k.
Deal economics
- At list price, monthly cash flow is $-81 ($-976/yr) — negative.
- To cash-flow at today's rent, offer at most $115k (11.1% below list).
- To meet the 1% rule (rent ≥ 1% of price), the offer needs to be $104k (19.5% below list).
- Recommended offer: $104k (19.5% below list) — sets the bar for 1% rule.
Location & tenants
- Location reads: area grade D — affects rentability + tenant quality, not the cash-flow math above.
- Austin Area SD (rural): math 45% / reading 65% proficiency, ranked #337 of 658 in PA (top 51%) — acceptable for families but not a draw, mixed tenant base, ~2y average lease.
- Market conditions: 18 active listings in the ZIP; 24 units permitted in Potter County in 2024 (0 in 5+ unit buildings).
Forward outlook
- In year one you build about $6k of equity ($892 loan paydown + $5k appreciation (3.9% local appreciation)).
- Potter County population projected at -27% by 2050 — secular population decline; favor cash flow + early exit over multi-decade hold.
- At projected returns (3.9% appreciation + 3.0% rent growth), your $36k cash investment doubles in ~6 years — after that, you're playing with house money.
- By year 6, paydown + projected appreciation supports a ~$32k cash-out refi (75% LTV) — recoverable capital for the next deal without selling this one.
Negotiation context
- It's been on market 41 days — a 3% lower offer ($125k) is reasonable based on typical stale-listing flexibility.
- 2 sale attempts since 3y ago with the ask held roughly flat each time — persistent listings suggest the price (not the market) is what's stuck; bring a comps-based counter.
Questions for the listing agent
- What do current leases actually rent for vs. the listed asking? Can we see a recent rent roll and the last 12 months of T-12 income?
- It's been on market 41 days. Have you received any prior offers? Is the seller open to a 19% concession, seller financing, or rate buy-down credit?
- Built in 1977 — when were the roof, HVAC, electrical panel, plumbing, and water heater last replaced?
- Is there a deadline driving the sale (1031 exchange, divorce, estate, relocation)? That informs how much negotiation room exists.
- The area grade is low — what's the realistic commute time and amenity access for the typical tenant pool here? Any planned neighborhood developments (good or bad) we should know about?
- What's the average days-on-market for RENTAL listings here right now (not sales)? A rising rental-DOM trend means longer vacancies and softer asking-rent achievability than the comps imply.
- What's the recent tenant-quality profile in this submarket — average credit score on applications, eviction rate, late-payment / NSF rate, and stable-employment percentage? A property-management company in the area should have these aggregated.
- How much new for-sale + rental construction is in the pipeline within 1–3 miles? Heavy new supply typically softens prices + rents 12–24 months out; constrained supply supports both.
Investment metrics
- 1% rule
- 0.81% ✗
- Cap rate
- 5.54%
- Cash-on-cash
- -2.70%
- DSCR
- 0.88
- GRM
- 10.3
CMA / ARV
No comps found within radius.
Projected returns pro-forma
3.91% appreciation · 3.0% rent growth · sell at horizon
- IRR
- 7.7%
- Equity multiple
- 1.46×
- Total profit
- $16,737
- Equity at exit
- $64,763
- IRR
- 9.9%
- Equity multiple
- 2.64×
- Total profit
- $59,337
- Equity at exit
- $105,415
Cash invested: $36,120 (down + closing). Projections, not guarantees.
Landlord ↔ Tenant lean methodology
- Overall (STATE)
- 62 Landlord-Friendly
- State Pennsylvania
- 62 Landlord-Friendly · EVEN
- County
- — inherits STATE
- City
- — inherits STATE
ZIP-level market 16720
- Home prices YoY
- 3.5%
- Active inventory
- 18
- Price-to-rent
- 10.3×
Monthly cashflow live
- Estimated rent
- $1,039 medium interval (Pro) →
- Mortgage (P&I)
- −$676
- Tax from tax record
- −$172 /mo · $2,062/yr
- Insurance
- −$54
- HOA
- −$0
- Vacancy / Maint / Mgmt
- −$218
- Net cashflow
- $-81
Break-even live
UW: 25.0% down · 7.5% · 30yr · 1.5% tax · 5.0% vac · 8.0% maint · 8.0% mgmt
Financing live
Cash to close
- Down payment
- $32,250
- Closing costs
- $3,870
- Reserves months
- —
- Total cash needed
- —
Loan-product check · same deal, 3 products live
Conventional
25% down · 7.5% · 30yr
- Down + closing
- —
- Monthly P&I
- —
- Monthly cashflow
- —
- DSCR
- —
- Eligible?
- —
Personal DTI + credit; lowest rate.
DSCR
20% down · 8.5% · 30yr
- Down + closing
- —
- Monthly P&I
- —
- Monthly cashflow
- —
- DSCR
- —
- Eligible?
- —
No personal income docs; deal must DSCR.
Hard money
10% down · 12.0% · 12mo
- Down + closing
- —
- Monthly P&I
- —
- Monthly cashflow
- —
- DSCR
- —
- Eligible?
- —
Short-term bridge; refi at stabilization.
Listing history 16 events
-
2026-06-18days on market $129,000 Active 41 DOM
-
2026-06-17days on market $129,000 Active 40 DOM
-
2026-06-16days on market $129,000 Active 39 DOM
-
2026-06-15days on market $129,000 Active 38 DOM
-
2026-06-13days on market $129,000 Active 36 DOM
-
2026-06-12days on market $129,000 Active 35 DOM
-
2026-06-09days on market $129,000 Active 32 DOM
-
2026-06-08days on market $129,000 Active 31 DOM
-
2026-06-08days on market $129,000 Active 30 DOM
-
2026-06-07days on market $129,000 Active 29 DOM
-
2026-06-04days on market $129,000 Active 26 DOM
-
2026-06-02days on market $129,000 Active 25 DOM
-
2026-06-01days on market $129,000 Active 24 DOM
-
2026-05-31days on market $129,000 Active 23 DOM
-
2026-04-30$129,000 Active 689-char remark
-
2023-09-06$185,000 Active
ⓘ Source: listings_history table (triggers on properties + properties_extension) + one-shot
backfill from property_details.listing_events for pre-trigger history.
Tax reassessment forecast PA · Partial reset (capped growth)
- Current annual tax
- $2,062 · $172/mo
- Projected year-2 tax
- $2,062 · $172/mo
- Expected delta
- $0/yr ($0/mo · 0.0%)
ⓘ Screening estimate from a state-policy table — verify with the county assessor before closing.
Climate risk First Street
- Flood 1/10 Low FEMA zone X (unshaded) · 0% chance over 30 yrs
- Wildfire 1/10 Low
- Heat 1/10 Low 7 d/yr ≥89°F today · 18 d/yr by 30 yrs out
- Wind 1/10 Low
- Air quality 1/10 Low 0 unhealthy d/yr today · 0 by 30 yrs out
Nearby sold comps map
Loading sold comps map…
Walkable amenities ~0.75 mi
Loading nearby amenities…
Taxation est. · year 1
- Rental income
- $12,468
- − Mortgage interest
- −$7,226
- − Property taxes
- −$2,062
- − Insurance
- −$645
- − Repairs & maintenance
- −$997
- − Management
- −$997
- − Depreciation
- −$3,753
- Taxable loss
- −$3,213
- Est. tax savings @ 24.0%
- +$771
- After-tax cash flow
- $-204/yr
For passive investors: Depreciation is non-cash, so a rental often shows a tax loss while cash-flowing — sheltering income. Rental losses are passive: they offset passive income freely, and up to $25,000/yr can offset ordinary (W-2) income if you actively participate and your MAGI is under $100k (phasing out to $0 by $150k); unused losses carry forward. On sale, claimed depreciation is recaptured at up to 25%, and gains may owe capital-gains tax (a 1031 exchange can defer both). Figures are a year-1 estimate at your 24.0% rate — not tax advice; consult a CPA.
Schools (NCES district)
- District
- Austin Area SD
- NCES district ID
- 4202700
- Math proficiency
- 45% ▼ -10.00%
- Reading proficiency
- 65% ▼ -5.00%
- Median HH income
- $38,291
- Composite
- 47.59/100
- National rank
- #4953
- State rank
- #337 of 658 in PA
Livability — Keating
No livability data for this city. (Only ~50 U.S. cities are tracked.)
Census & demographics
- Population (ZIP)
- 1,196
Population outlook (Potter County) Hauer SSP2
- Today (2025)
- 15,824 people
- By 2030
- 15,023 · -5.1%
- By 2040
- 13,290 · -16.0%
- By 2050
- 11,572 · -26.9%
- By 2075
- 8,144 · -48.5%
- By 2100
- 5,102 · -67.8%
Race, ethnicity, and origin ACS 2023
- Neighborhood character
- Predominantly White (97%)
- Race & ethnicity
- White 97% Two or more races 2%
- Common ancestry
- Romanian 4% Lithuanian 2% Serbian 2%
- Foreign-born
- 1%
Political lean MEDSL · Potter
- 2024 margin
- Solid R (+62.3) · D 18.4% · R 80.7%
- 2008→2024 swing
- -24.9pp toward R · 2008: -37.4pp · 2024: -62.3pp
- All cycles
- 2024: R+62.3 2020: R+60.8 2016: R+63.6 2012: R+45.9 2008: R+37.4
Not yet ingested
- Civics
- —
Market trends
- HPI YoY
- ▲ 3.91%
- Current HPI
- 115.4722
- Rent YoY
- —
- Metro
- —
- State GDP YoY
- ▲ 1.68%
- F500 in state
- 34
Industry mix (Fortune 500 HQ in PA)
| Industry | F500 HQs | Revenue |
|---|---|---|
| Healthcare | 2 | $309B |
|
||
| Insurance | 2 | $27B |
|
||
| Telecommunications / Media | 1 | $124B |
|
||
| Industrial Distribution | 1 | $22B |
|
||
| Financial Services | 1 | $20B |
|
||
| Chemicals / Materials | 1 | $18B |
|
||
Price history
-30.3% since first listed2 events — show timeline
- 2026-04-30 Listed $129,000 NMPA
- 2023-09-06 Listed $185,000 NMPA
Property tax history
+1.8%/yrLatest (2026): $2,062 · +0.6% YoY. Source: county tax records.
Cash-flow waterfall
monthlySold comps — $/sqft
last 12 mo · ≤1 miLoading sold comps…