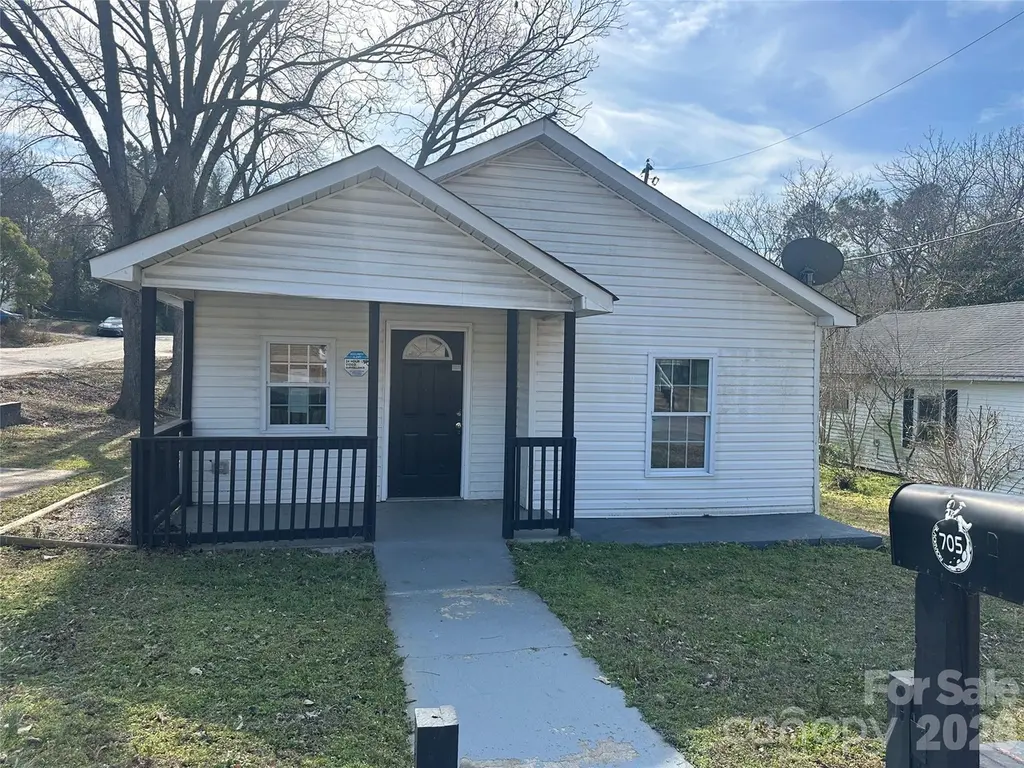
705 Sumter St · Lancaster, SC
Flood risk 1/10 · Minimal
- FEMA flood zone
- X (unshaded)
- Chance of flooding over 30 yrs
- 0.0%
- Est. flood insurance / yr
- $507 – $1,088
Fire risk 2/10 · Minimal
- Est. fire insurance / yr
- $783 – $1,453
Heat risk 6/10 · Moderate
- Hot days now (above 106°F)
- 7 days/yr
- Hot days in 30 yrs
- 16 days/yr
Wind risk 6/10 · Moderate
- Chance of severe wind over 30 yrs
- 49.0%
Air-quality risk 2/10 · Minimal
- Unhealthy air days now
- 2 days/yr
- Unhealthy air days in 30 yrs
- 2 days/yr
Risk factors via First Street. Map © Google.
Why this score? — see what drove the B grade
The composite is a weighted blend of 9 inputs, each scored 0–100. Each bar is that input's sub-score; the figure is the points it added to the 100-point composite (weight × sub-score).
- Cash flow +28.2/30.0
- ARV discount +15.0/15.0
- DSCR +10.0/10.0
- 1% rule +7.3/10.0
- Schools +3.7/10.0
- Livability +2.8/5.0
- Rent growth +2.5/5.0
- Condition / age +2.5/5.0
- Appreciation +0.0/10.0
$109,900
🖨 Deal sheet 📄 Offer letter ✓ Due diligence
Listing remarks
Bungalow Style house with 3 bedrooms and 1 full bathroom. So much potential in this home with a great layout. Great investment property or starter home!
Key facts
- 0.31 acre lot
- Built 1950
- Listed 71 days
Property features AI
Finance
- HOA & community: No HOA
Exterior
- Parking: Driveway parking (no main level garage)
- Utilities: County water; Sewer: Other (see remarks)
- Home design: Single-family residence; Residential property; One story; Above-grade living area only
- Construction: Site-built construction; Vinyl exterior; Crawl space foundation
- Exterior features: Driveway; Concrete- and paved-surface road access; Publicly maintained road
Interior
- Kitchen: No appliances specified
- Bedrooms: Three bedrooms on the main level
- Bathrooms: One full bathroom on the main level
- Heating & cooling: Heating: Other (see remarks); Cooling: Other (see remarks)
- Interior features: One living room (1 total room); No built-in kitchen appliances listed
- Laundry & utility: Electric dryer hookup
Neighborhood map
What this means for you Summary
Snapshot
- This is a 3-bed/1.0-bath single-family listed at $110k.
Deal economics
- At list price, monthly cash flow is $349 ($4k/yr) — positive.
- The deal already cash-flows at list — no discount required.
- Meets the 1% rule at list price ($1k rent vs $110k).
- Recommended offer: $103k (6.0% below list) — sets the bar for market timing.
- Cap rate 10.1% vs local median 3.0% in Lancaster — top-decile yield for the area; either an underpriced asset or a hidden risk that comps aren't pricing in. Stress-test before assuming the spread holds.
Location & tenants
- Location reads 55/100 on livability (#301 in SC) — a working-class tenant base; expect higher turnover. Strengths: cost of living A+, housing B+; Watch: schools C-, crime F, amenities F.
- Lancaster 01 (rural): math 41% / reading 47% proficiency, ranked #26 of 80 in SC (top 32%) — families likely to look elsewhere, expect single-tenant / working-renter base with shorter leases.
- Market conditions: 675 active listings in the ZIP; 6 comparable units currently listed for rent nearby; rentals at typical pace (median 18d on market — plan ~3-4 weeks tenant-placement turnaround); 976 units permitted in Lancaster County in 2024 (0 in 5+ unit buildings).
Forward outlook
- Local home prices are declining (-3.0%/yr); year-one equity from $760 of loan paydown is wiped out by about $3k of value loss. Plan a longer hold.
- Lancaster County population projected at +40% by 2050 — long-run rental-demand tailwind backs the buy-and-hold thesis.
- At projected returns (-3.0% appreciation + 3.0% rent growth), your $31k cash investment doubles in ~9 years — after that, you're playing with house money.
Negotiation context
- It's been on market 71 days — a 6% lower offer ($103k) is reasonable based on typical stale-listing flexibility.
- 5 sale attempts since 3y ago; this cycle's ask has dropped $10k (8%) from the opening price — seller is motivated, your offer sets the floor, not the list.
Risks & watch-outs
- Watch-outs: built in 1950 — expect roof / HVAC / electrical / plumbing capex.
- Climate carrying-cost: major wind risk, 49% chance of damaging wind over 30y; extreme-heat days projected 7→16/yr by 2055 (HVAC capex compounding) — expect insurance premiums to compound above CPI over the hold.
Questions for the listing agent
- It's been on market 71 days. Have you received any prior offers? Is the seller open to a 6% concession, seller financing, or rate buy-down credit?
- Built in 1950 — when were the roof, HVAC, electrical panel, plumbing, and water heater last replaced?
- Why hasn't it sold? Are there any deal-killer items the seller is aware of (foundation, flood, title, zoning, code violations)?
- Is there a deadline driving the sale (1031 exchange, divorce, estate, relocation)? That informs how much negotiation room exists.
- Crime grade is F in this area — have there been break-ins, vandalism, or insurance claims at this property in the last 3 years? What carrier currently insures it and at what premium?
- What's the average days-on-market for RENTAL listings here right now (not sales)? A rising rental-DOM trend means longer vacancies and softer asking-rent achievability than the comps imply.
- What's the recent tenant-quality profile in this submarket — average credit score on applications, eviction rate, late-payment / NSF rate, and stable-employment percentage? A property-management company in the area should have these aggregated.
- How much new for-sale + rental construction is in the pipeline within 1–3 miles? Heavy new supply typically softens prices + rents 12–24 months out; constrained supply supports both.
Investment metrics
- 1% rule
- 1.23% ✓
- Cap rate
- 10.11%
- Cash-on-cash
- 13.62%
- DSCR
- 1.61
- GRM
- 6.8
CMA / ARV
- ARV (on-the-fly)
- $183,456
- Comps found
- 12
Show comp detail 12 sales within ~0.75 mi
| Address | Dist | Beds/Ba | Sqft | Sold | Price | $/sf | Match |
|---|---|---|---|---|---|---|---|
| 403 Glenwood Ave | 0.10mi | 3/1.0 | 910 (-3%) | 2mo | $195,000 | $214 | 89 |
| 401 Glenwood Ave | 0.11mi | 3/1.0 | 962 (+3%) | 7mo | $75,000 | $78 | 84 |
| 608 Rock St | 0.16mi | 3/2.0 | 1,056 (+13%) | 4mo | $210,000 | $199 | 64 |
| 3 Hines St | 0.36mi | 3/1.0 | 1,013 (+8%) | 9mo | $200,000 | $197 | 62 |
| 705 Taylor St | 0.47mi | 3/1.0 | 899 (-4%) | 17mo | $110,000 | $122 | 57 |
| 1016 E Arch St | 0.49mi | 2/1.0 (-1) | 1,008 (+8%) | 6mo | $90,000 | $89 | 54 |
| 300 Kershaw St | 0.48mi | 3/1.0 | 1,020 (+9%) | 12mo | $190,000 | $186 | 53 |
| 330 Willow Oak Cir | 0.74mi | 3/1.0 | 962 (+3%) | 10mo | $212,500 | $221 | 52 |
| 804 Sowell St | 0.42mi | 2/2.0 (-1) | 842 (-10%) | 10mo | $165,000 | $196 | 47 |
| 1132 Threatt St | 0.64mi | 2/1.0 (-1) | 839 (-10%) | 2mo | $55,000 | $66 | 46 |
| 308 Kershaw St | 0.46mi | 3/2.0 | 1,050 (+12%) | 18mo | $217,000 | $207 | 39 |
| 112 Plyler Rd | 0.74mi | 2/1.0 (-1) | 1,005 (+7%) | 14mo | $52,000 | $52 | 37 |
Match score weights: distance 35% · size 25% · config 20% · recency 20%. Top-matched comps best support the ARV.
Projected returns pro-forma
-3.0% appreciation · 3.0% rent growth · sell at horizon
- IRR
- 3.7%
- Equity multiple
- 1.14×
- Total profit
- $4,426
- Equity at exit
- $16,386
- IRR
- 13.2%
- Equity multiple
- 2.06×
- Total profit
- $32,474
- Equity at exit
- $9,502
Cash invested: $30,772 (down + closing). Projections, not guarantees.
Landlord ↔ Tenant lean methodology
- Overall (STATE)
- 90 Strongly Landlord-Friendly
- State South Carolina
- 90 Strongly Landlord-Friendly · R+6
- County
- — inherits STATE
- City
- — inherits STATE
ZIP-level market 29720
- Home prices YoY
- -28.2%
- Active inventory
- 675
- Price-to-rent
- 6.8×
Monthly cashflow live
- Estimated rent
- $1,354 high interval (Pro) →
- Mortgage (P&I)
- −$576
- Tax from tax record
- −$98 /mo · $1,177/yr
- Insurance
- −$46
- HOA
- −$0
- Vacancy / Maint / Mgmt
- −$284
- Net cashflow
- $349
Break-even live
UW: 25.0% down · 7.5% · 30yr · 1.5% tax · 5.0% vac · 8.0% maint · 8.0% mgmt
Financing live
Cash to close
- Down payment
- $27,475
- Closing costs
- $3,297
- Reserves months
- —
- Total cash needed
- —
Loan-product check · same deal, 3 products live
Conventional
25% down · 7.5% · 30yr
- Down + closing
- —
- Monthly P&I
- —
- Monthly cashflow
- —
- DSCR
- —
- Eligible?
- —
Personal DTI + credit; lowest rate.
DSCR
20% down · 8.5% · 30yr
- Down + closing
- —
- Monthly P&I
- —
- Monthly cashflow
- —
- DSCR
- —
- Eligible?
- —
No personal income docs; deal must DSCR.
Hard money
10% down · 12.0% · 12mo
- Down + closing
- —
- Monthly P&I
- —
- Monthly cashflow
- —
- DSCR
- —
- Eligible?
- —
Short-term bridge; refi at stabilization.
Rent comps 6 comps
| Address | Beds | Baths | Sqft | Rent | $/sqft | DOM | Units | Dist |
|---|---|---|---|---|---|---|---|---|
| 3038 Miller St Unit 3016-A Lancaster, SC | 2.0 | 2.0 | 915 | $1,363 | $1.49 | 17d | 1 | 0.47mi |
| 1305 Eula St Lancaster, SC | 2.0 | 1.0 | 900 | $945 | $1.05 | 23d | 1 | 0.53mi |
| 730 Taylor St Lancaster, SC | 2.0 | 1.0 | 868 | $985 | $1.13 | 1d | 1 | 0.61mi |
| 732 Taylor St Lancaster, SC | 2.0 | 1.0 | 868 | $985 | $1.13 | 1d | 1 | 0.62mi |
| 205 S Catawba St Lancaster, SC | 2.0 | 1.0 | 950 | $1,350 | $1.42 | 1d | 1 | 0.67mi |
| 1508 Holly Hill St Unit C Lancaster, SC | 2.0 | 1.5 | 780 | $900 | $1.15 | 23d | 1 | 1.48mi |
Listing history 31 events
-
2026-06-18days on market $109,900 Active 71 DOM
-
2026-06-17days on market $109,900 Active 70 DOM
-
2026-06-16days on market $109,900 Active 69 DOM
-
2026-06-15days on market $109,900 Active 68 DOM
-
2026-06-13days on market $109,900 Active 66 DOM
-
2026-06-09days on market $109,900 Active 62 DOM
-
2026-06-08days on market $109,900 Active 61 DOM
-
2026-06-07days on market $109,900 Active 60 DOM
-
2026-06-04days on market $109,900 Active 57 DOM
-
2026-06-03days on market $109,900 Active 56 DOM
-
2026-06-02days on market $109,900 Active 55 DOM
-
2026-06-01days on market $109,900 Active 54 DOM
-
2026-05-31days on market $109,900 Active 53 DOM
-
2026-05-20price $109,900
-
2026-05-20price $109,000
-
2026-04-08$119,900 Active
-
2025-08-08historical
-
2025-07-15status Active
-
2025-07-02historical Active Under Contract
-
2025-04-11$161,500 Active
-
2024-06-03price $158,500
-
2024-04-26price $159,500
-
2024-02-10$162,000 Active
-
2024-01-22historical
-
2023-08-29soldstatus $148,000 Closed
-
2023-08-29soldstatus $148,000
-
2023-07-28status Pending
-
2023-07-23price $145,000
-
2023-07-12price $160,000
-
2023-04-01$175,000 Active
-
2022-11-01soldstatus $53,000
ⓘ Source: listings_history table (triggers on properties + properties_extension) + one-shot
backfill from property_details.listing_events for pre-trigger history.
Tax reassessment forecast SC · Resets to sale price
- Current annual tax
- $1,177 · $98/mo
- Projected year-2 tax
- $1,177 · $98/mo
- Expected delta
- $0/yr ($0/mo · 0.0%)
ⓘ Screening estimate from a state-policy table — verify with the county assessor before closing.
Climate risk First Street
- Flood 1/10 Low FEMA zone X (unshaded) · 0% chance over 30 yrs
- Wildfire 2/10 Low
- Heat 6/10 Major 7 d/yr ≥106°F today · 16 d/yr by 30 yrs out
- Wind 6/10 Major 49% chance of damaging wind over 30 yrs
- Air quality 2/10 Low 2 unhealthy d/yr today · 2 by 30 yrs out
Nearby sold comps map
Loading sold comps map…
Walkable amenities ~0.75 mi
Loading nearby amenities…
Taxation est. · year 1
- Rental income
- $16,243
- − Mortgage interest
- −$6,156
- − Property taxes
- −$1,177
- − Insurance
- −$550
- − Repairs & maintenance
- −$1,299
- − Management
- −$1,299
- − Depreciation
- −$3,197
- Taxable income
- $2,565
- Est. tax owed @ 24.0%
- −$616
- After-tax cash flow
- $3,574/yr
For passive investors: Depreciation is non-cash, so a rental often shows a tax loss while cash-flowing — sheltering income. Rental losses are passive: they offset passive income freely, and up to $25,000/yr can offset ordinary (W-2) income if you actively participate and your MAGI is under $100k (phasing out to $0 by $150k); unused losses carry forward. On sale, claimed depreciation is recaptured at up to 25%, and gains may owe capital-gains tax (a 1031 exchange can defer both). Figures are a year-1 estimate at your 24.0% rate — not tax advice; consult a CPA.
Schools (NCES district)
- District
- Lancaster 01
- NCES district ID
- 4502580
- Math proficiency
- 41% ▼ -7.00%
- Reading proficiency
- 47% ▼ -1.00%
- Median HH income
- $44,165
- Composite
- 37.23/100
- National rank
- #4462
- State rank
- #26 of 80 in SC
Livability — Lancaster
- Score
- 55/100
- State rank
- #301
- US rank
- #23178
Category grades
Schools grade is shown separately in the Schools card above.
Census & demographics
- Census place
- Lancaster, SC
- County
- Lancaster County · 91,213 people
- City population
- 53,584
- Metro
- Charlotte-Concord-Gastonia, NC-SC
- Population (ZIP)
- 53,584
- Household income
- $62,969
- Rent vs Own
- Severe rent burden
- 1158.0
Population outlook (Lancaster County) Hauer SSP2
- Today (2025)
- 105,572 people
- By 2030
- 114,865 · +8.8%
- By 2040
- 132,268 · +25.3%
- By 2050
- 148,252 · +40.4%
- By 2075
- 182,540 · +72.9%
- By 2100
- 202,237 · +91.6%
Race, ethnicity, and origin ACS 2023
- Neighborhood character
- Majority White (62%)
- Race & ethnicity
- White 62% Black 26% Hispanic / Latino 8% Two or more races 5%
- Hispanic origin (detail)
- Mexican 4%
- Common ancestry
- Slovak 3% Serbian 2% Romanian 1%
- Foreign-born
- 6% · Canada
- Languages at home
- 91% English-only · Spanish 7% Other Indo-European 1%
Political lean MEDSL · Lancaster
- 2024 margin
- Strong R (+24.8) · D 37.0% · R 61.8% · Other 1.2%
- 2008→2024 swing
- -9.9pp toward R · 2008: -14.9pp · 2024: -24.8pp
- All cycles
- 2024: R+24.8 2020: R+22.8 2016: R+25.5 2012: R+18.0 2008: R+14.9
Not yet ingested
- Civics
- —
Market trends
- HPI YoY
- ▼ -95.90%
- Current HPI
- 244.328
- Rent YoY
- —
- Metro
- Charlotte-Concord-Gastonia, NC-SC
- State GDP YoY
- ▲ 4.51%
- F500 in state
- 2
Industry mix (Fortune 500 HQ in SC)
| Industry | F500 HQs | Revenue |
|---|---|---|
| Packaging | 1 | $7B |
|
||
Price history
+107.4% since first listed18 events — show timeline
- 2026-05-20 Price Changed $109,900 CANOPYMLS as Distributed by MLS Grid
- 2026-05-20 Price Changed $109,000 CANOPYMLS as Distributed by MLS Grid
- 2026-04-08 Listed $119,900 CANOPYMLS as Distributed by MLS Grid
- 2025-08-08 Delisted — CANOPYMLS as Distributed by MLS Grid
- 2025-07-15 Relisted — CANOPYMLS as Distributed by MLS Grid
- 2025-07-02 Contingent — CANOPYMLS as Distributed by MLS Grid
- 2025-04-11 Listed $161,500 CANOPYMLS as Distributed by MLS Grid
- 2024-06-03 Price Changed $158,500 CANOPYMLS as Distributed by MLS Grid
- 2024-04-26 Price Changed $159,500 CANOPYMLS as Distributed by MLS Grid
- 2024-02-10 Listed $162,000 CANOPYMLS as Distributed by MLS Grid
- 2024-01-22 Coming Soon — CANOPYMLS as Distributed by MLS Grid
- 2023-08-29 Sold (Public Records) $148,000 Public Records
- 2023-08-29 Sold (MLS) $148,000 CANOPYMLS as Distributed by MLS Grid
- 2023-07-28 Pending — CANOPYMLS as Distributed by MLS Grid
- 2023-07-23 Price Changed $145,000 CANOPYMLS as Distributed by MLS Grid
- 2023-07-12 Price Changed $160,000 CANOPYMLS as Distributed by MLS Grid
- 2023-04-01 Listed $175,000 CANOPYMLS as Distributed by MLS Grid
- 2022-11-01 Sold (Public Records) $53,000 Public Records
Property tax history
+17.9%/yrLatest (2025): $1,177 · +1.3% YoY. Source: county tax records.
Cash-flow waterfall
monthlySold comps — $/sqft
last 12 mo · ≤1 miLoading sold comps…