2611 Vindale Rd · Tavares, FL
Flood risk 1/10 · Minimal
- FEMA flood zone
- X (unshaded)
- Chance of flooding over 30 yrs
- 0.0%
- Est. flood insurance / yr
- $507 – $1,088
Fire risk 3/10 · Minor
- Est. fire insurance / yr
- $947 – $1,759
Heat risk 8/10 · Major
- Hot days now (above 107°F)
- 7 days/yr
- Hot days in 30 yrs
- 21 days/yr
Wind risk 9/10 · Severe
- Chance of severe wind over 30 yrs
- 99.0%
Air-quality risk 2/10 · Minimal
- Unhealthy air days now
- 1 days/yr
- Unhealthy air days in 30 yrs
- 1 days/yr
Risk factors via First Street. Map © Google.
Why this score? — see what drove the D- grade
The composite is a weighted blend of 9 inputs, each scored 0–100. Each bar is that input's sub-score; the figure is the points it added to the 100-point composite (weight × sub-score).
- Cash flow +11.9/30.0
- ARV discount +7.5/15.0
- Schools +4.2/10.0
- Livability +3.8/5.0
- DSCR +3.5/10.0
- Rent growth +3.5/5.0
- 1% rule +2.7/10.0
- Condition / age +2.5/5.0
- Appreciation +0.0/10.0
$239,000
🖨 Deal sheet (PDF) 📄 Offer letter ✓ Due diligence
Listing remarks MLS
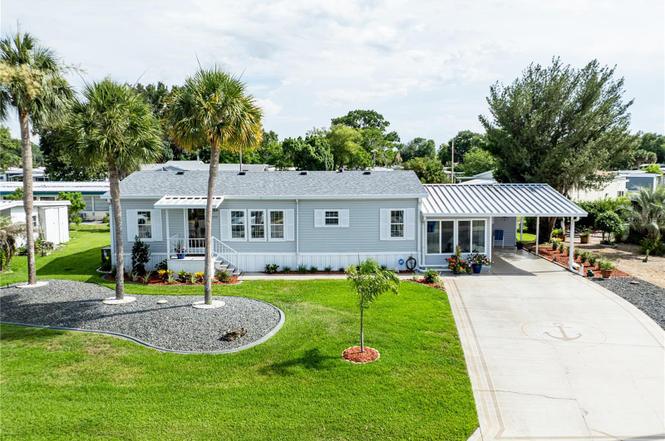
Welcome home to Imperial Terrace! A 55 plus community on the Harris chain of lakes that is nestled between Lake Eustis, Lake Harris, and Lake Dora. This furnished three bedroom newer manufactured home sits right across from the community clubhouse, swimming pool and shuffleboard court. Beautifully landscaped home with palm trees features a large painted driveway, shaded carport, screened patio and detached storage room. Inside the open and airy living space you’ll be greeted by a spacious floor plan with vaulted ceilings, neutral colors and wood style floors. The large living room flows into the kitchen and dining nook with access to a half bath and laundry room offering a stackable washer and dryer. Cook your favorite meals in the generously sized kitchen providing wood cabinets with plenty of storage space. Rest and relax in the sunny primary bedroom with a walk in closet, standing glass door shower and linen closet. The other two bedrooms have vaulted ceilings and wood style floors, and the guest bath provides a tub/shower combo. All of this with low monthly HOA fees. This active retirement community offers many activities and is golf cart friendly. Have fun enjoying the community pool clubhouse, fishing, and shuffleboard. Located right off Hwy 441 you’ll have quick access to waterfront entertainment, shopping, dining, medical facilities, major attractions, parks and airports. Come experience Florida living the way it was meant to be. Call today to schedule a showing!
Key facts
- Reimagined kitchen
- Thoughtful layout
- Updated home
Tags
Property features AI
Finance
- Other: Management: Full time; Furnished: Negotiable; Road responsibility: Public maintained
- Financial info: Total annual fees $600 (monthly $50)
- HOA & community: HOA: Imperial Terrace East Homeowners' Association; Monthly HOA fee $50 (includes pool, maintenance of grounds, escrow reserves fund); Association amenities include pool, shuffleboard court, maintenance, fence and vehicle restrictions; Buyer approval required; deed restrictions apply; Senior community; No pets allowed
Exterior
- Parking: Covered driveway; 1-car carport
- Security: Smoke detector(s)
- Utilities: Public water; Public sewer; Electricity available and connected; Cable available; Sewer connected; Irrigation equipment; 1 well on property
- Home design: Manufactured double-wide home; Single-story; Faces west; Entry level: One
- Construction: Vinyl siding; Shingle roof; Crawlspace foundation; Make/Model: MERT; Double wide body type; Built area and living area per public records
- Exterior features: Covered front porch; Covered patio/porch; Rain gutters; Storage shed(s); Mature landscaping with trees; Cleared, landscaped and paved lot; Public-maintained paved (asphalt) road
Interior
- Kitchen: Dishwasher; Microwave; Range; Refrigerator; Solid surface counters
- Bedrooms: 2 bedrooms
- Flooring: Laminate flooring
- Bathrooms: 2 full bathrooms
- Heating & cooling: Central heating (heat pump); Central air conditioning
- Interior features: Ceiling fans; Solid surface counters; Split-bedroom layout; Thermostat; Window treatments; Double-pane windows; Drapes and rods; Smoke detector(s)
- Laundry & utility: Inside laundry room with washer and dryer hookups; Electric dryer hookup; Electric water heater; Water softener
Neighborhood map
What this means for you Summary
Snapshot
- This is a 2-bed/2.0-bath manufactured listed at $239k.
Deal economics
- At list price, monthly cash flow is $-62 ($-740/yr) — negative.
- To cash-flow at today's rent, offer at most $228k (4.6% below list).
- To meet the 1% rule (rent ≥ 1% of price), the offer needs to be $184k (23.2% below list).
- Recommended offer: $184k (23.2% below list) — sets the bar for 1% rule.
- Cap rate 6.0% vs local median 4.5% in Tavares — top-decile yield for the area; either an underpriced asset or a hidden risk that comps aren't pricing in. Stress-test before assuming the spread holds.
Location & tenants
- Location reads 76/100 on livability (#220 in FL, #3,464 nationally) — a middle-class / working-renter tenant base. Strengths: crime A+, cost of living A+, housing A+; Watch: employment D, amenities F, commute F.
- Lake (suburban): math 49% / reading 50% proficiency, ranked #37 of 73 in FL (top 51%) — families likely to look elsewhere, expect single-tenant / working-renter base with shorter leases.
- Zoned schools: Tavares Elementary School (math 49% / reading 45%, grade D-, #1,191 of 2,144 statewide, top 57%, 875 students, 61% FRL); Tavares Middle School (math 43% / reading 40%, grade F, #348 of 571 statewide, top 62%, 1,070 students, 58% FRL); Tavares High School (math 32% / reading 40%, grade F, #359 of 667 statewide, top 55%, 1,507 students, 45% FRL).
- Market conditions: Rents rising fast (+4.0%/yr); 507 active listings in the ZIP; 10 comparable units currently listed for rent nearby; rentals at typical pace (median 24d on market — plan ~3-4 weeks tenant-placement turnaround); 4,799 units permitted in Lake County in 2024 (814 in 5+ unit buildings).
- This rent runs 35% of the median local income ($63k/yr) — at the standard rent-burdened threshold; future hikes will face affordability resistance.
Forward outlook
- Local home prices are declining (-3.0%/yr); year-one equity from $2k of loan paydown is wiped out by about $7k of value loss. Plan a longer hold.
- Lake County population projected at +37% by 2050 — long-run rental-demand tailwind backs the buy-and-hold thesis.
Negotiation context
- Only 9 days on market — expect competitive offers; lowballing is unlikely to land.
- 3 sale attempts since 6y ago with the ask held roughly flat each time — persistent listings suggest the price (not the market) is what's stuck; bring a comps-based counter.
- Current owner paid $175k; 37% above their basis — modest negotiation headroom, anchor on the comps not their cost.
Risks & watch-outs
- Climate carrying-cost: severe wind risk, 99% chance of damaging wind over 30y; extreme-heat days projected 7→21/yr by 2055 (HVAC capex compounding) — expect insurance premiums to compound above CPI over the hold.
Questions for the listing agent
- What do current leases actually rent for vs. the listed asking? Can we see a recent rent roll and the last 12 months of T-12 income?
- What does the HOA fee cover, when was the last increase, and are there any pending special assessments or reserve-fund shortfalls?
- Is there a deadline driving the sale (1031 exchange, divorce, estate, relocation)? That informs how much negotiation room exists.
- The area grade is low — what's the realistic commute time and amenity access for the typical tenant pool here? Any planned neighborhood developments (good or bad) we should know about?
- What's the average days-on-market for RENTAL listings here right now (not sales)? A rising rental-DOM trend means longer vacancies and softer asking-rent achievability than the comps imply.
- What's the recent tenant-quality profile in this submarket — average credit score on applications, eviction rate, late-payment / NSF rate, and stable-employment percentage? A property-management company in the area should have these aggregated.
- How much new for-sale + rental construction is in the pipeline within 1–3 miles? Heavy new supply typically softens prices + rents 12–24 months out; constrained supply supports both.
Investment metrics
- 1% rule
- 0.77% ✗
- Cap rate
- 5.98%
- Cash-on-cash
- -1.11%
- DSCR
- 0.95
- GRM
- 10.8
CMA / ARV
- ARV (on-the-fly)
- $147,312
- Comps found
- 3
Show comp detail 3 sales within ~0.75 mi
| Address | Dist | Beds/Ba | Sqft | Sold | Price | $/sf | Match |
|---|---|---|---|---|---|---|---|
| 1124 Forest Ln | 0.04mi | 2/2.0 | 1,120 (-6%) | 1mo | $139,000 | $124 | 88 |
| 1014 Southland Dr | 0.19mi | 2/2.0 | 1,104 (-7%) | 2mo | $200,000 | $181 | 78 |
| 11929 Linda Ave | 0.20mi | 2/1.5 | 1,113 (-6%) | 8mo | $90,000 | $81 | 72 |
Match score weights: distance 35% · size 25% · config 20% · recency 20%. Top-matched comps best support the ARV.
Projected returns pro-forma
-3.0% appreciation · 4.05% rent growth · sell at horizon
- IRR
- -17.1%
- Equity multiple
- 0.39×
- Total profit
- $-40,751
- Equity at exit
- $35,636
- IRR
- -7.4%
- Equity multiple
- 0.51×
- Total profit
- $-32,556
- Equity at exit
- $20,664
Cash invested: $66,920 (down + closing). Projections, not guarantees.
Landlord ↔ Tenant lean methodology
- Overall (STATE)
- 87 Strongly Landlord-Friendly
- State Florida
- 87 Strongly Landlord-Friendly · R+3
- County
- — inherits STATE
- City
- — inherits STATE
ZIP-level market 32778
- Home prices YoY
- -23.4%
- Rents YoY
- 4.0%
- Active inventory
- 507
- Price-to-rent
- 10.8×
Monthly cashflow live
- Estimated rent
- $1,837 high interval (Pro) →
- Mortgage (P&I)
- −$1,253
- Tax from tax record
- −$110 /mo · $1,316/yr
- Insurance
- −$100
- HOA
- −$50
- Vacancy / Maint / Mgmt
- −$386
- Net cashflow
- $-62
Break-even live
Sensitivity live
| Price | -10% $74 | -5% $6 | +0% $-62 | +5% $-129 | +10% $-197 |
|---|---|---|---|---|---|
| Rent | -10% $-207 | -5% $-134 | +0% $-62 | +5% $11 | +10% $83 |
| Rate | -1.0pp $59 | -0.5pp $-1 | base $-62 | +0.5pp $-124 | +1.0pp $-187 |
UW: 25.0% down · 7.5% · 30yr · 1.5% tax · 5.0% vac · 8.0% maint · 8.0% mgmt
Financing live
Cash to close
- Down payment
- $59,750
- Closing costs
- $7,170
- Reserves months
- —
- Total cash needed
- —
Loan-product check · same deal, 3 products live
Conventional
25% down · 7.5% · 30yr
- Down + closing
- —
- Monthly P&I
- —
- Monthly cashflow
- —
- DSCR
- —
- Eligible?
- —
Personal DTI + credit; lowest rate.
DSCR
20% down · 8.5% · 30yr
- Down + closing
- —
- Monthly P&I
- —
- Monthly cashflow
- —
- DSCR
- —
- Eligible?
- —
No personal income docs; deal must DSCR.
Hard money
10% down · 12.0% · 12mo
- Down + closing
- —
- Monthly P&I
- —
- Monthly cashflow
- —
- DSCR
- —
- Eligible?
- —
Short-term bridge; refi at stabilization.
Rent comps 10 comps
| Address | Beds | Baths | Sqft | Rent | $/sqft | DOM | Units | Dist |
|---|---|---|---|---|---|---|---|---|
| 615 Juniper Way Tavares, FL | 3.0 | 2.0 | 1209 | $1,900 | $1.57 | 19d | 1 | 0.40mi |
| 4721 Treasure Cay Rd Tavares, FL | 3.0 | 2.0 | 1372 | $1,900 | $1.38 | 0d | 1 | 0.55mi |
| 4950 Marsh Harbor Dr Tavares, FL | 3.0 | 2.0 | 1227 | $1,900 | $1.55 | 0d | 1 | 0.75mi |
| 4567 Barbuda Dr Tavares, FL | 3.0 | 2.0 | 1362 | $2,150 | $1.58 | 25d | 1 | 0.77mi |
| 500 E Rosewood Ln Unit 154 Tavares, FL | 3.0 | 2.0 | 1140 | $1,650 | $1.45 | 25d | 1 | 1.02mi |
| 459 E Rosewood Ln #157 Tavares, FL | 3.0 | 2.0 | 1240 | $1,400 | $1.13 | 23d | 1 | 1.02mi |
| 741 W Rosewood Ln Tavares, FL | 3.0 | 2.0 | 1125 | $1,195 | $1.06 | 5d | 1 | 1.18mi |
| 1585 Dead River Rd Tavares, FL | 3.0 | 2.0 | 1053 | $1,990 | $1.89 | 25d | 1 | 1.19mi |
| 123 N Lake Ave Tavares, FL | 2.0 | 1.0 | 1120 | $1,595 | $1.42 | 25d | 1 | 1.35mi |
| 420 S Lake Ave Lot 1 Tavares, FL | 1.0 | 1.0 | 1016 | $1,200 | $1.18 | 0d | 1 | 1.49mi |
HOA detail
- Monthly dues
- $50 · $600/yr
- Likely covers
- waterpool
Listing history 7 events
-
2026-06-21days on market $239,000 Active 9 DOM
-
2026-06-18days on market $239,000 Active 6 DOM
-
2026-06-17days on market $239,000 Active 5 DOM
-
2026-06-16days on market $239,000 Active 4 DOM
-
2026-06-15days on market $239,000 Active 3 DOM
-
2026-06-13remarks 693-char remark
-
2026-06-13$239,000 Active 1 DOM
ⓘ Source: listings_history table (triggers on properties + properties_extension) + one-shot
backfill from property_details.listing_events for pre-trigger history.
Tax reassessment forecast FL · Resets to sale price
- Current annual tax
- $1,316 · $110/mo
- Projected year-2 tax
- $1,984 · $165/mo
- Expected delta
- +$668/yr (+$56/mo · 50.7%)
ⓘ Screening estimate from a state-policy table — verify with the county assessor before closing.
Climate risk First Street
- Flood 1/10 Low FEMA zone X (unshaded) · 0% chance over 30 yrs
- Wildfire 3/10 Moderate
- Heat 8/10 Severe 7 d/yr ≥107°F today · 21 d/yr by 30 yrs out
- Wind 9/10 Extreme 99% chance of damaging wind over 30 yrs
- Air quality 2/10 Low 1 unhealthy d/yr today · 1 by 30 yrs out
Nearby sold comps map
Loading sold comps map…
Walkable amenities ~0.75 mi
Loading nearby amenities…
Taxation est. · year 1
- Rental income
- $22,040
- − Mortgage interest
- −$13,388
- − Property taxes
- −$1,316
- − Insurance
- −$1,195
- − Repairs & maintenance
- −$1,763
- − Management
- −$1,763
- − HOA
- −$600
- − Depreciation
- −$6,953
- Taxable loss
- −$4,938
- Est. tax savings @ 24.0%
- +$1,185
- After-tax cash flow
- $445/yr
For passive investors: Depreciation is non-cash, so a rental often shows a tax loss while cash-flowing — sheltering income. Rental losses are passive: they offset passive income freely, and up to $25,000/yr can offset ordinary (W-2) income if you actively participate and your MAGI is under $100k (phasing out to $0 by $150k); unused losses carry forward. On sale, claimed depreciation is recaptured at up to 25%, and gains may owe capital-gains tax (a 1031 exchange can defer both). Figures are a year-1 estimate at your 24.0% rate — not tax advice; consult a CPA.
Schools (NCES district)
- District
- Lake
- NCES district ID
- 1201050
- Math proficiency
- 49% ▼ -7.00%
- Reading proficiency
- 50% ▼ -4.00%
- Median HH income
- $46,632
- Composite
- 42.05/100
- National rank
- #3327
- State rank
- #37 of 73 in FL
Livability — Tavares
- Score
- 76/100
- State rank
- #220
- US rank
- #3464
Category grades
Schools grade is shown separately in the Schools card above.
Census & demographics
- Census place
- Tavares, FL
- County
- Lake County · 364,602 people
- City population
- 25,042
- Metro
- Orlando-Kissimmee-Sanford, FL
- Population (ZIP)
- 25,042
- Household income
- $63,472
- Rent vs Own
- Severe rent burden
- 586.0
Population outlook (Lake County) Hauer SSP2
- Today (2025)
- 386,640 people
- By 2030
- 417,107 · +7.9%
- By 2040
- 476,676 · +23.3%
- By 2050
- 531,296 · +37.4%
- By 2075
- 648,303 · +67.7%
- By 2100
- 698,530 · +80.7%
Race, ethnicity, and origin ACS 2023
- Neighborhood character
- Predominantly White (72%)
- Race & ethnicity
- White 72% Hispanic / Latino 14% Two or more races 8% Black 8% Asian 2%
- Hispanic origin (detail)
- Mexican 1% Puerto Rican 7% Cuban 2% Dominican 1%
- Common ancestry
- Romanian 4% Italian 3% Slovak 2%
- Foreign-born
- 9% · Canada, Dominican Republic, Jamaica
- Languages at home
- 85% English-only · Spanish 11% Other Indo-European 2% Other Asian/Pacific 1%
Political lean MEDSL · Lake
- 2024 margin
- Strong R (+24.7) · D 37.3% · R 62.0%
- 2008→2024 swing
- -11.2pp toward R · 2008: -13.5pp · 2024: -24.7pp
- All cycles
- 2024: R+24.7 2020: R+20.0 2016: R+23.1 2012: R+17.1 2008: R+13.5
Not yet ingested
- Civics
- —
Market trends
- HPI YoY
- ▼ -88.07%
- Current HPI
- 288.7123
- Rent YoY
- ▲ 4.05%
- Metro
- Orlando-Kissimmee-Sanford, FL
- State GDP YoY
- ▲ 3.28%
- F500 in state
- 36
Industry mix (Fortune 500 HQ in FL)
| Industry | F500 HQs | Revenue |
|---|---|---|
| Industrial Technology | 2 | $29B |
|
||
| Insurance | 2 | $17B |
|
||
| Retail | 1 | $60B |
|
||
| Technology Distribution | 1 | $58B |
|
||
| Homebuilding | 1 | $35B |
|
||
| Technology Manufacturing | 1 | $35B |
|
||
Price history
+457.1% since first listed12 events — show timeline
- 2026-06-12 Listed $239,000 Stellar MLS as Distributed by MLS Grid
- 2023-02-21 Sold (Public Records) $175,000 Public Records
- 2023-02-17 Sold (MLS) $175,000 Stellar MLS as Distributed by MLS Grid
- 2023-01-19 Pending — Stellar MLS as Distributed by MLS Grid
- 2023-01-13 Listed $190,000 Stellar MLS as Distributed by MLS Grid
- 2020-08-25 Sold (Public Records) $148,500 Public Records
- 2020-08-24 Sold (MLS) $148,500 Stellar MLS as Distributed by MLS Grid
- 2020-08-04 Pending — Stellar MLS as Distributed by MLS Grid
- 2020-07-28 Listed $148,500 Stellar MLS as Distributed by MLS Grid
- 1999-10-05 Sold (Public Records) $47,800 Public Records
- 1996-08-30 Sold (Public Records) $45,500 Public Records
- 1982-07-01 Sold (Public Records) $42,900 Public Records
Property tax history
+10.9%/yrLatest (2025): $1,316 · -24.1% YoY. Source: county tax records.
Cash-flow waterfall
monthlySold comps — $/sqft
last 12 mo · ≤1 miLoading sold comps…